Hamilton County sits immediately north of Indianapolis, but its map does not read like one continuous suburban block. You can download the high-resolution JPG ZIP directly from this page to enlarge small road and creek labels, print the maps, or keep the county, city, water/terrain, and elevation views together. Carmel and Fishers anchor the southern edge, Westfield fills the southwest-to-central gap, and Noblesville stands near the middle of the county’s busiest road pattern. Farther north, Cicero, Sheridan, Arcadia, and Atlanta are spaced much more widely. This Hamilton County Indiana Map page connects those settlement patterns with the White River, Morse Reservoir, Geist Reservoir, and the county’s broad elevation changes.
The easiest way to get oriented is to begin with the south. Carmel lies in the southwest, Fishers in the southeast, and Noblesville is north of both near the center. Westfield sits west of Noblesville and north of Carmel, so the four larger cities occupy a relatively compact part of the county. North of that cluster, the gaps open quickly. Cicero appears beside Morse Reservoir, Sheridan is separated to the west, and Arcadia and Atlanta continue north along the State Road 19 corridor. The contrast between a dense southern group and a looser northern pattern is one of the clearest features across all four map views.
Water and relief add another layer to that pattern. Morse Reservoir occupies the north-central part of the county, while the White River runs south through the middle and past Noblesville. Geist Reservoir touches the southern edge, and smaller creeks enter the main river system from both sides. On the elevation map, the White River corridor is noticeably lower than much of the western side of the county. Reading the settlement, water, and elevation views together makes it easier to understand why the same rectangular county boundary contains very different-looking landscapes from west to center and from south to north.
Table of Contents
Carmel, Fishers, Westfield, and Noblesville form a tight southern cluster
The general county map is most useful when you need roads, city names, and the county outline at the same time. Carmel and Fishers sit near the southern edge, with Westfield to the northwest and Noblesville farther north and east. Their labels occupy a much smaller area than the northern towns, so even before looking at population figures the map suggests a denser settlement pattern in the southern half. The large blank spaces around Sheridan and between the smaller northern communities create a very different visual rhythm.
Noblesville is especially helpful as a road reference point. State Road 32 runs east-west through the city, State Road 19 continues north toward Cicero and Arcadia, State Road 37 heads northeast, and State Road 38 extends toward the eastern side of the county. You do not need to memorize every route number to use the map effectively. If you remember that Noblesville is where several important directions meet, it becomes easier to place Carmel and Westfield to the southwest and west, Fishers to the southeast, and the smaller northern communities above it.
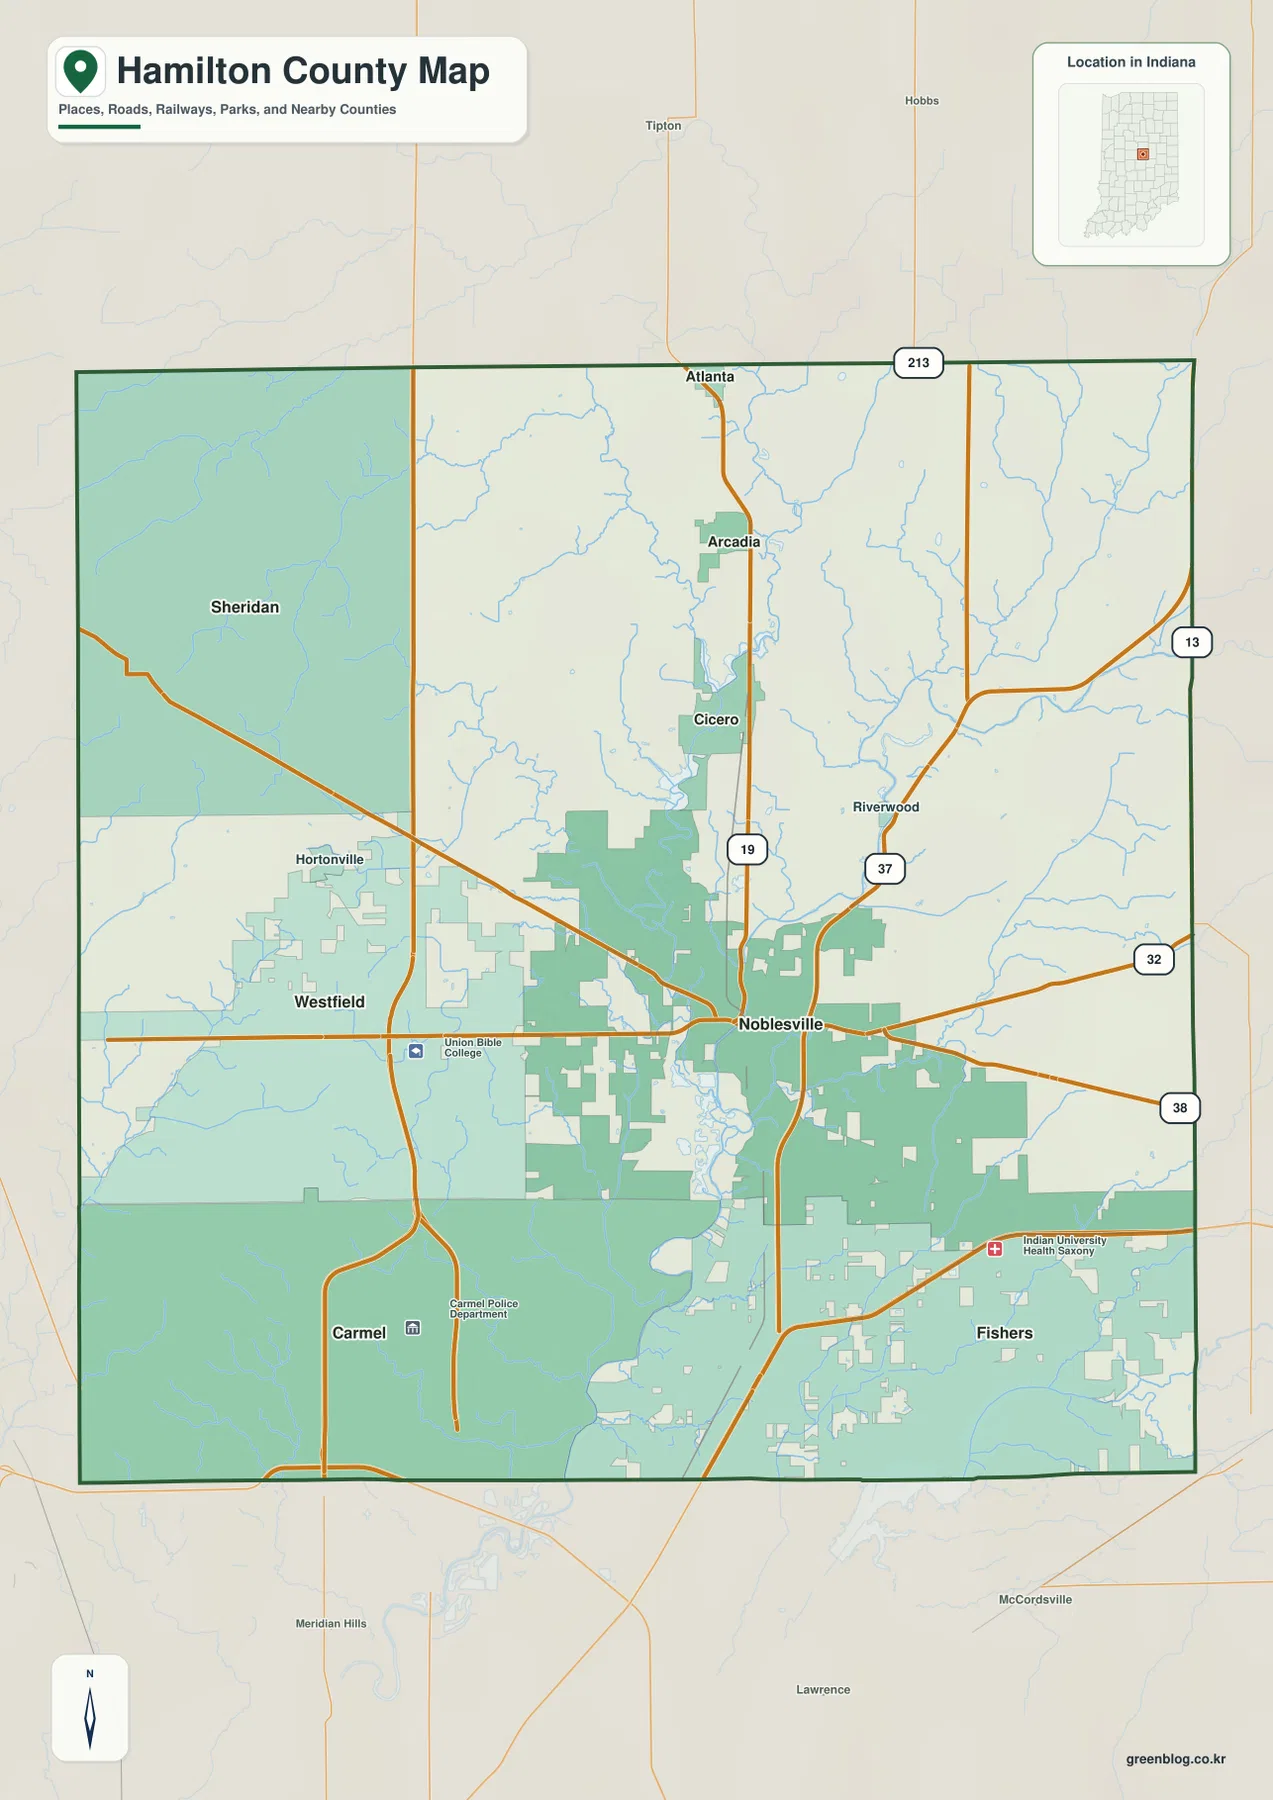
State Road 19 creates the clearest north-south sequence on the map. From Noblesville it runs toward Cicero, then continues past Arcadia and toward Atlanta near the northern boundary. Sheridan does not sit on that same line; it is off to the west, giving the northwestern part of Hamilton County a separate reference point. This matters when moving between the city and water maps because Cicero is closely associated with Morse Reservoir, while Sheridan is easier to recognize by its western position rather than by a large lake or a dense road junction.
The southern cities also help explain why a single “Hamilton County” label can hide a lot of internal variation. Carmel and Fishers are near the Indianapolis side of the county, Westfield sits slightly farther north, and Noblesville connects the southern cluster to the north-central towns. The general map is therefore less about finding one center and more about seeing several linked centers. Once those are located, the water and elevation maps make more sense because the White River, reservoir system, and lower ground cut through a settlement pattern that is already strongly concentrated toward the south.
The six-city index shows how sharply city size drops outside the south
The city view removes much of the road detail and ranks six major places. Fishers is listed at 102,337 and Carmel at 101,651, making the two southern cities nearly equal in the printed index. Noblesville follows at 73,362, with Westfield at 54,677. The values then fall steeply to Cicero at 5,509 and Sheridan at 3,205. These are the figures printed on the supplied map, not a promise that they are the newest official population estimates, so current demographic work should use the latest Census releases. For map reading, however, the ranking is useful because it reinforces the same spatial pattern visible in the general map.
| Rank | City | Value printed on map | County position |
|---|---|---|---|
| 1 | Fishers | 102,337 | Southeast |
| 2 | Carmel | 101,651 | Southwest |
| 3 | Noblesville | 73,362 | South-central |
| 4 | Westfield | 54,677 | West / south-central |
| 5 | Cicero | 5,509 | North-central |
| 6 | Sheridan | 3,205 | Northwest / west |
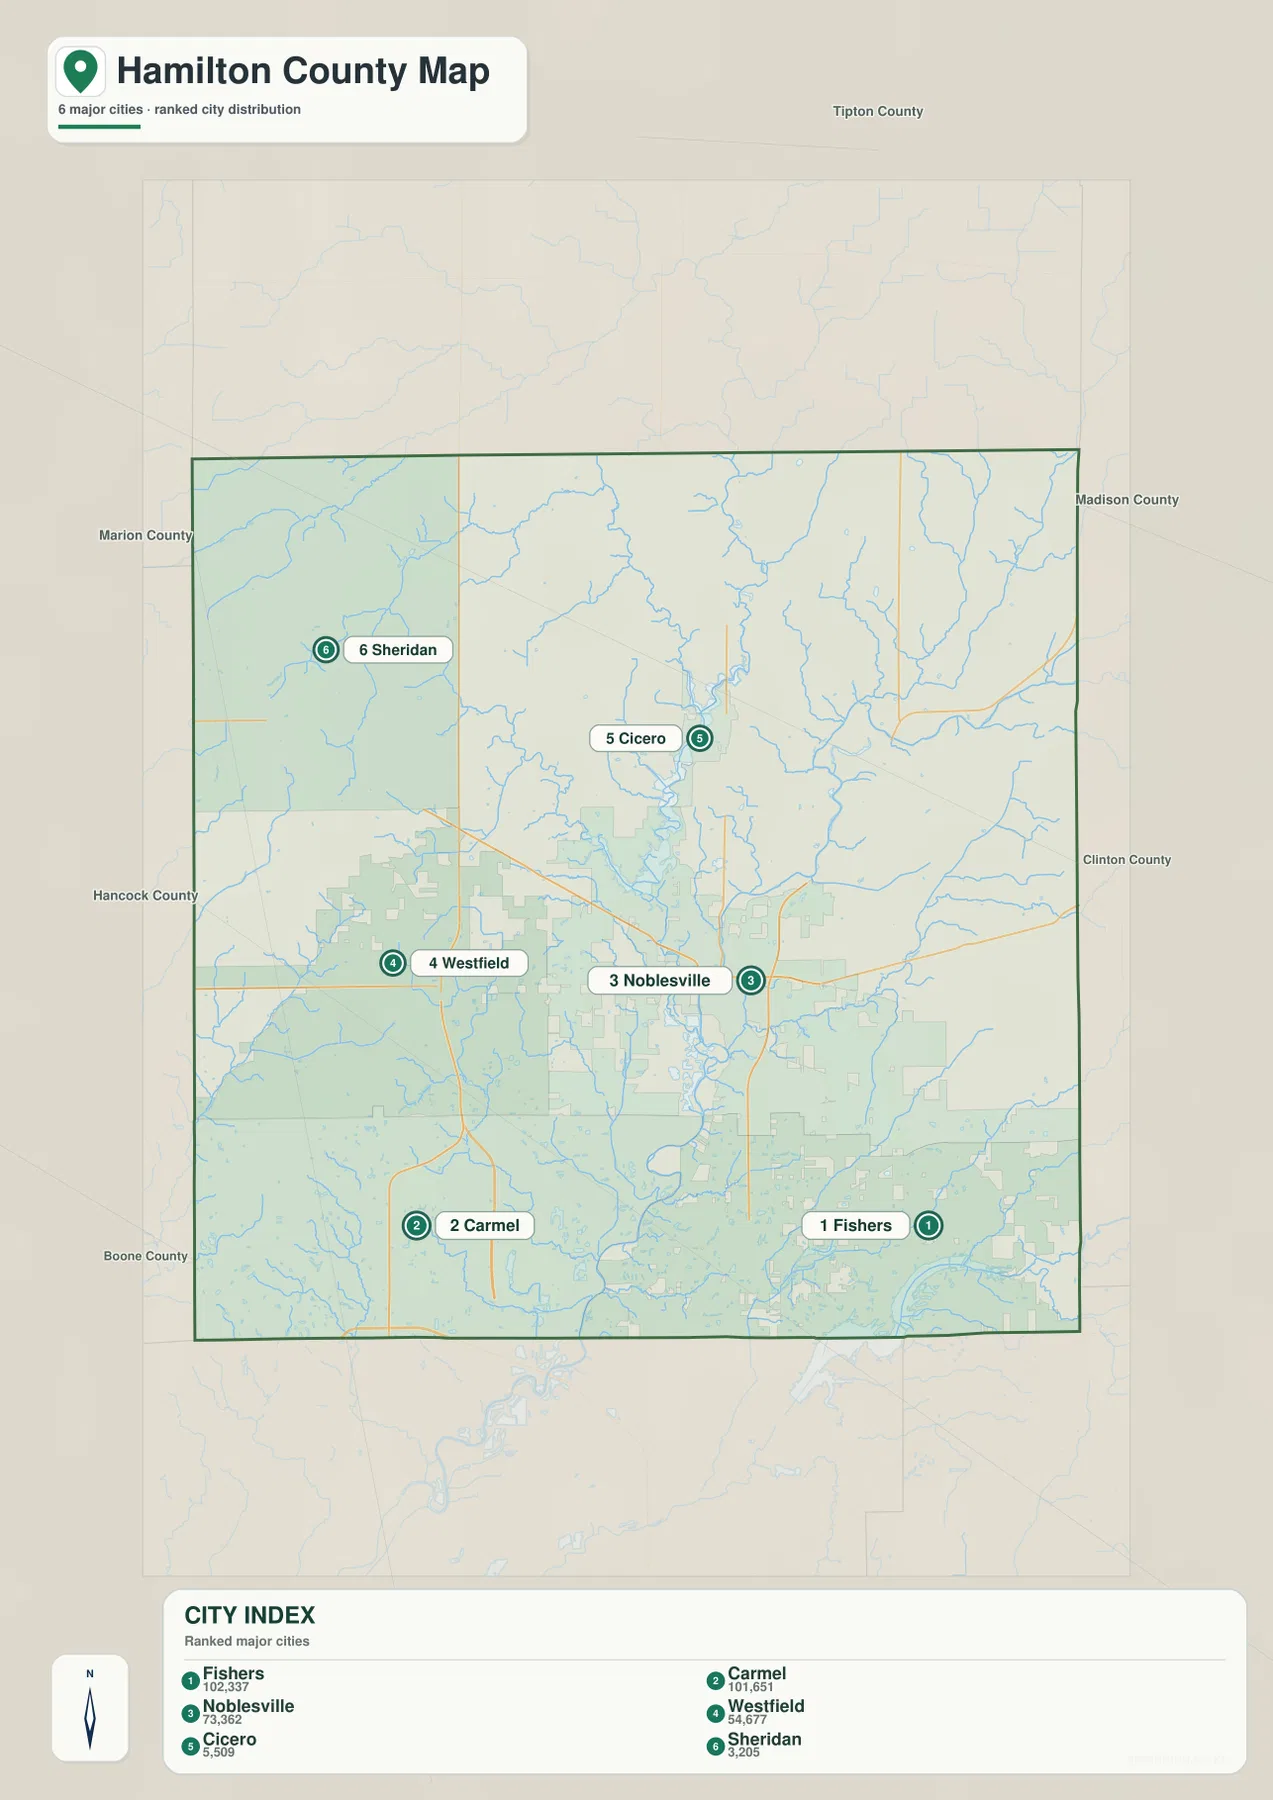
The positions are as important as the numbers. Fishers and Carmel sit on opposite sides of the southern edge, Noblesville is centered above them, and Westfield fills the western part of the same general zone. Cicero is clearly separated to the north, while Sheridan is farther west. That arrangement creates a triangular group of large cities in the south and center, followed by a much more open northern landscape. It is a useful distinction when comparing the city map with the elevation view because the urban concentration does not simply follow one straight river or one single band of high or low ground.
Arcadia and Atlanta are visible north of Cicero on the general county map but are not part of the six-place ranking. They remain useful northern reference points even though the city index is limited to six highlighted places. When you need the broader settlement pattern, use the general map and notice how the smaller towns continue north along State Road 19. When you need a quick comparison of the larger places, the city index is simpler. The two views answer different questions without requiring the reader to treat every labeled community as if it were the same size.
This map should also not be mistaken for a commuting, traffic, or municipal-boundary analysis. The circles and labels show selected places and their printed index values. They do not define the full developed footprint of each city, and they do not show where residents travel for work. Its strength is much more basic: it tells you where the six highlighted cities sit relative to one another and makes the south-to-north change in settlement scale very easy to see.
Morse Reservoir and the White River organize the county’s water pattern
The terrain-and-water map shifts attention away from roads. Morse Reservoir is the dominant water body in the north-central area, with Cicero Creek entering from the north and Little Cicero Creek approaching from the northwest. Hinkle Creek lies to the west of the reservoir. Because Cicero is easy to locate on the general map, the reservoir provides a strong bridge between the settlement and water views: the town and the large branching water body occupy the same north-central part of Hamilton County.
South of Morse Reservoir, the White River becomes the main north-south water feature. It bends through the middle of the county and passes the Noblesville area before continuing toward the southern boundary. Stony Creek approaches from the east, while Cool Creek reaches toward the river system from the west. Farther south and east, Sand Creek and Mud Creek appear as additional tributaries. Geist Reservoir is visible at the southern edge, giving the county another large water landmark well south of Morse Reservoir.
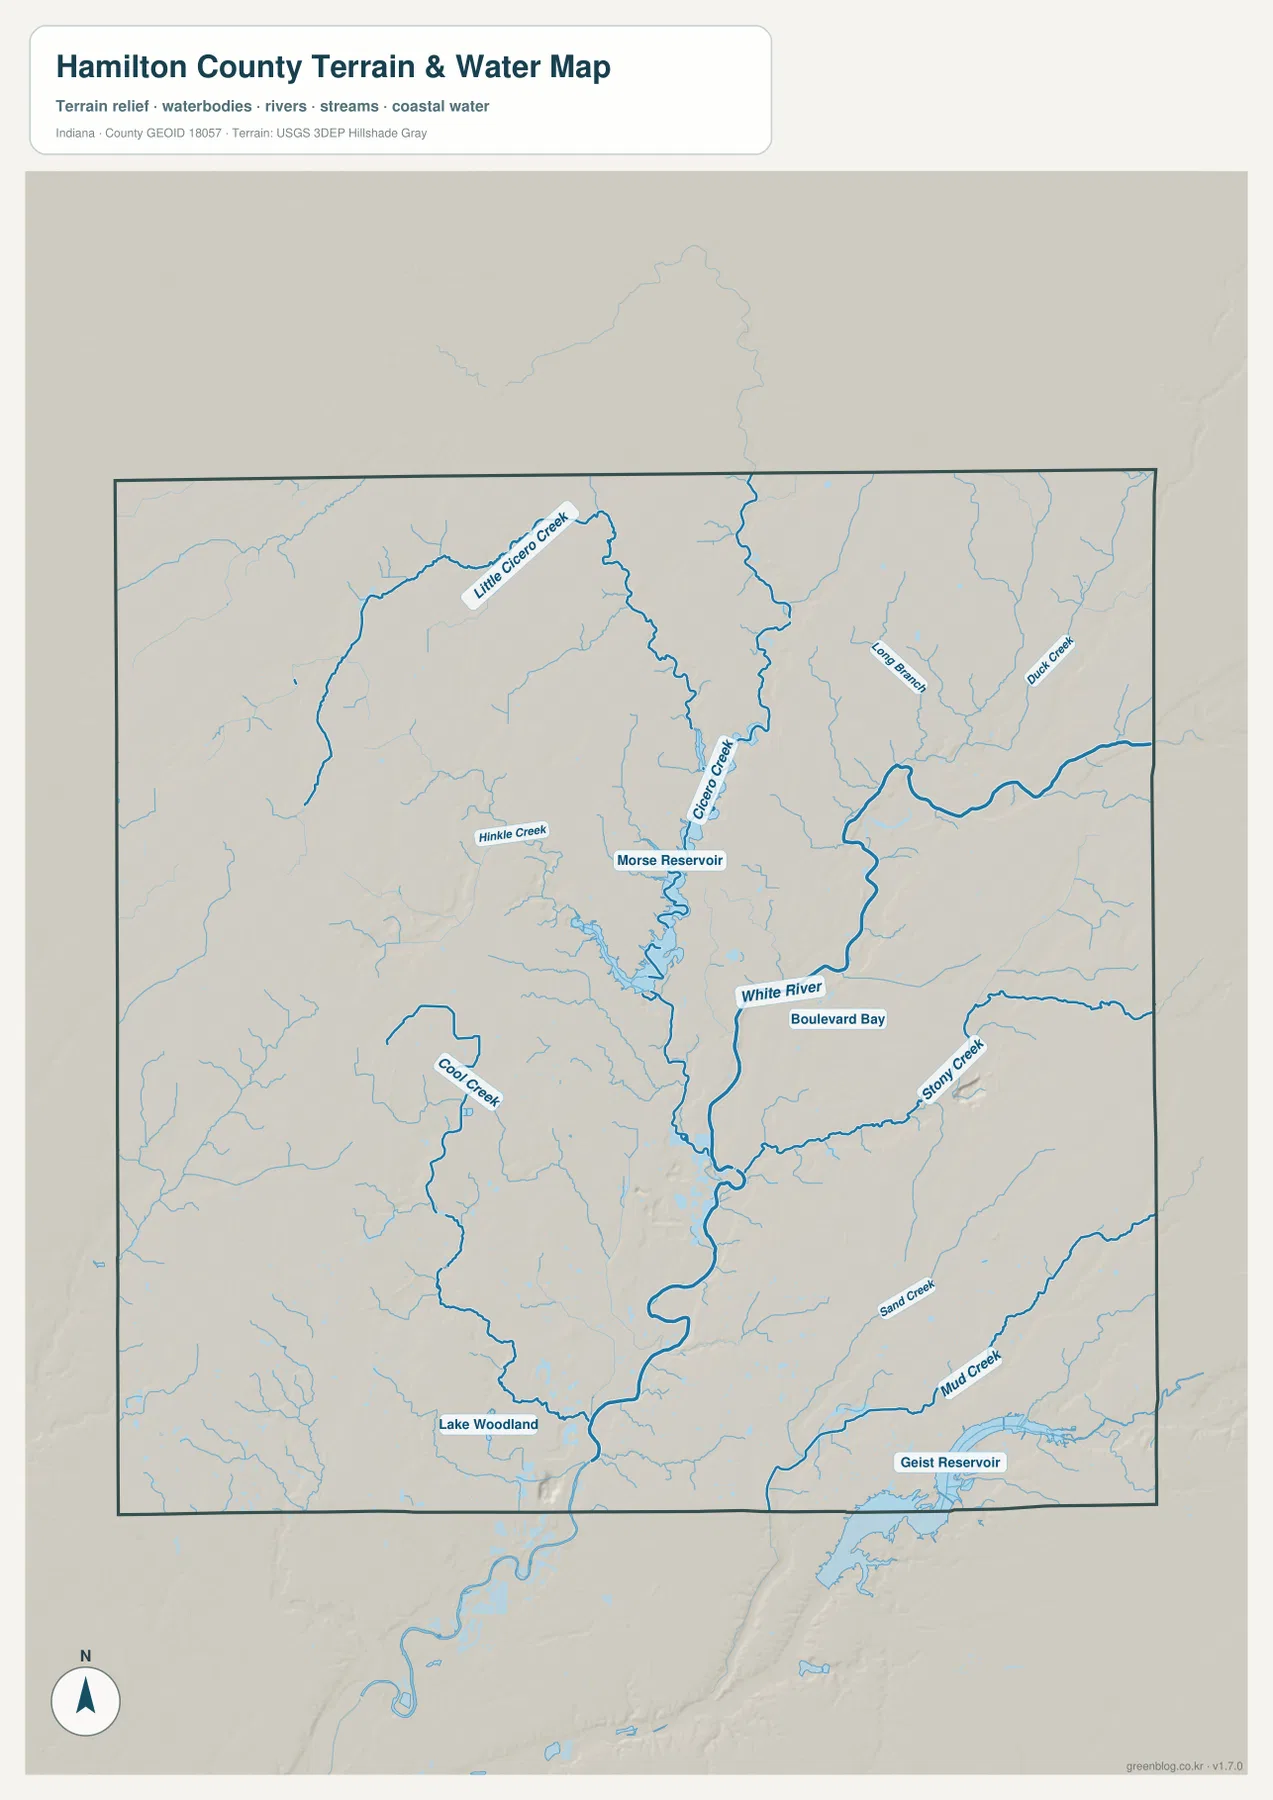
The smaller streams help divide the county into recognizable pieces. Long Branch and Duck Creek are labeled in the northeast. Stony Creek marks a longer east-side drainage line near the central part of the county, while Cool Creek gives the western side of the southern half its own prominent stream. Lake Woodland appears toward the southwest, and Geist Reservoir broadens dramatically along the southern edge. Rather than memorizing every creek name, it is easier to use the White River as the spine and then identify which tributaries join or approach it from east and west.
Official Hamilton County Parks information also reflects the importance of these waters. Morse Park and Beach sits on Morse Reservoir, and county park resources include the White River Greenway and the White River Campground. Those official pages are useful companions to the map because they show that the reservoir and river are not just cartographic features; they are also recurring landmarks in the county’s public recreation network. That connection is helpful when a reader recognizes a water name on the map but wants a real local reference point.
The water map is still a reference map, not a flood or navigation product. A blue line shows the mapped watercourse or water feature, but it does not tell you flood probability, legal riparian boundaries, navigability, current water level, or water quality. For those questions, consult the appropriate federal, state, or local authority. Here, the map is best used for understanding where the major reservoirs, river, and tributaries lie in relation to the county’s cities and terrain.
Higher western ground drops toward the White River corridor
The elevation map gives Hamilton County an immediately different appearance. Its legend lists an actual county range of about 150 to 298 meters, with a mean of 259 meters. Greens mark lower ground, while yellows and browns represent higher terrain. The broad western side of the county contains extensive brown and tan areas, but a long green lowland follows the White River through the center and south. That contrast is much stronger than it appears on the general road map.
The west does not rise as one flat plateau. Narrower valleys cut through the higher surface, creating branching green or yellow-green lines within the browner background. Moving east toward the White River, the colors generally become lighter and greener. Around Noblesville and farther south, the river corridor widens into a larger low area. The pattern helps explain why the terrain-and-water map and the elevation map work well together: many of the named streams occupy the lower cuts visible in the relief colors.
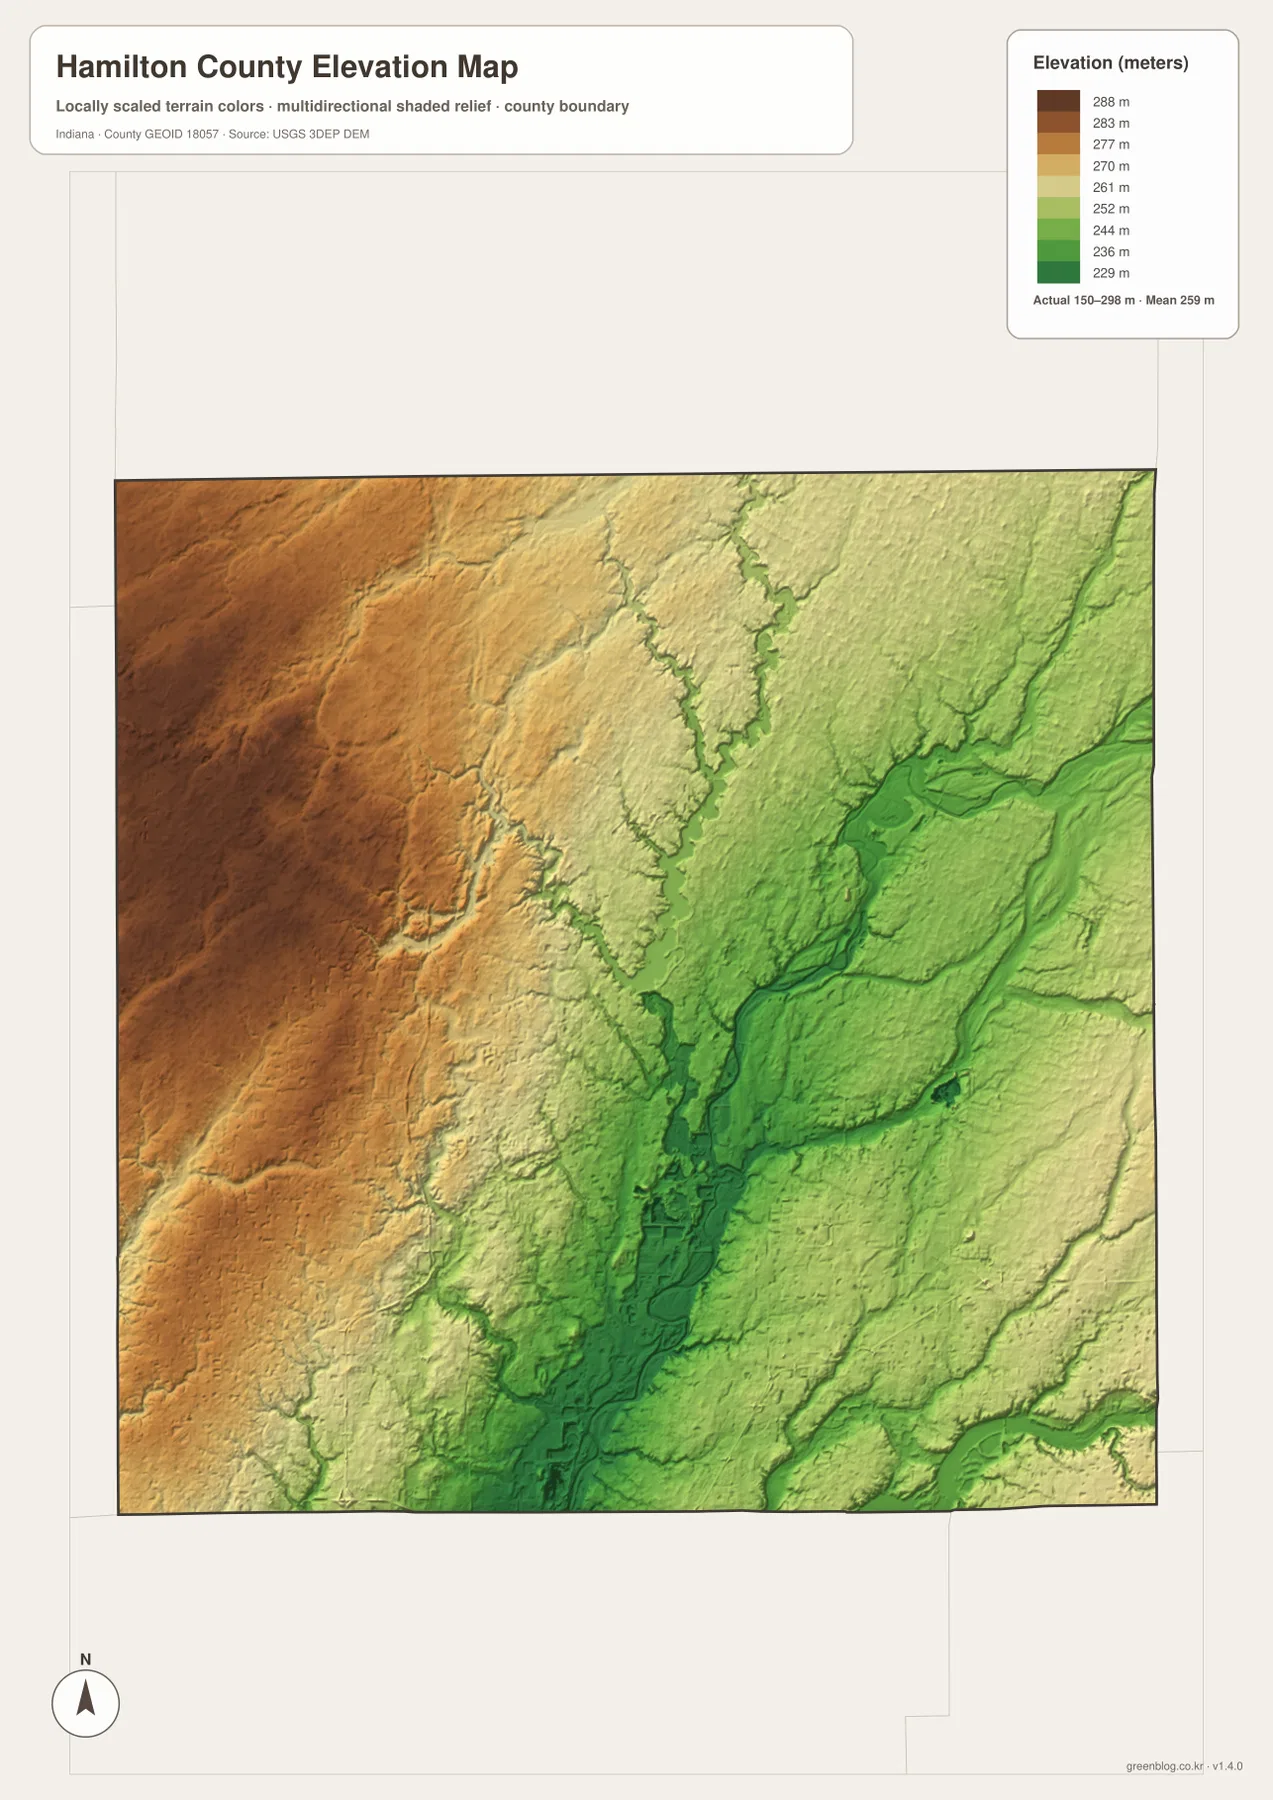
The lowest-looking corridor is closely aligned with the central river system rather than with a city boundary. That is important because it prevents an overly simple interpretation of the county. Carmel, Fishers, Westfield, and Noblesville are large or prominent cities on the settlement maps, but city size is not the same thing as elevation. Roads, development history, infrastructure, and land use all influence settlement. The relief map should therefore be used to understand the shape of the land, not to claim that topography alone explains where people live.
The eastern side is generally lower than the high western band but still contains many shallow ridges and stream-cut valleys. Green lines trace drainage routes through yellow-green terrain, especially toward the northeast and southeast. This makes the county more varied than a simple “flat central Indiana” label might suggest. The differences are modest at a regional scale, yet within the county they are strong enough to make the western high ground and central river lowland obvious on a shaded elevation surface.
The 150–298 m range should not be used as a parcel-level measurement. The elevation layer is a generalized surface designed to show county-scale relief. A home site, road grade, drainage project, or construction plan requires source elevation data or professional survey work. The USGS 3D Elevation Program is a better starting point for precise terrain data. For ordinary map reading, the supplied elevation image is most useful as a visual explanation of where the county rises and falls around the White River system.
Choose the map by the question you are trying to answer
For a first look, use the general county map. It combines the boundary, road network, and a broader set of place names, so it is the fastest way to locate Carmel, Fishers, Westfield, Noblesville, Cicero, Sheridan, Arcadia, and Atlanta in one frame. It is also the best view for following State Roads 19, 32, 37, and 38. Once those reference points are familiar, the other maps become easier because you already know whether you are looking at the southern city cluster, the central river corridor, or the more open north.
Use the city index when relative settlement size matters more than road detail. It immediately shows Fishers and Carmel at the top of the printed ranking, with Noblesville and Westfield forming the next tier and Cicero and Sheridan much smaller. If a place such as Arcadia or Atlanta is missing from that six-city view, return to the general map rather than assuming it is absent from the county. The city map is intentionally selective.
For reservoirs, rivers, and tributaries, the terrain-and-water view is the better choice. Start with Morse Reservoir and the White River, then branch outward to Little Cicero Creek, Stony Creek, Cool Creek, Sand Creek, Mud Creek, and Geist Reservoir. If you want to understand the land around those waters, place the elevation map beside it. The green White River lowland and higher western terrain make the drainage pattern much easier to interpret. Neither view should replace official flood mapping, navigation information, or survey-grade elevation data.
The web images are sized for quick reading on a page. For small road labels, creek names, fine relief colors, or larger-format printing, the original JPG files are more useful. The download archive contains the same county, city, water/terrain, and elevation maps shown above, each at 2572×3638 pixels. Keeping the four originals together also makes comparison easier: locate a city on one map, find the nearby river on another, and then check whether that location falls on higher or lower ground.
A simple comparison workflow works well with this county. Find Noblesville and Cicero on the general map, switch to the water map to see Morse Reservoir and the White River between them, and then open the elevation view to see the lower river corridor. In the south, compare Carmel and Fishers on the city index with the road map to understand their positions on opposite sides of the county. Using the maps as a set reveals relationships that are easy to miss when any one image is viewed alone.
Frequently Asked Questions
Why do the largest highlighted cities appear so concentrated in southern Hamilton County?
The supplied six-city index places Fishers and Carmel along the southern edge, Noblesville north of them near the center, and Westfield to the west. Those four places carry much larger printed index values than Cicero and Sheridan, which are farther north or west. The map therefore creates a strong south-heavy pattern. It is a settlement comparison, not a formal metropolitan-boundary or commuting map, so it should not be used to define the exact extent of the Indianapolis urban area.
Which map best shows the relationship between Morse Reservoir and the White River?
The terrain-and-water map is the clearest choice. Morse Reservoir occupies the north-central area, and the White River continues south through the county past the Noblesville area. Cicero Creek, Little Cicero Creek, Stony Creek, Cool Creek, and other tributaries add context around the main system. Use the elevation map beside it if you also want to see the lower terrain associated with the central river corridor.
Can the 150–298 m elevation range be used as the exact height of a property?
No. The legend describes the county-wide elevation range shown on the supplied map, with a mean of 259 m. The colored surface is intended for broad comparison of higher and lower terrain, such as the western high ground and the lower White River corridor. Exact parcel, building, drainage, or engineering elevations should come from source elevation data or a professional survey rather than from the generalized map image.
Map File Information
This ZIP contains the Hamilton County general map, city index map, terrain-and-water map, and elevation map as high-resolution JPG originals for enlarged viewing and print use.
- File Type: ZIP containing four 2572×3638px JPG files
Related Maps
Sources and References
The article is based primarily on the supplied Hamilton County map set and asset manifest. The following official and public resources are useful for checking county recreation context and the underlying boundary, water, and elevation data.
- Hamilton County Parks & Recreation – official county park information connected with the White River and Morse Reservoir
- Morse Park and Beach – official county information for the park on Morse Reservoir
- U.S. Census Bureau TIGER/Line Shapefiles – boundary and geographic reference data
- USGS National Hydrography – hydrography reference data
- USGS 3D Elevation Program – elevation source data
Green Map creates custom-edited map images using open geographic data sources such as geoBoundaries, Natural Earth, OpenStreetMap, and government open data.
These maps are edited visual materials, not raw data files, and are provided for education, documents, presentations, and graphic reference.