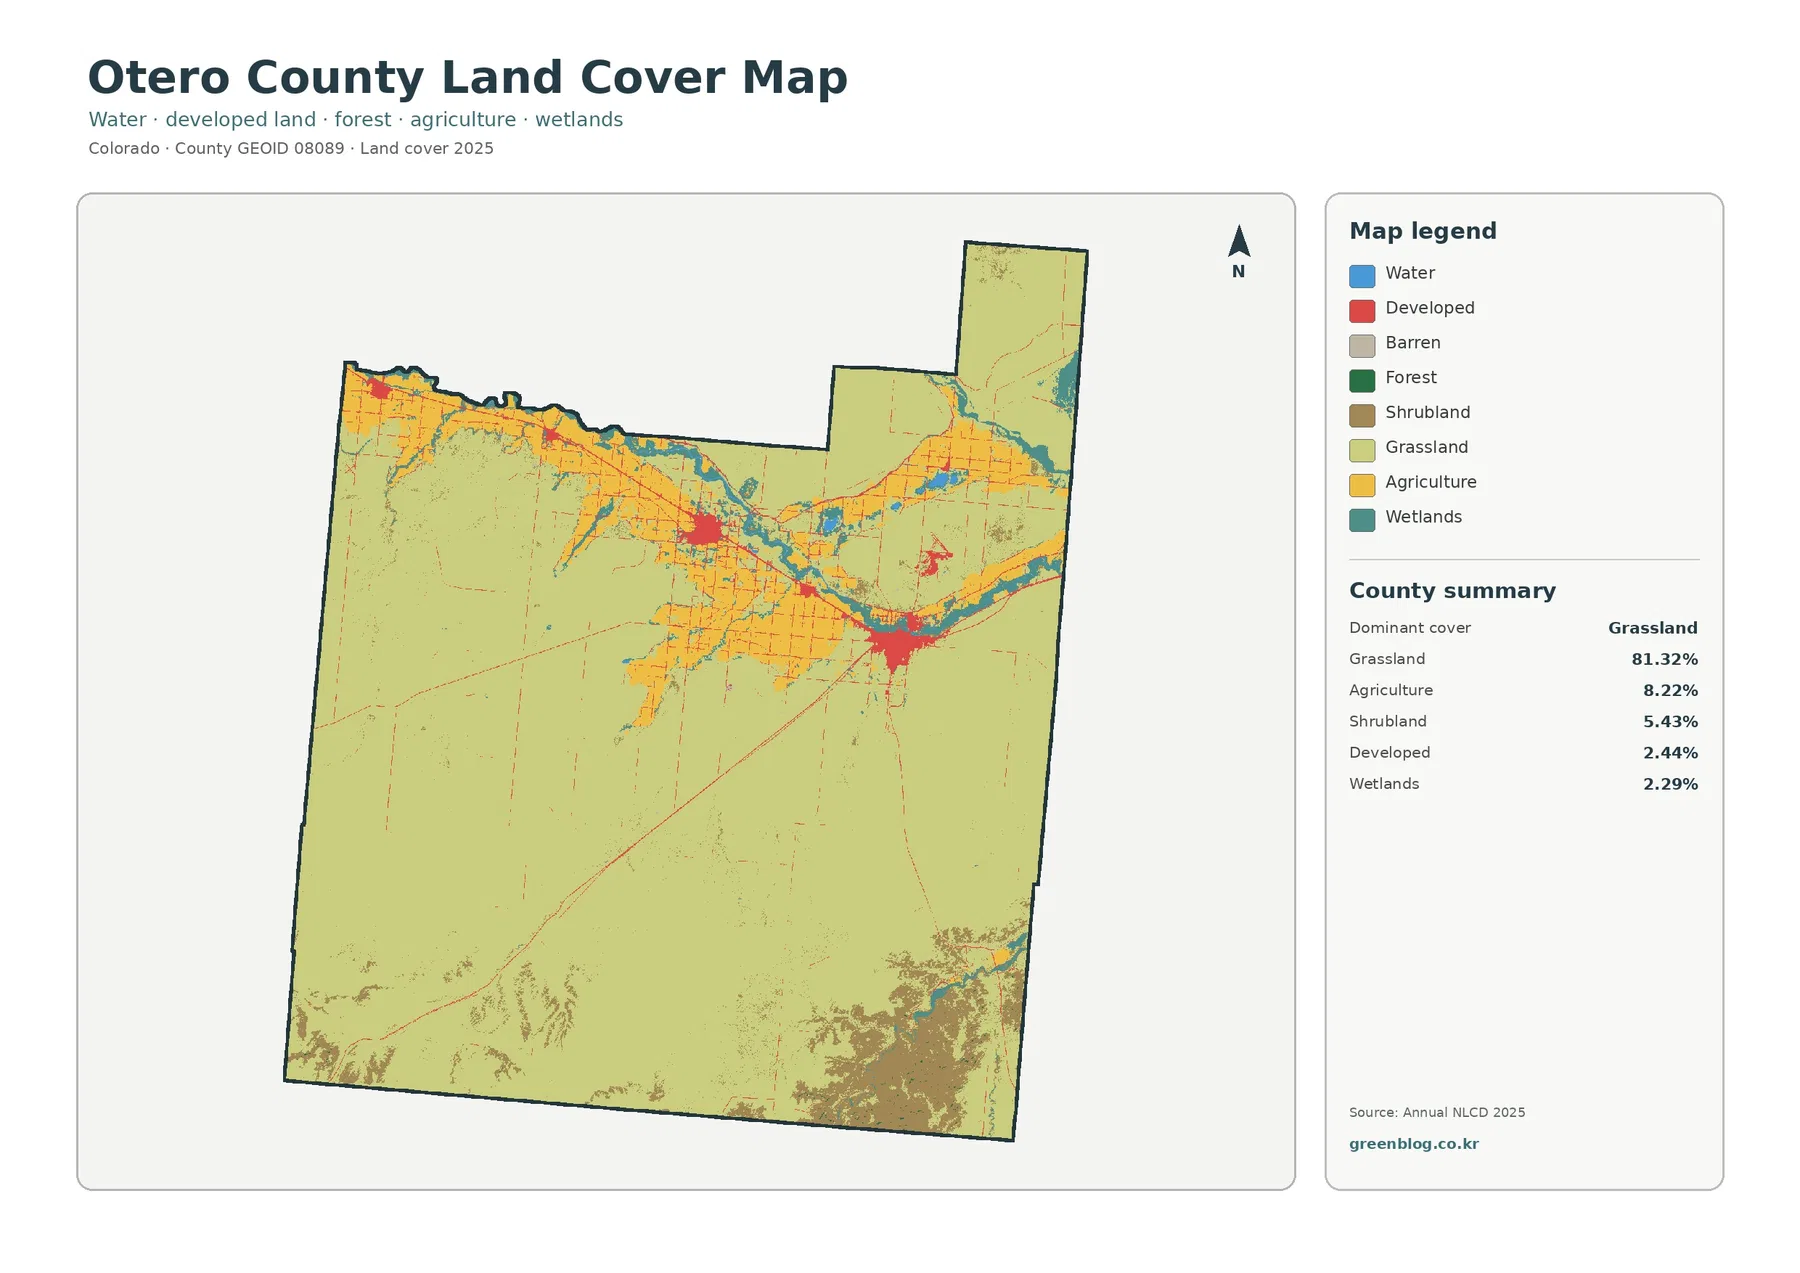
Otero County in southeastern Colorado is a grass-dominant plains county with a much more varied band of land cover along the Arkansas River. The 2025 summary assigns 81.32% of the county to grassland, followed by 8.22% agriculture, 5.43% shrubland, 2.44% developed cover, and 2.29% wetlands. Forest accounts for only 0.05%, so the overall pattern is very different from the forest-heavy counties farther west in Colorado.
This page brings together four matching views: current land cover, forest and farmland, impervious surface and developed land, and mapped class differences from 1985 to 2025. The same four views are available as JPG files in one ZIP archive below. Because every view uses the same county boundary, readers can compare the farm belt, river wetlands, settlement footprints, road-linked hard surfaces, and long-term classification differences without having to realign separate maps.
Table of Contents
A county where grassland is the main background, not a minor class
The general 2025 map is dominated by grassland across the broad central and southern parts of Otero County. Agriculture becomes much more visible in the northern half, where yellow patches form a broken belt near the Arkansas River. Wetlands and water trace narrow, irregular shapes through that same zone, while developed cover appears as compact red clusters rather than a continuous urban area. Shrubland is most noticeable in the southeast and in smaller patches elsewhere.
The 81.32% grassland figure describes mapped surface cover at the observation year. That share is not equivalent to a legal rangeland designation and carries no ownership or zoning meaning. Land cover classifies what is physically visible at the surface. A parcel can be privately owned, publicly managed, farmed seasonally, or subject to a specific zoning rule while still being assigned to a broad grass, shrub, crop, or developed class in a raster map.
Agriculture covers 8.22% of the county and developed land 2.44%. Those shares are small compared with grassland, yet their locations stand out because they are concentrated. Wetlands cover 2.29% and water 0.23%. Their combined area is limited, but the river-linked shapes contrast strongly with the surrounding dry plains. That makes the northern river corridor the best place to compare several land cover types within a relatively short distance.
The Arkansas Valley farm belt is easier to see in the simplified map
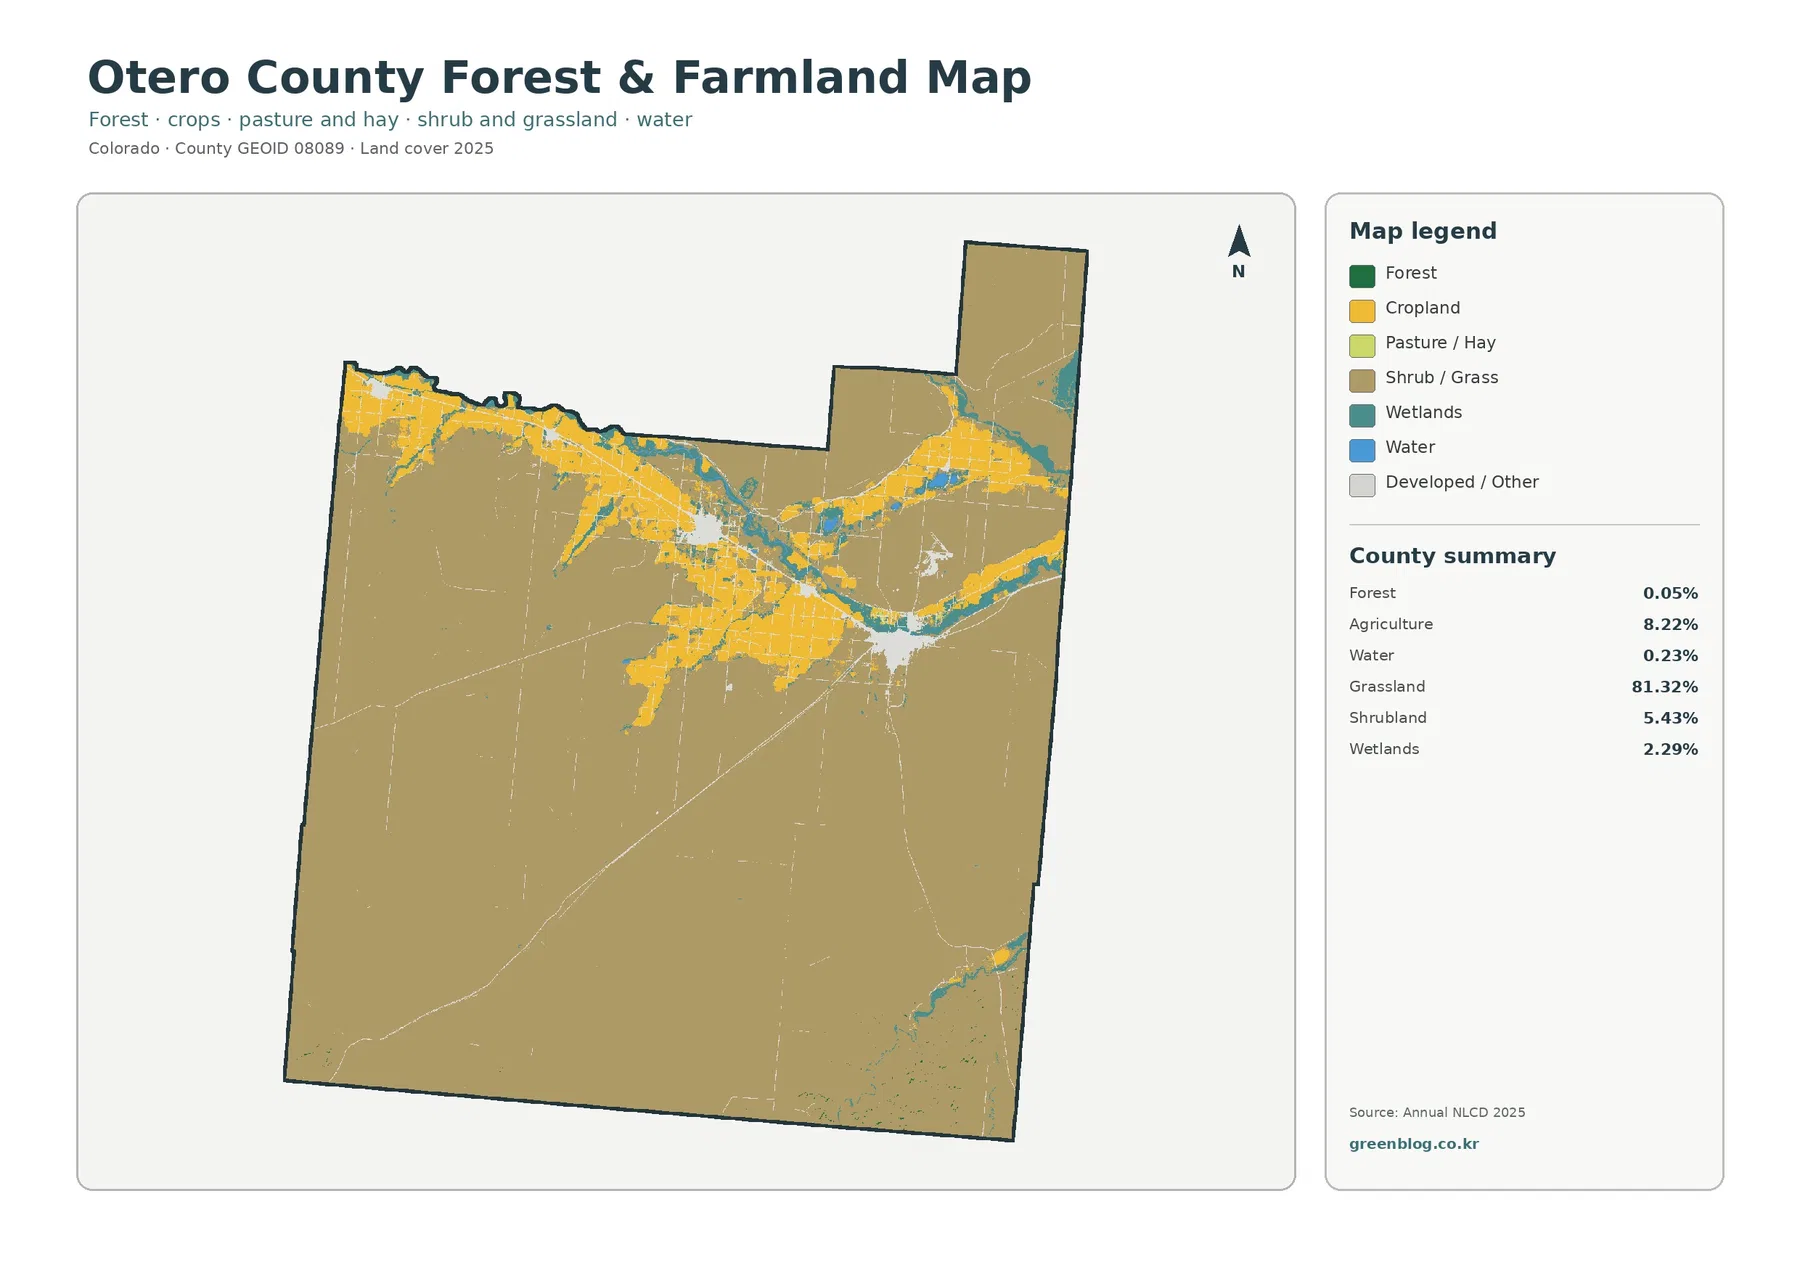
The forest and farmland view removes much of the visual complexity of the full land cover legend. Agriculture appears in a series of blocks across the Arkansas Valley rather than as an even countywide layer. Large areas south of the river corridor remain in grass and shrub classes. That contrast is useful for readers who want to locate the main agricultural zone without having to separate several developed and natural classes at once.
Forest is almost absent from the county summary at 0.05%. For that reason, the most useful comparison on this map is not forest versus farmland. It is farmland versus grass and shrub cover, with wetlands and water providing a second reference. Cropland areas often have straighter edges and block-like shapes, while river and wetland features bend and branch. Their geometry helps readers distinguish managed agricultural patches from water-related cover even before checking the legend.
Otero County’s official website lists La Junta, Rocky Ford, Cheraw, Fowler, Manzanola, and Swink among its communities. Those settlements are part of the Arkansas Valley setting that gives the northern part of the county a different appearance from the broad southern plains. The land-cover maps are not municipal-boundary products and are unsuitable for drawing exact town limits, but the county’s community pattern provides useful context for why farming and developed cover are concentrated in the same general corridor.
Wetlands account for 2.29% and open water for 0.23%. They form a narrow but persistent set of features within the agricultural belt. A land cover map cannot tell a reader whether every blue or teal feature is permanent year-round water, a seasonal wet area, or part of an irrigation system. Detailed water-resource work is better supported by hydrography, wetland inventories, streamflow, and irrigation data. Here, the value of the map is its countywide comparison of water-related cover with farms and grassland.
Hard surfaces are sparse countywide but obvious around the main settlements
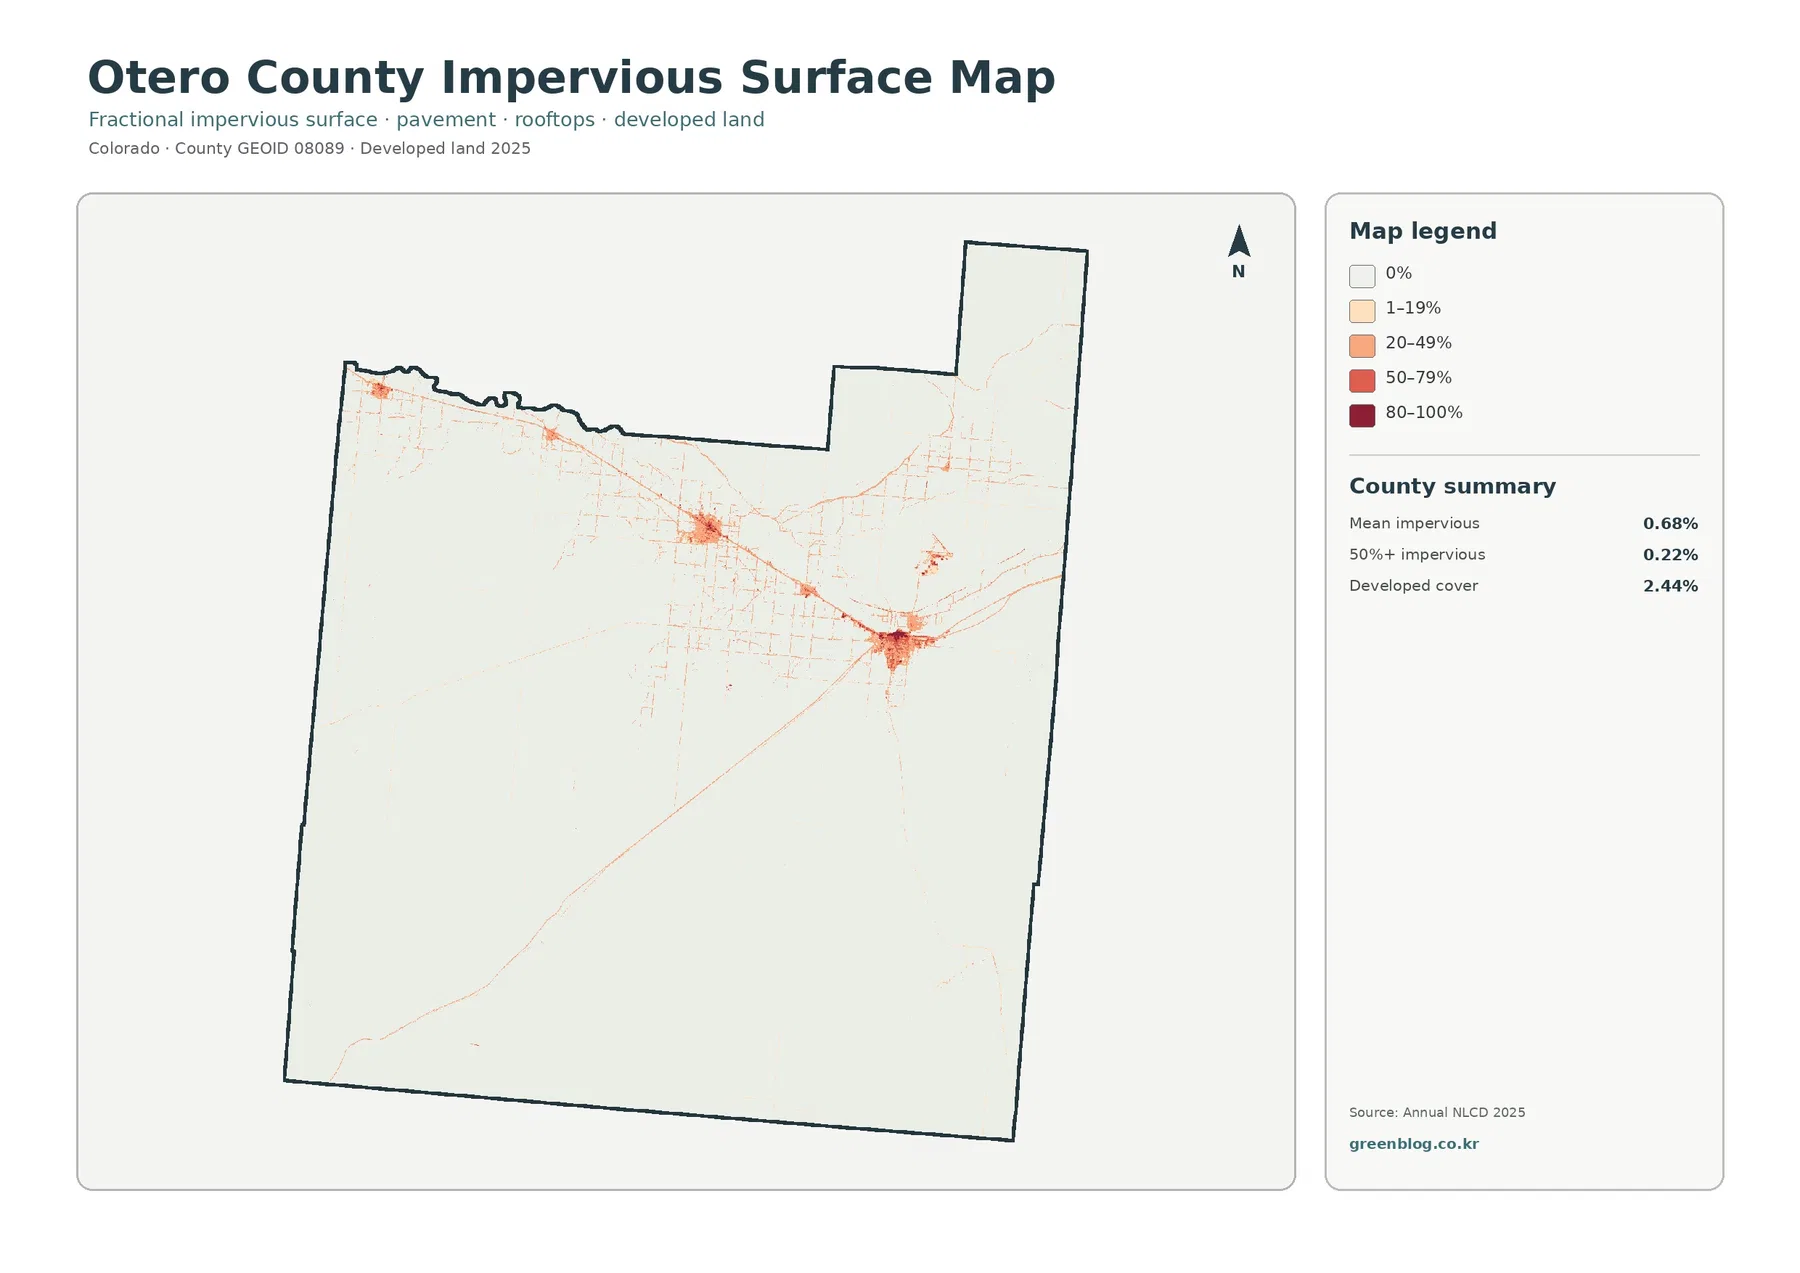
Impervious surface means pavement, rooftops, parking areas, and other surfaces with very low water infiltration. Otero County’s mean impervious value is 0.68%, and only 0.22% of the county is mapped at 50% impervious or higher. Those low countywide values make sense on a map where most of the land remains grassland or agriculture. Even so, the developed places are easy to locate because higher values are packed into small areas.
The strongest hard-surface cluster appears around La Junta in the east-central part of the settlement corridor. Rocky Ford forms another clear cluster to the west, with smaller concentrations and thin road-like lines extending through the valley. The official county page also identifies several smaller communities in this same regional setting. Together, the maps show a county where settlement is spatially compact rather than spread uniformly across the plains.
Developed land covers 2.44% in the general land cover summary. That class and impervious percentage answer related but different questions. A developed land class can include lawns, open spaces, and other permeable ground within a built setting, while the impervious map focuses more directly on hard surfaces. Comparing the two prevents a common mistake: assuming that every developed pixel is completely paved or that the impervious map represents legal city boundaries.
For watershed education, the impervious view works well beside the wetlands and water patterns in the general map. It can show where hard surfaces are concentrated relative to the river corridor, but it cannot by itself measure flood risk, runoff volume, or water quality. Those questions require elevation, drainage, soil, rainfall, and hydrologic information. The map is best used as one landscape layer rather than as a complete environmental assessment.
Reading the 4.75% class difference from 1985 to 2025
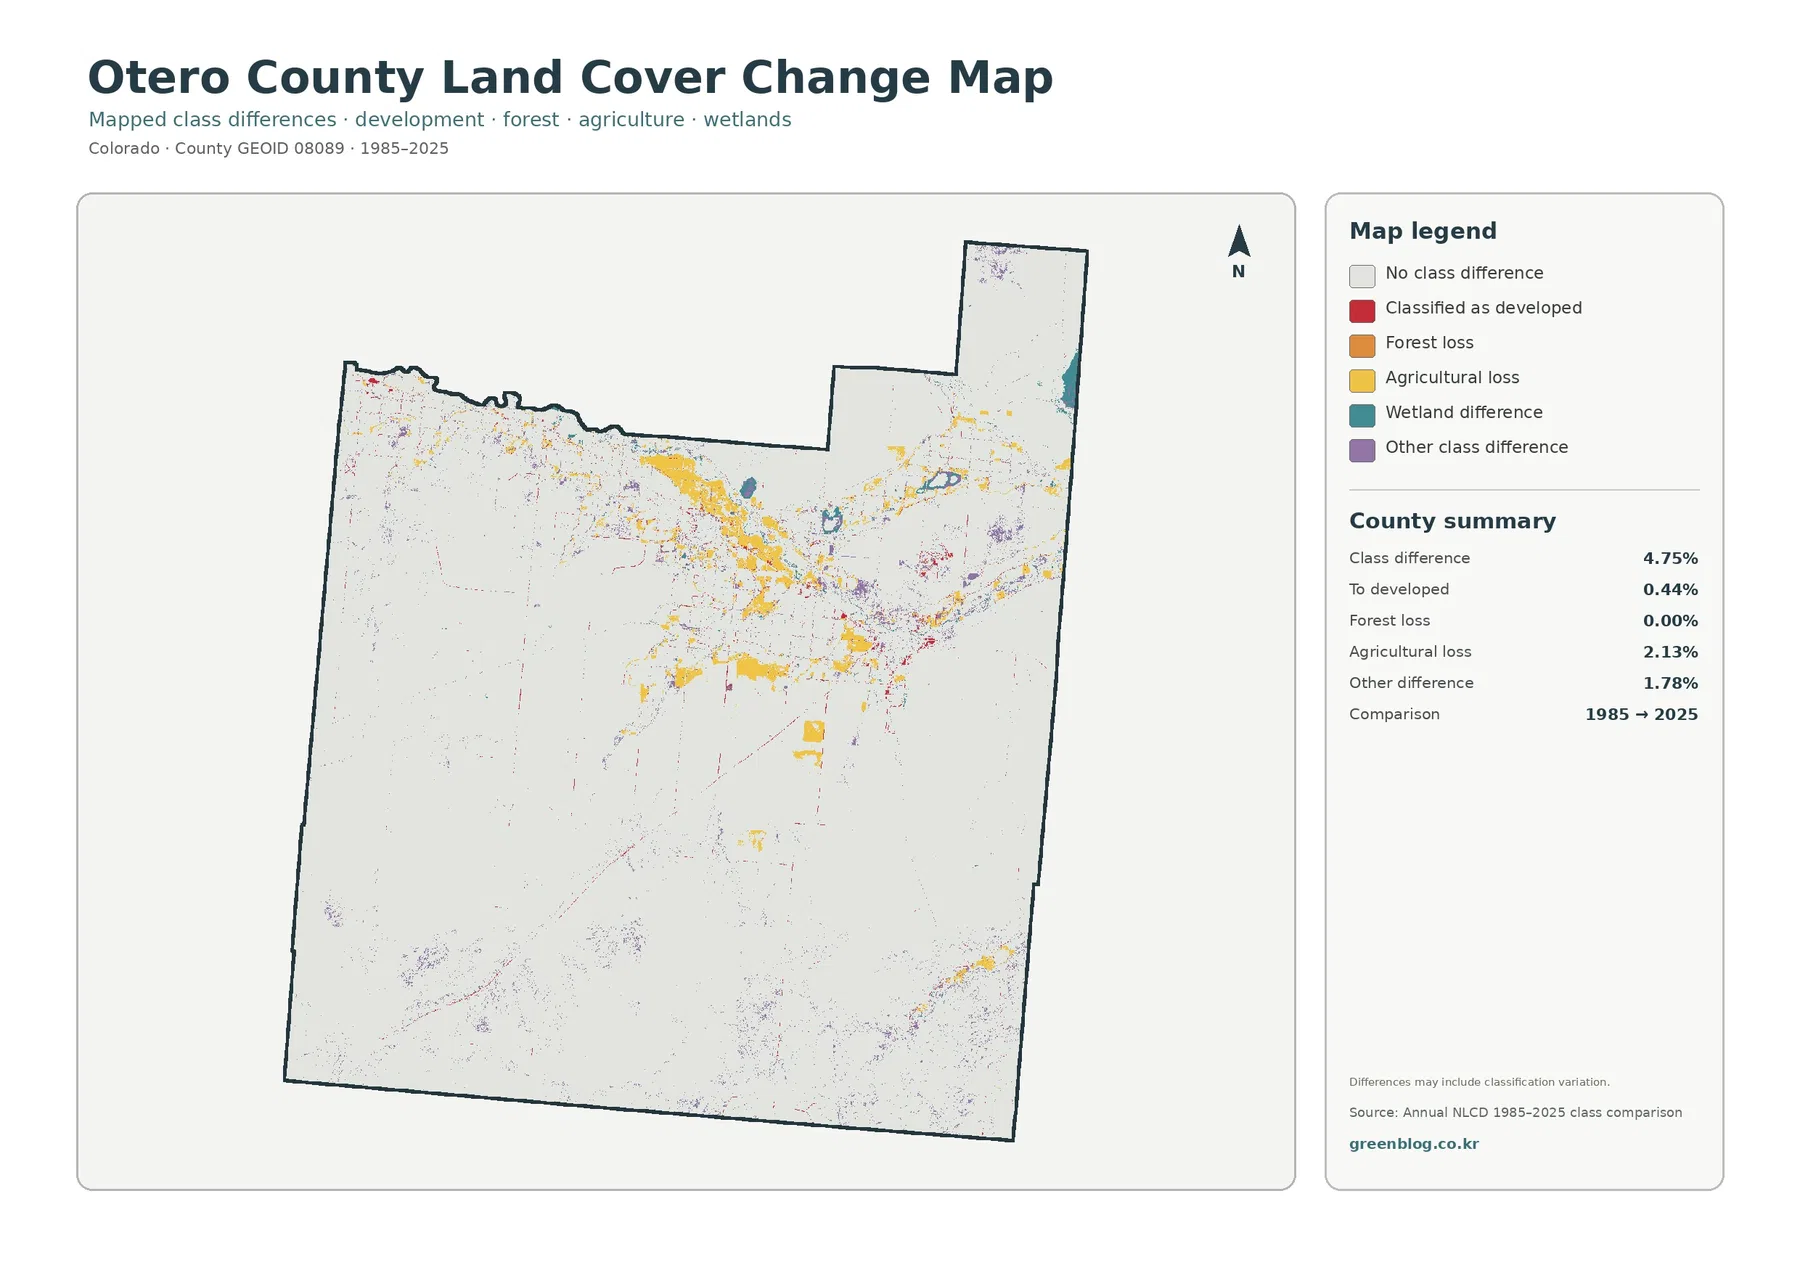
The change map compares classifications from 1985 and 2025 and marks 4.75% of the county as a different class between those two reference years. The map summary breaks out 0.44% classified to developed, 2.13% agricultural loss, 1.78% other class difference, and 0.00% forest loss. Agricultural-loss colors are the most prominent of those listed categories, especially in and around the valley where farming is concentrated.
That 4.75% value is not a damage rate, a development rate, or a statement that all of the highlighted land changed permanently. It is a comparison of mapped classes. Real land cover conversion can be part of the result, but crop cycles, fallow fields, moisture conditions, image date, mixed pixels, and differences in classification can also change the assigned category. Agricultural areas are particularly sensitive to seasonal and year-to-year surface conditions.
A useful reading sequence begins with a large highlighted patch and then compares the same location on the 2025 land-cover map. If an area marked as agricultural loss is currently grassland, developed cover, or another class, the pair of maps gives a useful starting observation. The pair still cannot explain why the class changed. Aerial imagery, intermediate Annual NLCD years, agricultural statistics, or local development records would be needed to investigate the history.
The same approach applies to the areas classified to developed. Comparison with the impervious map shows whether those locations now contain concentrated hard surfaces. Agreement between the two views strengthens the evidence for a present-day built footprint; divergence may reflect the broader definition of developed land or classification uncertainty. Using multiple map views is more reliable than treating a single change color as a complete conclusion.
Choosing the right Otero County map for a specific task
Start with the 2025 general map when the goal is to understand the county as a whole. It establishes the overwhelming grassland background and shows where farms, wetlands, water, shrubland, and developed areas interrupt that background. The forest and farmland map is better when the main question is the location of the agricultural belt. The impervious map strips away most natural classes and makes town and road surfaces easier to find.
The change map works best as the final view, after the current pattern is familiar. That sequence helps prevent a highlighted difference from being mistaken for a proven cause or trend. It also makes classroom and presentation comparisons clearer because readers first see the present landscape, then a simplified agriculture view, then the built surface pattern, and finally the two-date comparison.
- Use the 2025 land cover map for the overall mix of grassland, agriculture, wetlands, water, shrubland, and development.
- Use the forest and farmland map to isolate the Arkansas Valley agricultural belt from the surrounding grass and shrub cover.
- Use the impervious surface map to locate concentrated pavement and rooftops around La Junta, Rocky Ford, and connecting routes.
- Use the change map to find places assigned to different classes in 1985 and 2025 before checking other evidence.
All four maps are generalized raster products rather than parcel surveys. Small fields, narrow canals, roads, and wet strips can be affected by mixed pixels, where more than one surface type falls within a cell. The 2025 maps end at the observation year. Property decisions, engineering, legal boundaries, and detailed habitat work require more precise datasets alongside these countywide views.
Otero County land-cover JPG map set
The ZIP below contains four JPG maps described on this page: 2025 land cover, forest and farmland, impervious surface and developed land, and the 1985–2025 class comparison. Each image is 2480×1754 pixels. At that resolution, the files are better suited to documents, classroom material, web publishing, and ordinary presentations than to very large-format printing or detailed GIS analysis.
Frequently Asked Questions
What is the dominant land cover in Otero County?
Grassland is the dominant 2025 class at 81.32%. Agriculture accounts for 8.22%, shrubland 5.43%, developed cover 2.44%, wetlands 2.29%, and forest only 0.05%.
Which map is best for developed areas around La Junta and Rocky Ford?
Use the impervious surface map to locate concentrated pavement, rooftops, and other hard surfaces. Compare it with the general land cover map to see how built areas sit beside grassland, farmland, wetlands, and water.
Does the 4.75% difference from 1985 to 2025 mean that 4.75% of the county was damaged?
No. It is the share of mapped cells assigned to different land cover classes in the two comparison years. Real change may be included, but image timing, crop condition, moisture, mixed pixels, and classification differences can also affect the result.
Sources and reference material
Percentages and mapped differences on this page come from the Otero County Annual NLCD-based map set. Land cover describes physical surface classes, not ownership, zoning, legal land use, or development rights. The official county page is included for local government and community context, while the federal links document the land cover and boundary datasets used for map interpretation.
- MRLC Annual NLCD Data
- USGS Annual NLCD Land Cover Classification
- USGS Annual NLCD Collection 1.2 release notice – confirms that the annual product series was extended through 2025.
- U.S. Census Bureau TIGER/Line Shapefiles
- Otero County official site – county government and communities
Otero County land-cover map set
The ZIP contains four JPG maps: 2025 land cover, forest and farmland, impervious surface and developed land, and the 1985–2025 class comparison.
Each image is 2480×1754 pixels and is suitable for documents, classroom materials, web publishing, and ordinary presentations.
Otero County map files (ZIP)Related Maps
- Adams County Colorado Land Cover Map
- Alamosa County Colorado Land Cover Map
- Arapahoe County Colorado Land Cover Map
Green Map creates custom-edited map images using open geographic data sources such as geoBoundaries, Natural Earth, OpenStreetMap, and government open data.
These maps are edited visual materials, not raw data files, and are provided for education, documents, presentations, and graphic reference.