This Sabine County Map set gives a practical view of Hemphill, Pineland, Milam, the roads that cross the county, the broad water edge on the east, named bayous and creeks, and the changing terrain between the western uplands and lower eastern shore. The maps can be viewed directly in the article, and high-resolution A3 JPG versions of the county, city, water, and elevation maps are available together in the download box below.
Sabine County has a shape that immediately reflects its relationship with water. Much of the western boundary is comparatively simple, while the eastern edge bends repeatedly around a large body of water. Hemphill provides the easiest central reference point, Pineland marks the southwest, and Milam appears farther north and east. Once those places are located, the road network and stream pattern become much easier to follow.
Table of Contents
Hemphill ties the main road network together
On the county reference map, Hemphill sits a little south of the geographic center and is the clearest anchor for orientation. Route 87 runs through the Hemphill area on a generally north-to-south course. Route 21 crosses the northern half of the county and meets the same general corridor, while Milam is labeled farther northeast. Pineland is separated from Hemphill to the southwest and lies much closer to the western county edge.
Several other route shields help break the county into recognizable sections. Numbers 103 and 1 appear near the western side, 184 crosses the middle-western area, and 96 and 149 are shown around the southwest near Pineland. Rather than treating the road numbers as a long list, it is more useful to compare them with the named places. Hemphill functions as the main interior reference, Pineland helps identify the southwest, and Milam marks the northeastern part of the road system.
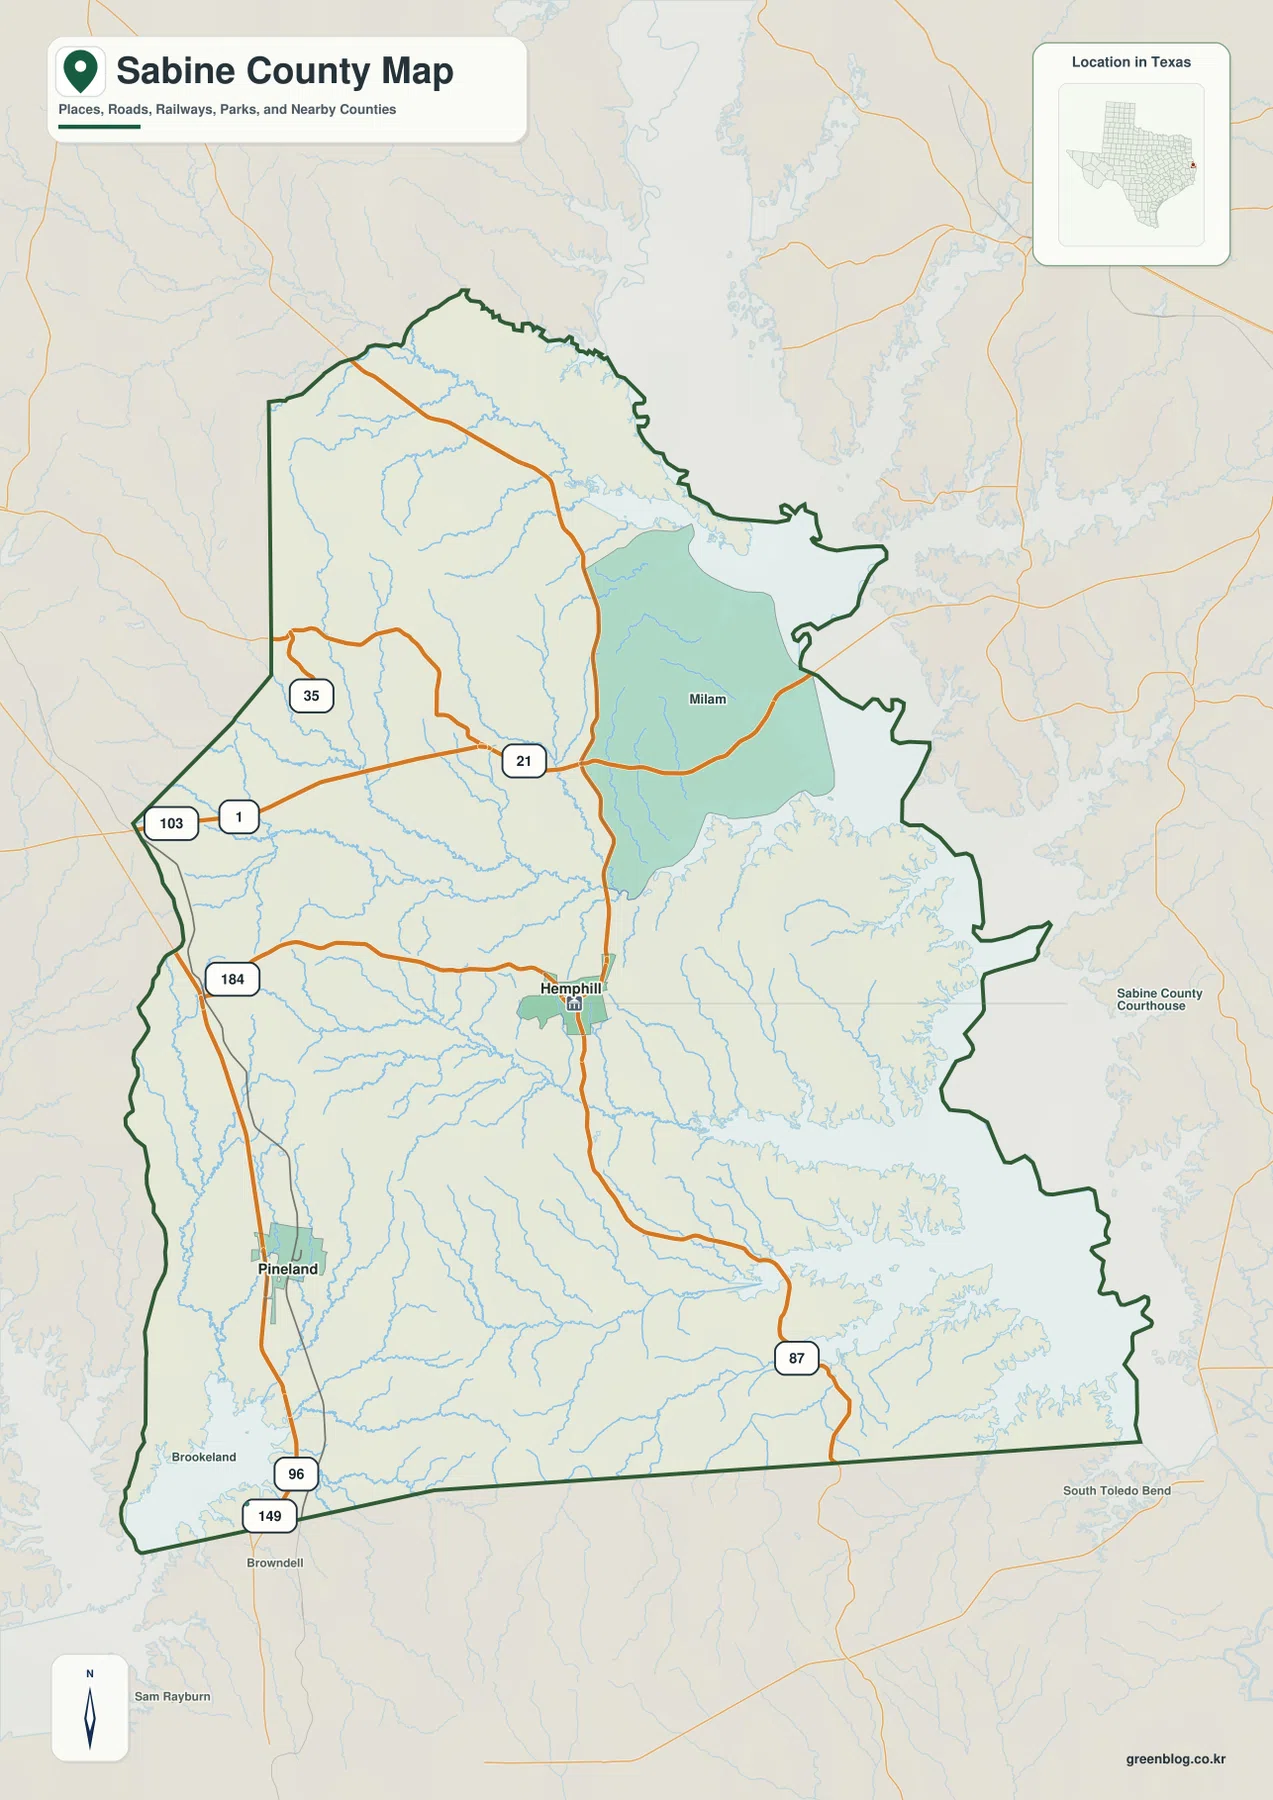
The eastern boundary is one of the most distinctive parts of the map. Instead of following a straight surveyed line, it makes a series of deep bends around the adjoining water. The southeastern outside area includes a South Toledo Bend label, and the map also places a Sabine County Courthouse label beyond the eastern edge. Those surrounding labels make it easier to separate locations inside the county from nearby reference points outside the boundary.
The city map reduces the county to two clear settlement markers
The city version emphasizes Hemphill and Pineland and removes much of the visual competition from secondary labels. Hemphill is near the center of the county, while Pineland is well to the southwest. The map also labels Shelby County to the north and Newton, San Augustine, and Jasper counties along the west, giving useful context for the direction of neighboring areas without crowding the two main city markers.
The CITY INDEX printed at the bottom lists Hemphill at 1,488 and Pineland at 817. These are the values used in the supplied graphic to rank the two mapped cities, so they are useful for understanding why Hemphill is shown first. They should not be treated as a substitute for a current demographic database. If a project requires the newest population count, an official statistical source should be checked separately.
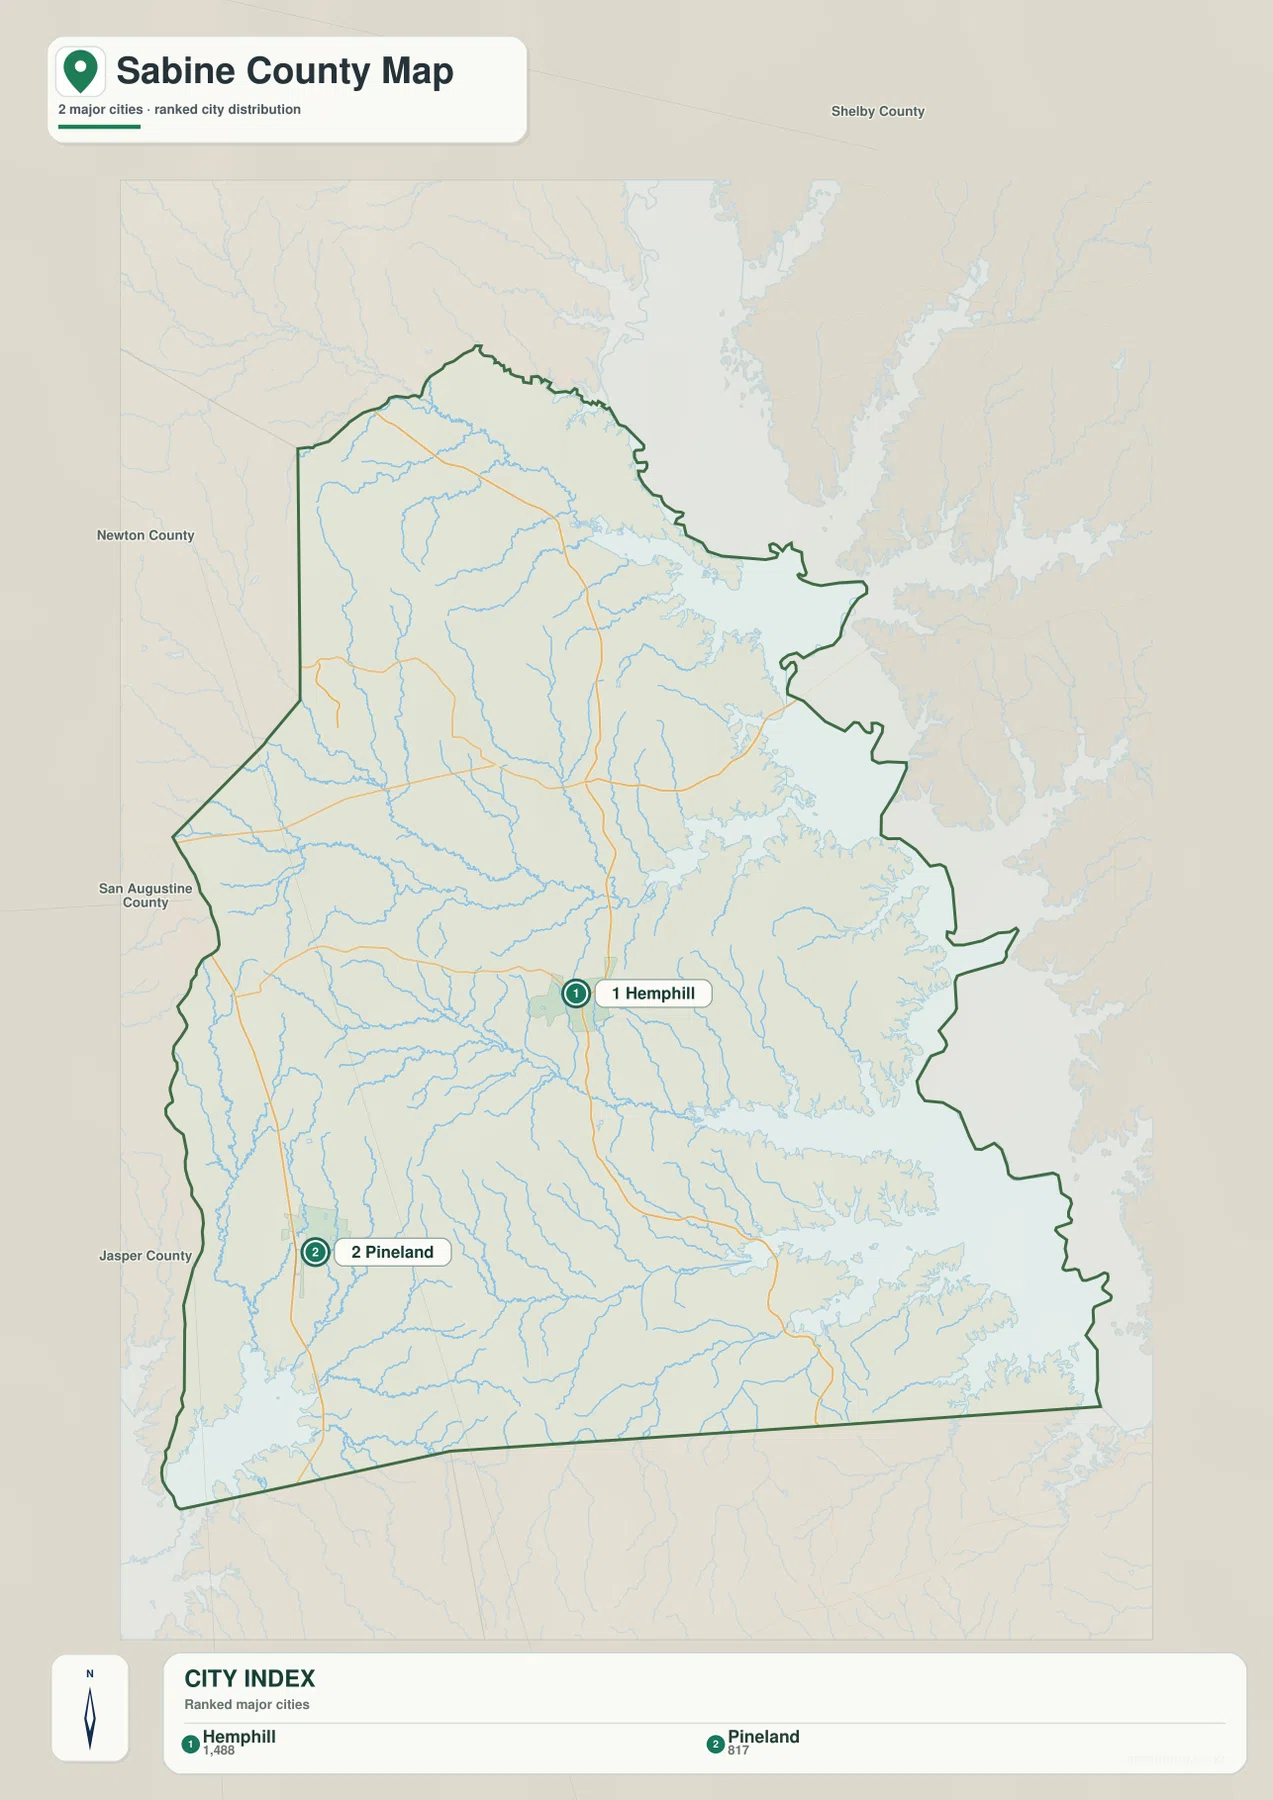
This simplified view is useful when the purpose of a map is location rather than navigation. Hemphill gives the central point, and Pineland identifies the southwest without requiring the reader to interpret every highway, lake arm, or stream. For classroom material, a county introduction, or a simple city-location graphic, that reduced detail can make the map easier to read than the full reference version.
Bayous and creeks lead toward the broad eastern water edge
The terrain-and-water map reveals a much more intricate county. Along the east, a large water body occupies the full height of the boundary and sends many narrow arms westward. In the north, Patroon Bayou is labeled near the upper boundary, and Red Hills Lake appears farther south. Barbeque Creek runs through the north-central interior, while Palo Gaucho Bayou and Toro Creek form strong west-to-east lines across the upper-middle part of the county.
Housen Bayou is one of the most prominent named waterways through the center. Farther south and west, Sandy Creek and Bear Creek appear among a dense network of tributaries. Sixmile Creek crosses the southern half on a long eastward course, and Big Sandy Creek is labeled closer to the southeast. Buck Bay and Sam Rayburn Reservoir are shown beyond the southwest boundary, giving the map additional context for nearby regional water features.
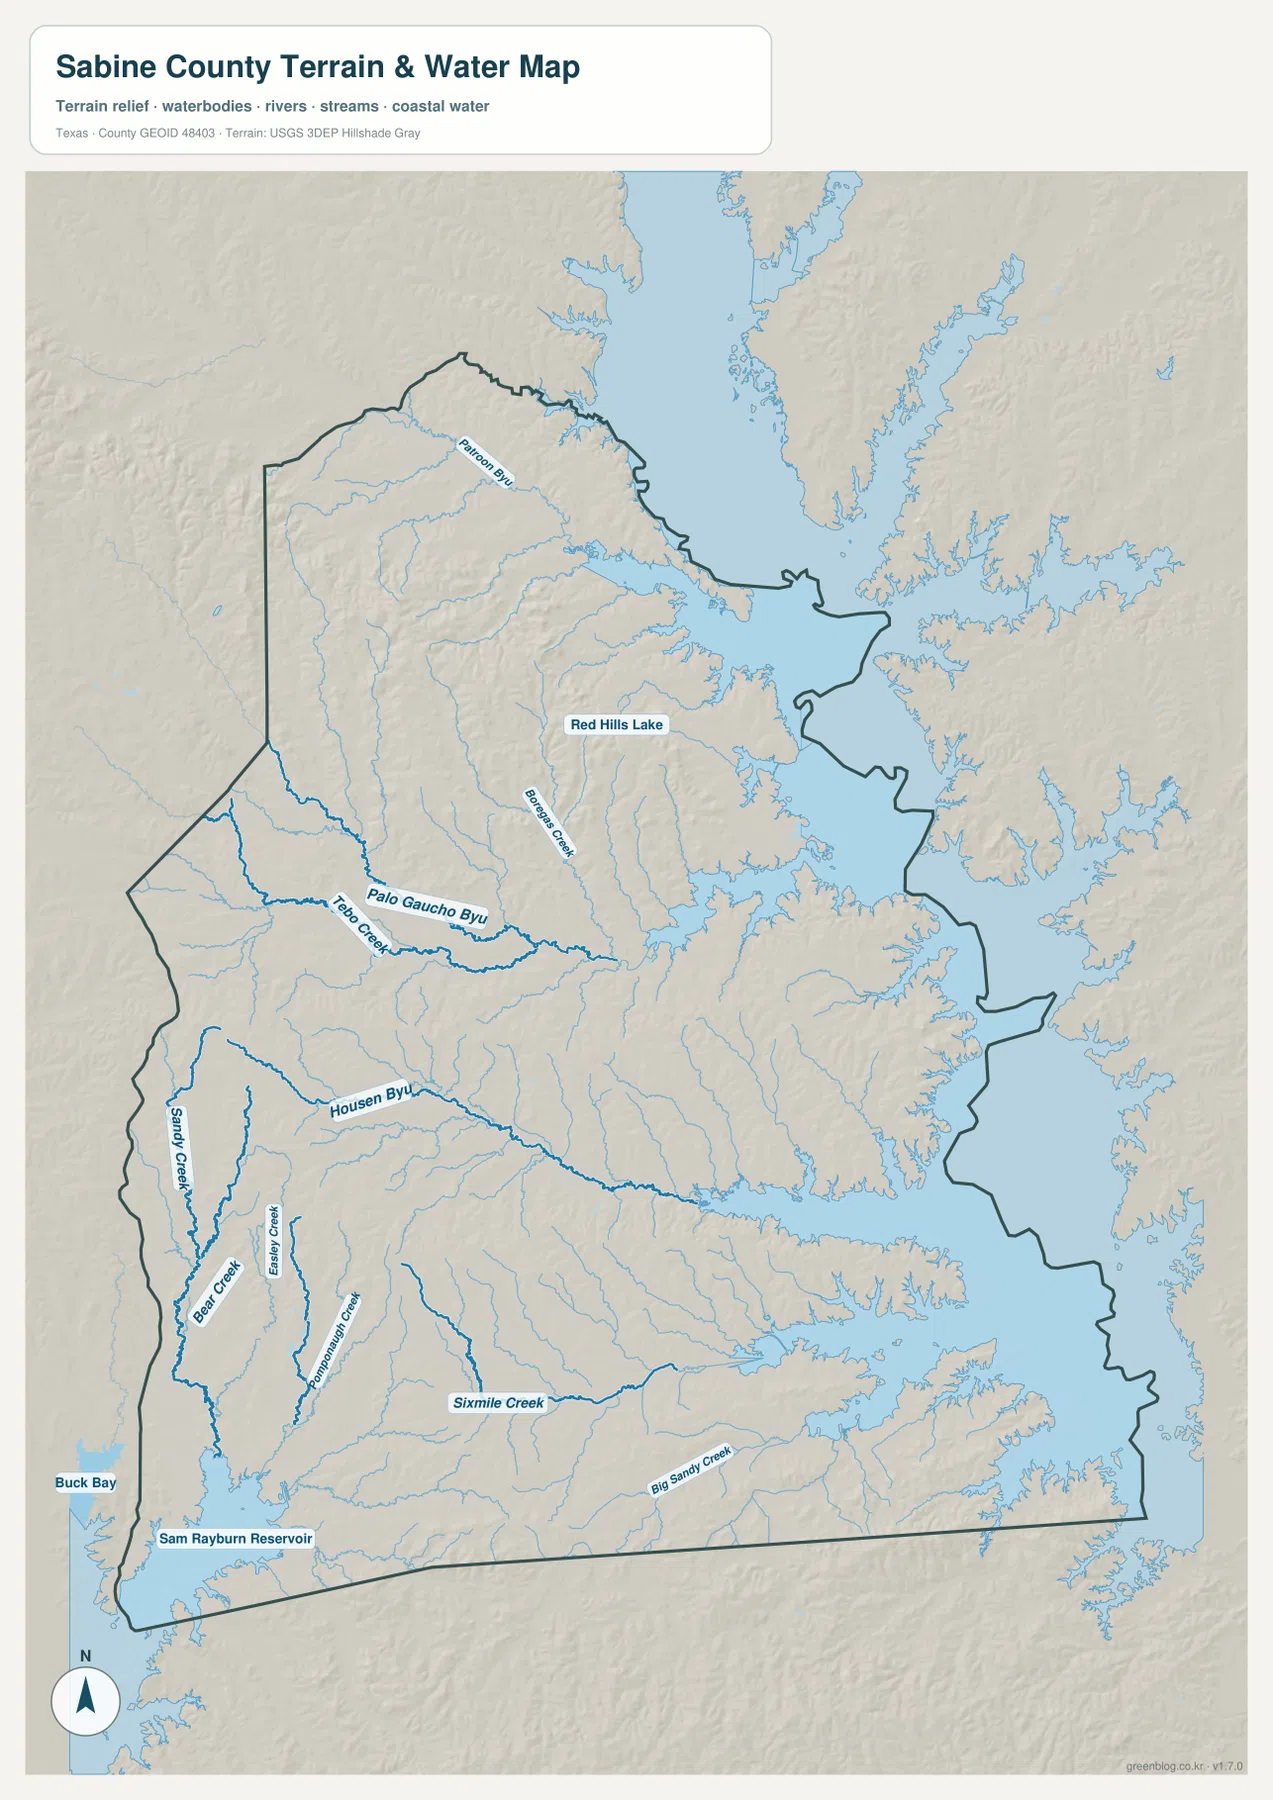
The map makes the county’s irregular eastern outline easier to understand. Many small valleys open directly toward the large body of water, producing repeated coves and narrow shoreline fingers. The western side looks much simpler at the boundary, but the interior is still crossed by numerous streams. This contrast between a relatively plain western edge and a highly indented eastern side is one of the most recognizable geographic features in the supplied map set.
Higher western ridges step down toward lower ground in the east
The elevation map reports an actual range of about 48 to 179 meters and a mean of 76 meters. Brown and tan areas represent higher terrain, while darker greens mark lower ground. The strongest concentration of high ridges appears in the northwest and western interior. From there, narrow green valleys cut through the uplands and extend toward the center and east.
The eastern part of the county is much lower overall, especially next to the large water body, where broad dark-green areas dominate. The middle and south are not flat; low valleys branch between small ridges in many directions. When the elevation and water maps are viewed together, the relationship is easy to see. Housen Bayou, Sixmile Creek, Big Sandy Creek, and other streams occupy the lower corridors, while the intervening ridges rise above them.
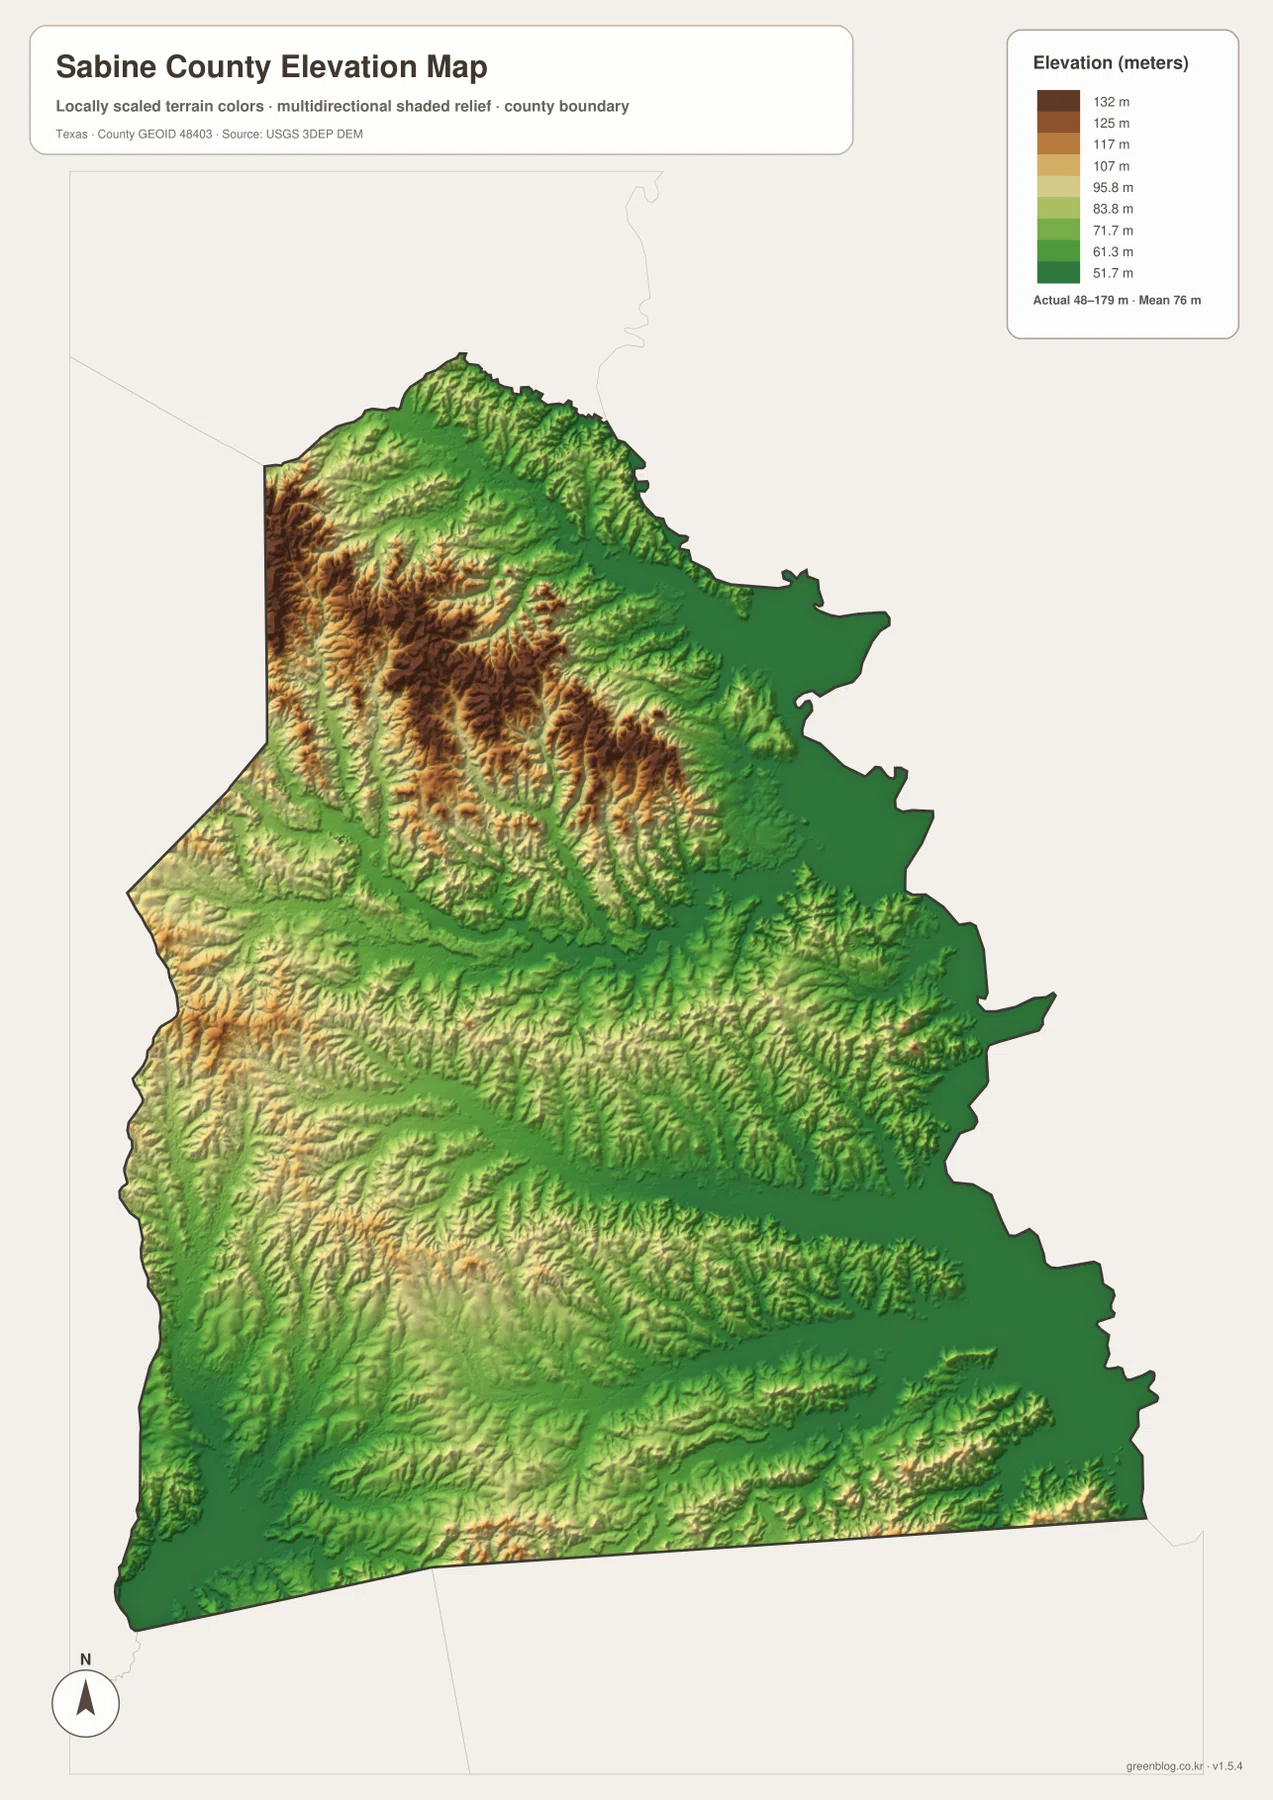
The numerical difference between the mapped low and high points is about 131 meters, but the colored relief is more informative than the raw range alone. It shows that the change in height is repeated across many short ridges and valleys rather than occurring as one isolated hill. That is why the water network appears so dense: numerous small low corridors collect runoff and lead toward larger bayous and the eastern water edge.
Choosing the map that matches the question
For roads, county boundaries, Hemphill, Pineland, and general orientation, the county reference map is the fastest option. The city map is better when only the two ranked places need to stand out. Choose the water map for Patroon Bayou, Palo Gaucho Bayou, Housen Bayou, Sixmile Creek, Big Sandy Creek, and the complicated eastern shoreline. The elevation map is the clearest choice for comparing the higher western ridges with the lower terrain beside the eastern water.
The WebP images in the article are intended for convenient on-screen viewing. For printing or editing, the ZIP below contains four high-resolution A3 JPG files from this package: the county reference map, city map, terrain-and-water map, and elevation map. Keeping them as separate JPGs makes it easy to print only the map needed for a lesson, local reference sheet, presentation, or personal project.
Frequently Asked Questions
Where is Hemphill on the Sabine County map?
Hemphill is a little south of the county’s center and is crossed by Route 87. Pineland is southwest of Hemphill near the western edge, while Milam is shown farther northeast.
Which waterways are labeled on the Sabine County water map?
Named features include Patroon Bayou, Palo Gaucho Bayou, Housen Bayou, Sixmile Creek, Big Sandy Creek, Red Hills Lake, and several smaller creeks. The large body of water along the eastern boundary is also a dominant part of the map.
What elevation range is shown for Sabine County?
The supplied elevation map states an actual range of about 48 to 179 meters and a mean elevation of 76 meters. Higher ridges are concentrated in the northwest and west, while the eastern side next to the water is generally lower.
Map File Information
The ZIP contains the four Sabine County maps in high-resolution A3 JPG format.
- Included Versions: County, city, terrain and water, elevation
- Included Files: 4 A3 JPG maps
Related Maps
Sources and data references
County boundaries and road reference data can be checked through the U.S. Census Bureau TIGER/Line Shapefiles. Rivers, creeks, and water features can be cross-checked with USGS National Hydrography, while elevation data are available from the USGS 3D Elevation Program. The place labels, road numbers, named waterways, and elevation figures described above are based on the four Sabine County maps supplied in the current ZIP package.
Green Map creates custom-edited map images using open geographic data sources such as geoBoundaries, Natural Earth, OpenStreetMap, and government open data.
These maps are edited visual materials, not raw data files, and are provided for education, documents, presentations, and graphic reference.