This San Augustine County Map set makes it possible to compare the county seat of San Augustine, Broaddus in the southwest, the main road network, named creeks and lakes, and the change in elevation from the northern hills to the low reservoir country in the south. The maps are available for on-screen reference in this article, and the download box later on the page provides all four maps as high-resolution A3 JPG files in one ZIP.
The county has a strong north-to-south contrast. San Augustine sits in the upper half where several roads meet, while Broaddus is much farther southwest. Streams run through nearly every part of the county, but they become especially important toward the south, where branching valleys open into Sam Rayburn Reservoir. The elevation map adds another layer to the same picture: higher ridges dominate much of the north, and lower green terrain becomes broader near the reservoir.
Table of Contents
San Augustine is the clearest road reference in the northern half
On the general county map, San Augustine is the easiest place to use as an anchor. Route 21 approaches from the west, passes through the city area, and continues toward the eastern county line. Route 85 runs north from the same general area, and Route 147 heads south toward Broaddus. Farther down the county, Route 103 crosses from west to east, while Route 96 follows a north-to-south line on the eastern side. Together these roads divide a long county into sections that are easy to recognize.
Broaddus is well southwest of San Augustine and is connected visually to the northern half by the 147 corridor. Chireno appears outside the western boundary, and Pineland is labeled outside the eastern side, giving useful surrounding reference points. The road pattern becomes less visually dominant toward the south because the stream network and reservoir shoreline take over much more of the map. That change is one reason the general map works best as an overview before moving to the water map.
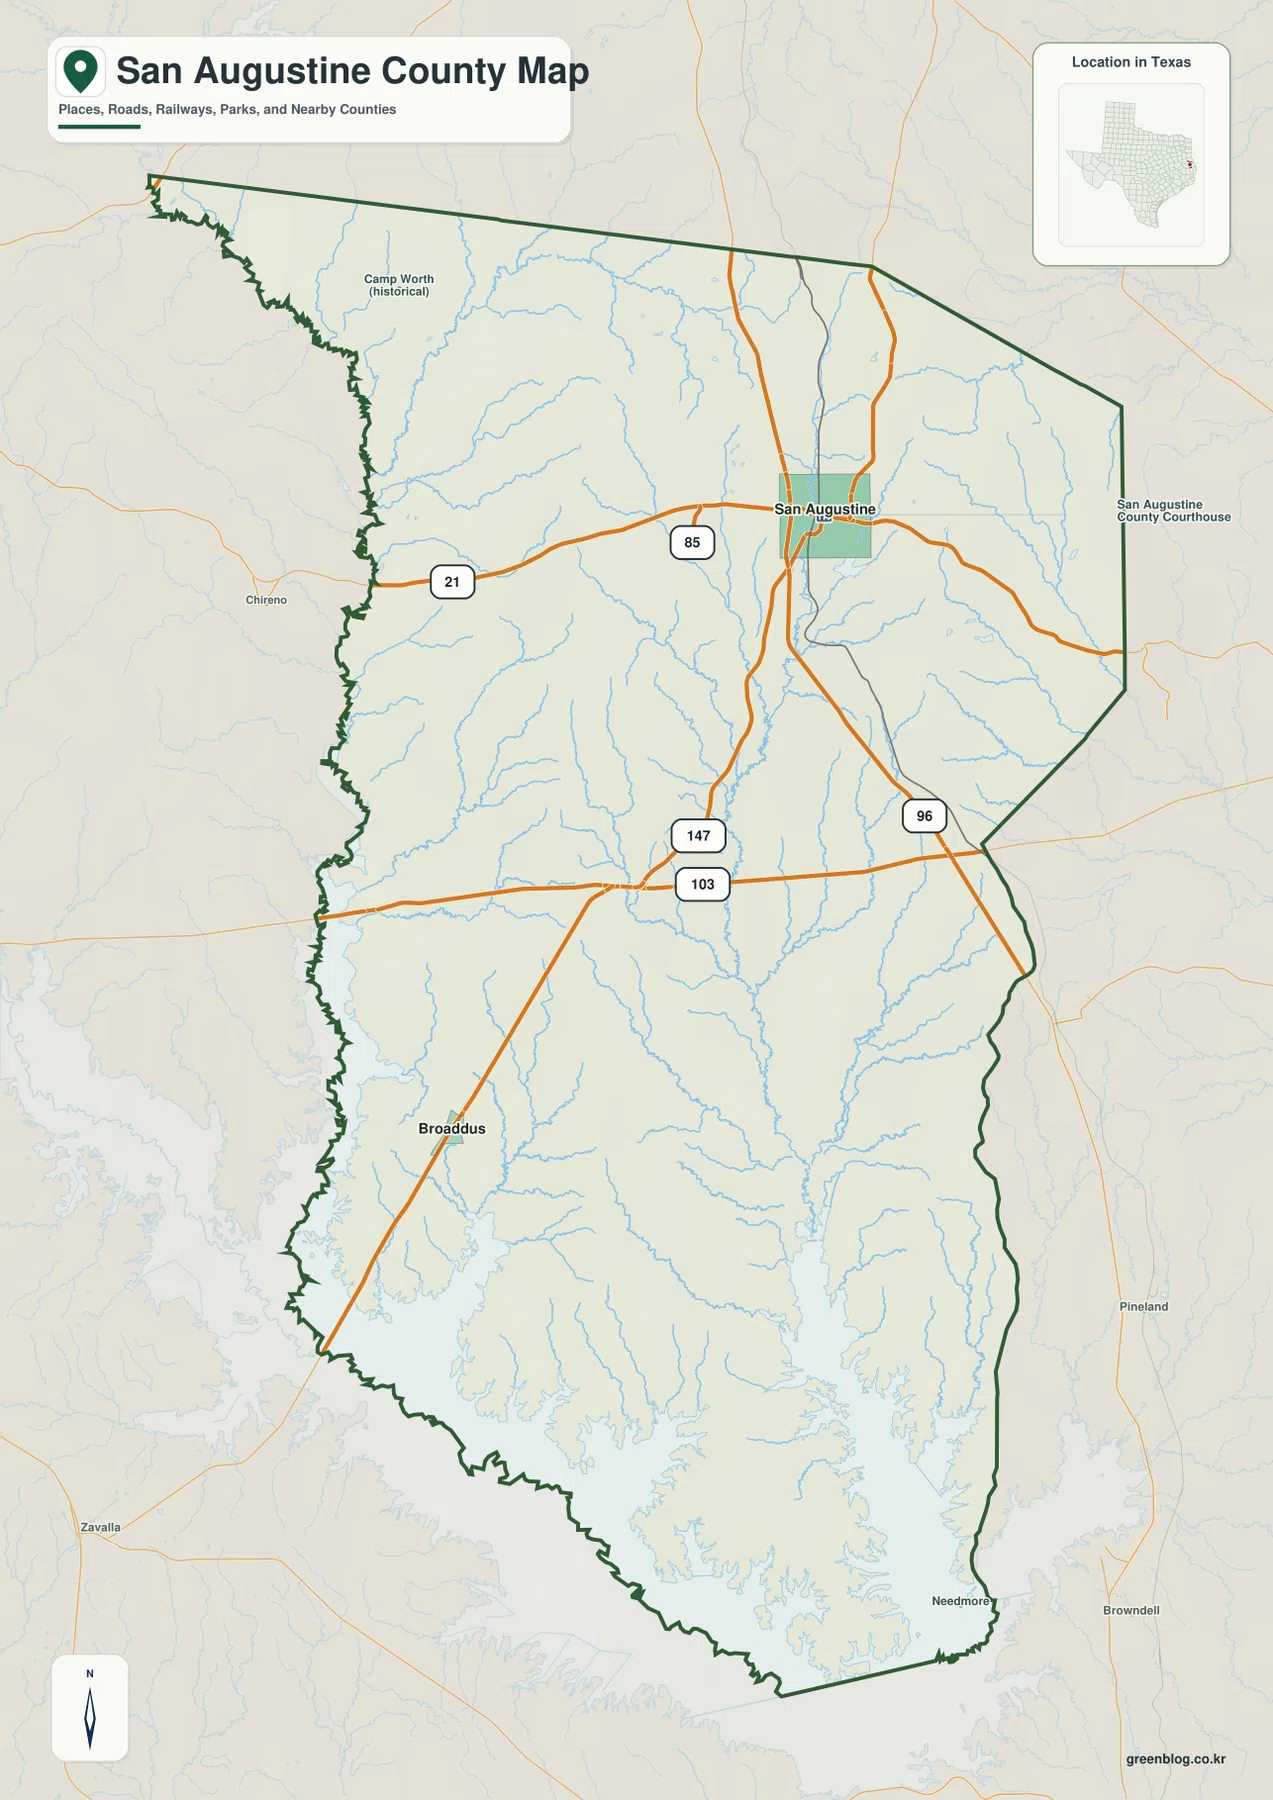
The outline itself also changes character from north to south. The upper part is relatively broad, the eastern side steps inward around the middle, and the western boundary contains a long series of irregular bends. Near the southern end, the edge becomes much more complicated as it meets the reservoir landscape. Looking at the county outline together with the two cities makes the shape easier to remember than treating the boundary as an isolated line.
Two ranked cities mark very different parts of the county
The city map strips away many secondary labels and highlights San Augustine and Broaddus. San Augustine is positioned in the north-central part of the county, while Broaddus is separated from it in the southwest. The neighboring-county labels provide additional orientation: Shelby County is north, Sabine County is east, Nacogdoches and Angelina counties are to the west, and Jasper County appears to the southwest. The result is a simple view that makes the two mapped city positions easy to understand without following every road.
The CITY INDEX printed on the map lists San Augustine at 2,054 and Broaddus at 390. Those are the values used by the supplied graphic to rank the two cities, explaining why San Augustine is marked number one and Broaddus number two. They are useful for reading this specific map, but anyone who needs a current population total should consult an official demographic source rather than assuming the printed index is a live count.
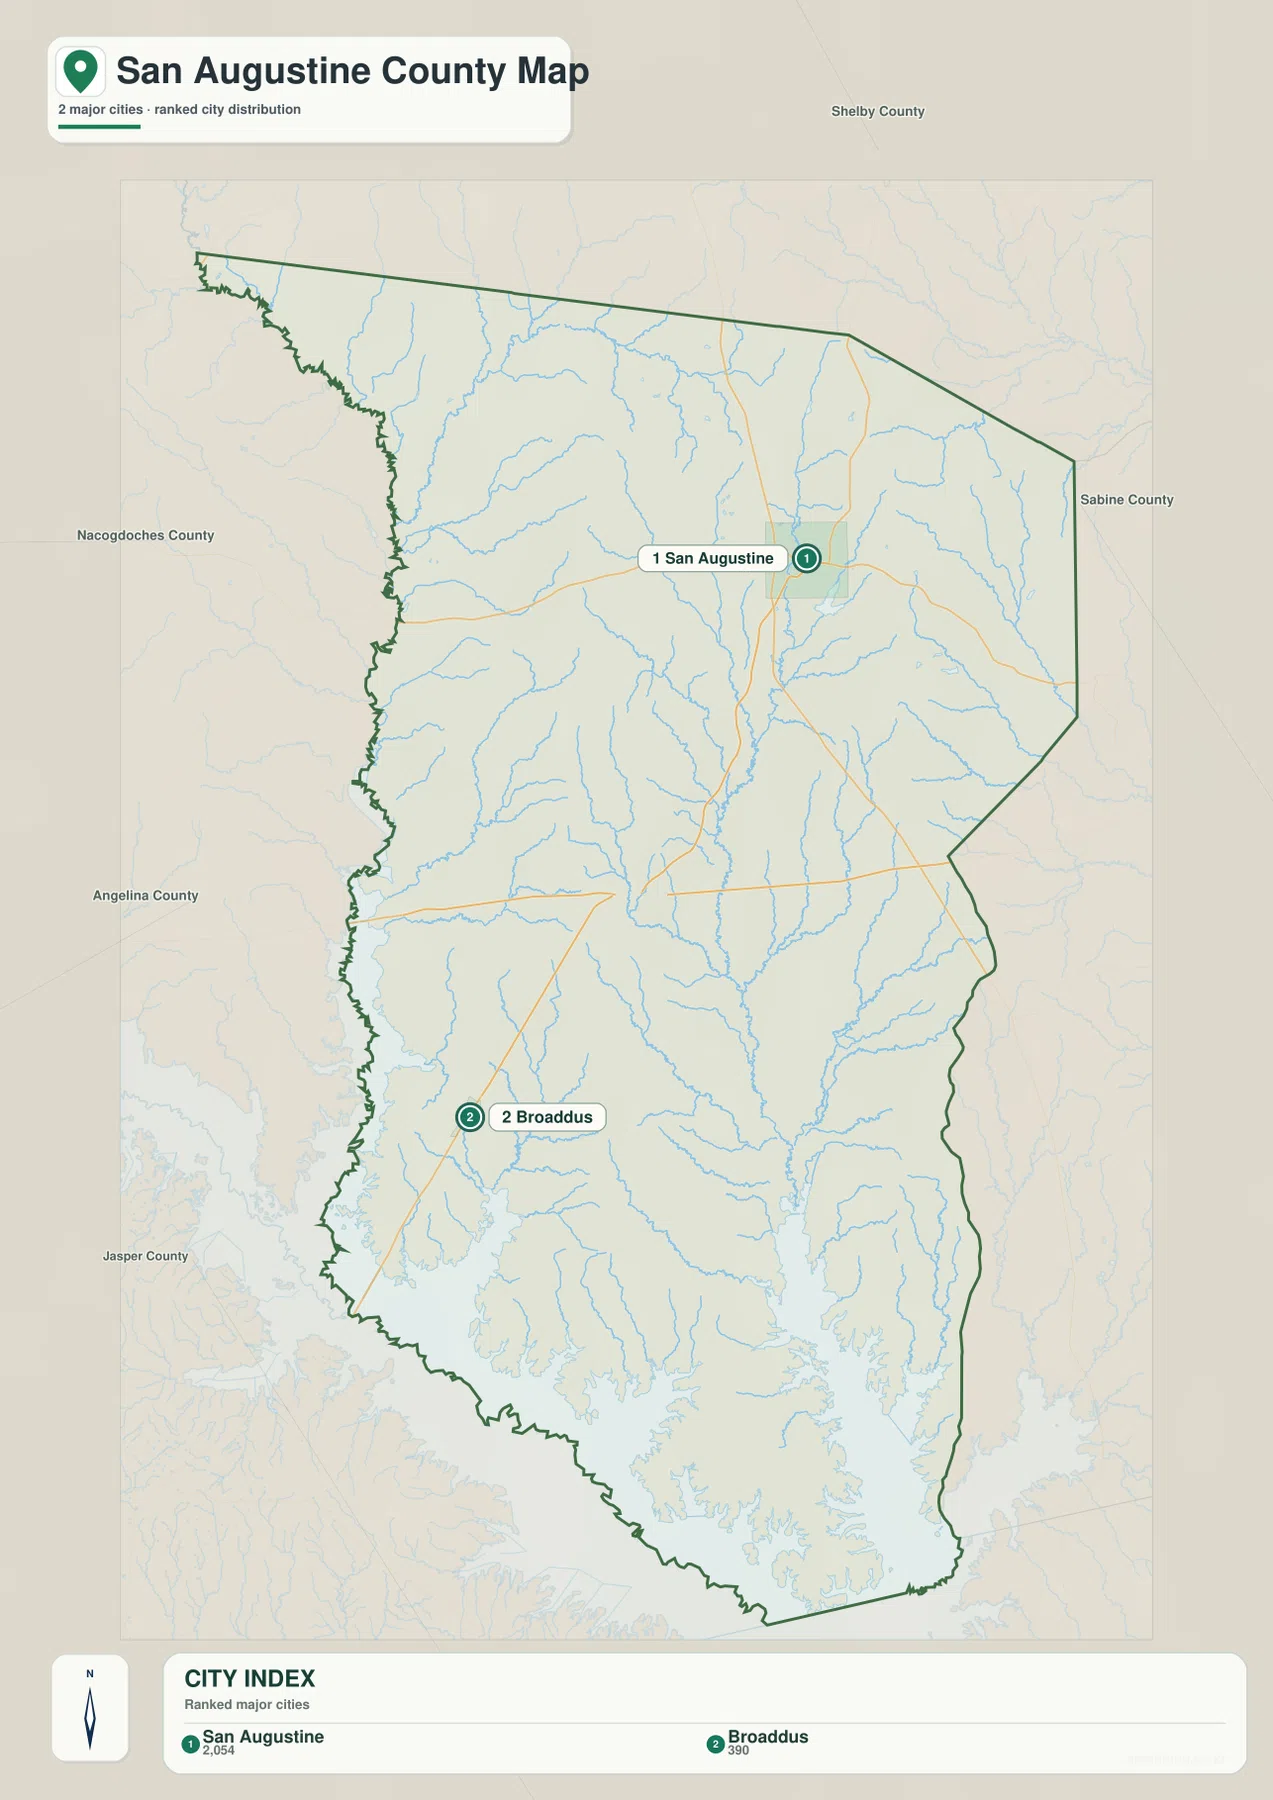
This simplified map is particularly useful when a project needs only the major settlement locations. San Augustine gives a clear reference for the upper half of the county, while Broaddus identifies the southwest. A school handout, county introduction, or presentation can use these two markers without the extra visual detail of the full road and drainage network.
Ayish Bayou gathers tributaries on the way to Sam Rayburn Reservoir
The terrain-and-water map brings the drainage system into focus. Ayish Bayou forms one of the strongest named water lines through the center and continues southward as smaller streams join it. Arenosa Creek is prominent in the northwest, and Caney Creek crosses the west-central interior toward the main drainage. Turkey Creek and Sandy Creek appear farther south, where the stream network becomes denser on the approach to the reservoir.
Several smaller lakes are labeled in the northern and eastern half. Bland Lake lies in the north, City Lake is closer to the central area south of San Augustine, and Lilly Lake is farther east. In the lower part of the county, Sam Rayburn Reservoir becomes the dominant water feature. Buck Bay is labeled near the southeast and Coleman Bay appears along the southwestern reservoir edge, helping show how deeply the reservoir shoreline cuts into the surrounding land.
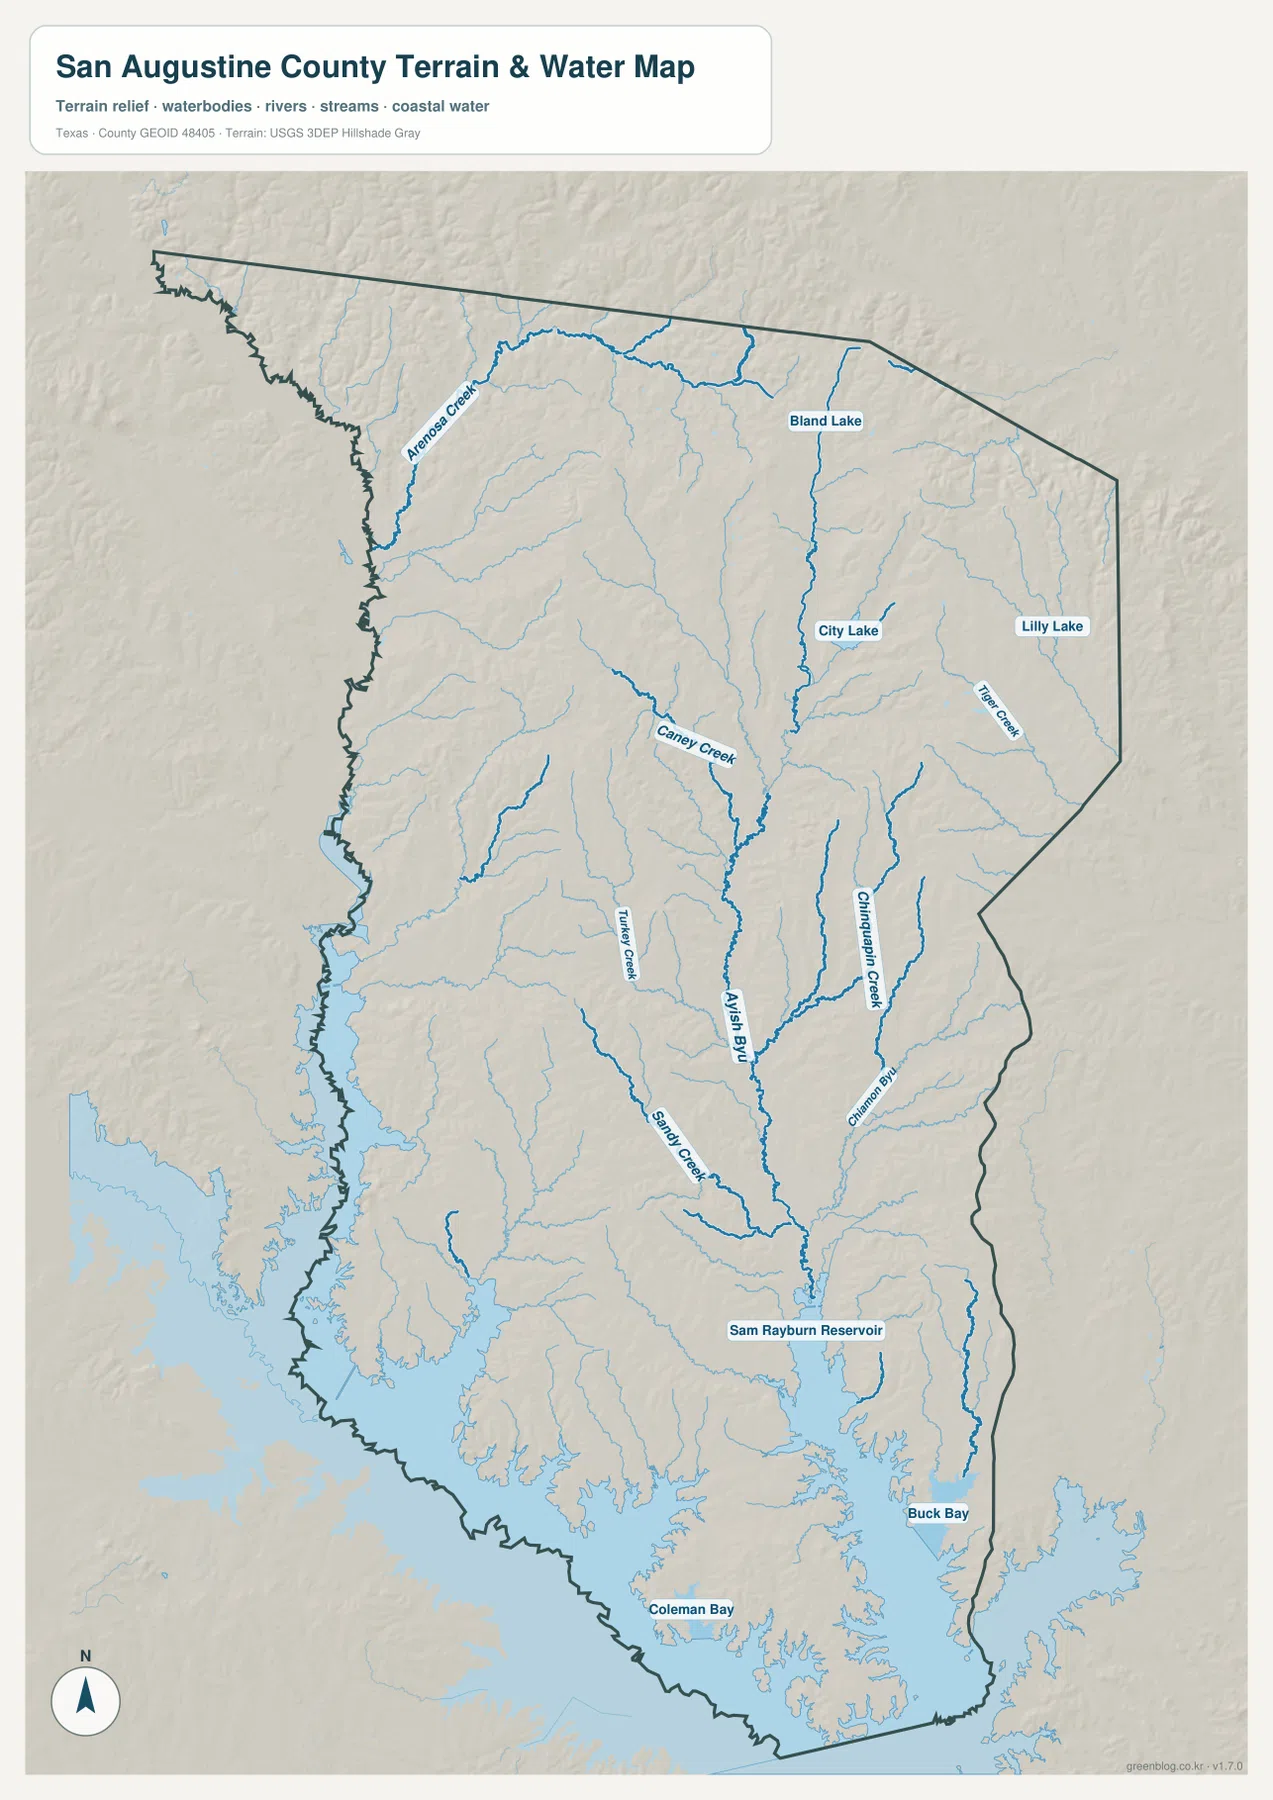
The most useful part of this map is the connection between small streams and the large reservoir. The northern half is filled with narrow branches that occupy separate valleys. Farther south, those branches combine into larger channels and finally meet the broad reservoir shoreline. That progression makes the county’s drainage easier to understand than a list of creek names would. It also explains why the southern boundary looks so much more indented than the northern boundary on the general map.
Northern ridges stand above the lower reservoir country
The elevation map states an actual elevation range of about 48 to 179 meters, with a mean of 83 meters. Browns and darker tans indicate the higher terrain, while greens represent lower areas. Many of the strongest high areas are in the north and northeast, with additional elevated ridges in the north-central interior. The south is generally lower, and the broadest low terrain appears around Sam Rayburn Reservoir.
The change is not a smooth slope from one end of the county to the other. Long green valleys cut between the higher ridges, creating a branching relief pattern. A major low corridor extends through the central part of the county, closely matching the direction of the Ayish Bayou drainage shown on the water map. Similar low valleys separate ridges in the northwest and northeast. This makes the elevation map useful even without detailed contour lines because the relationship between streams, valleys, and higher ground is visible at a glance.
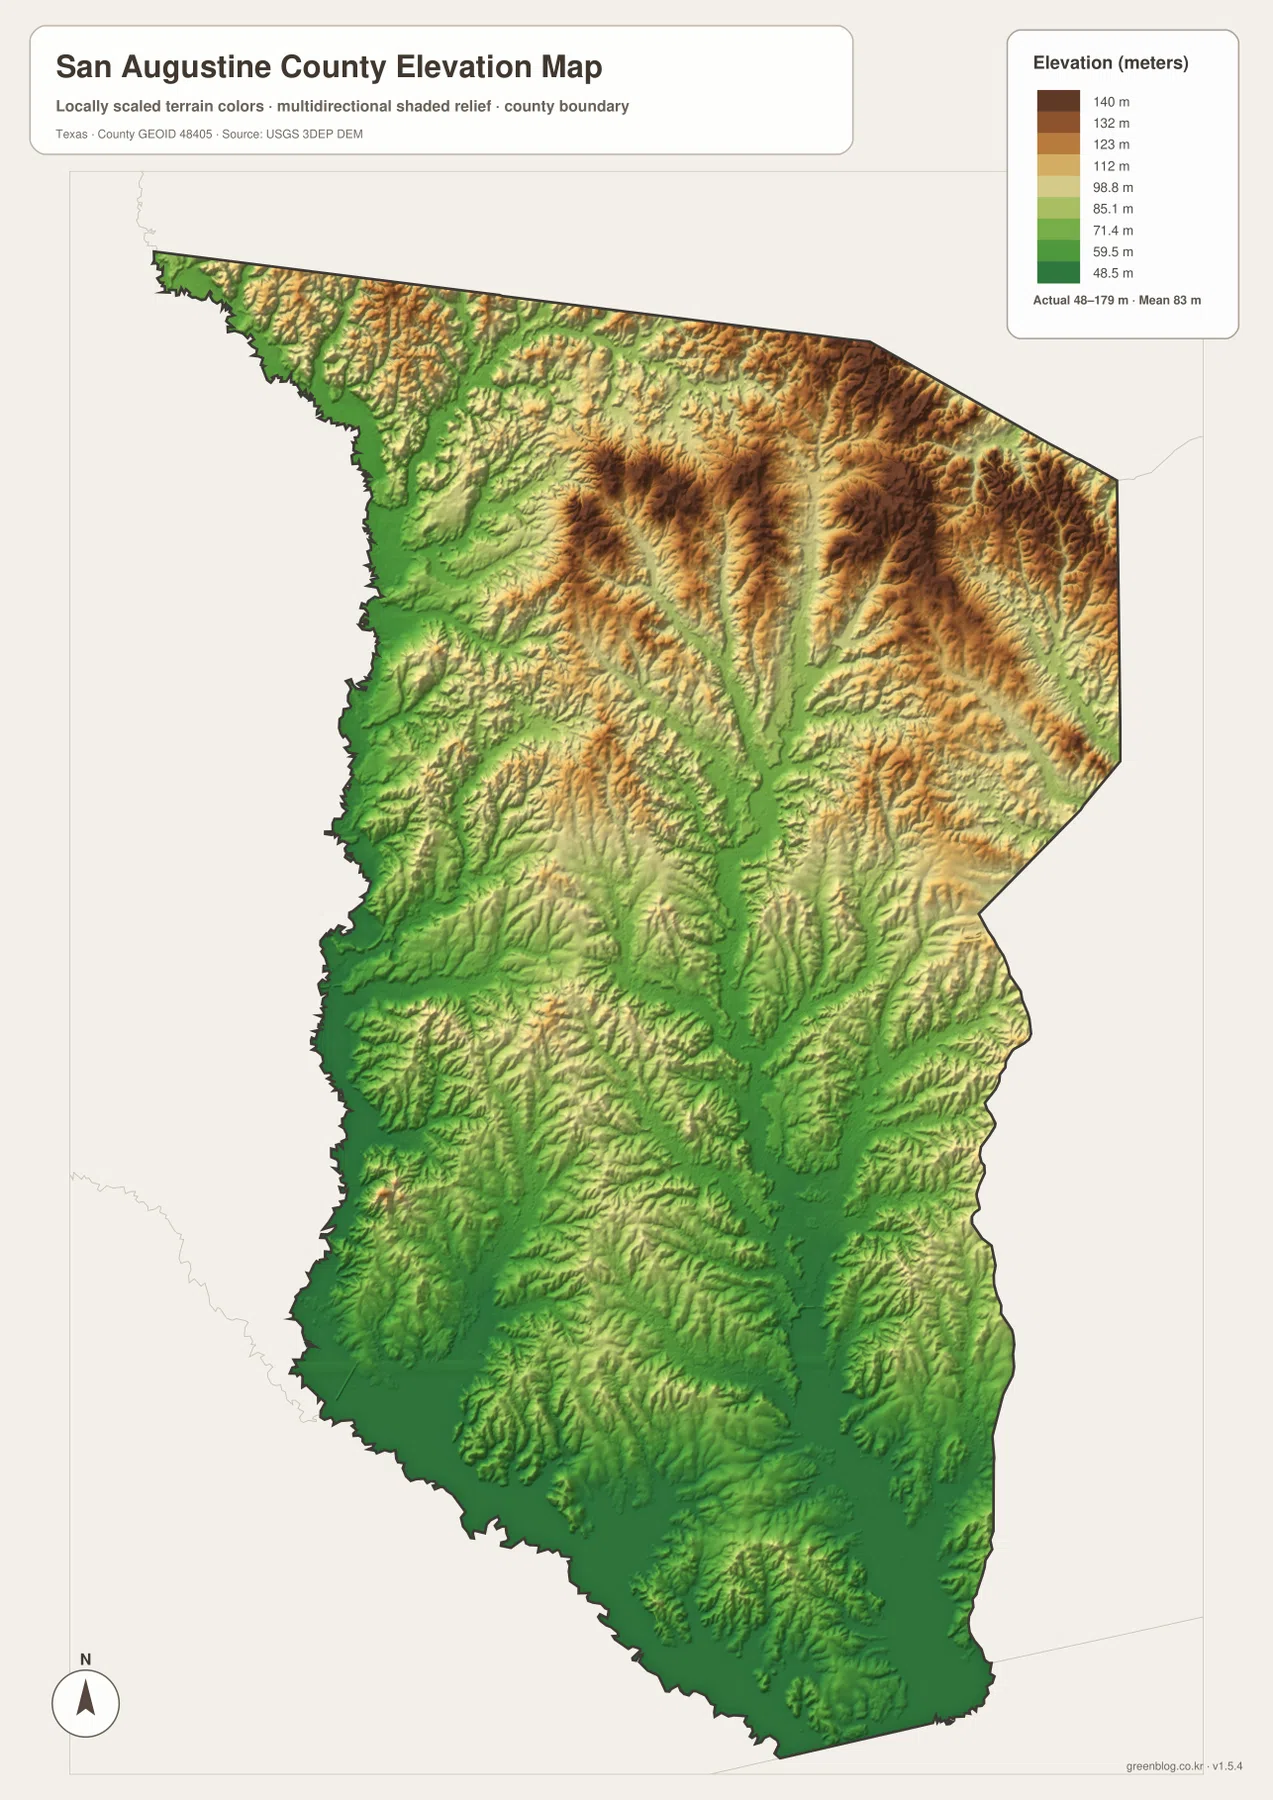
Comparing the elevation and water maps makes the terrain much easier to interpret. Streams generally occupy the lower green corridors, while the yellow and brown ridges separate neighboring drainage lines. The reservoir occupies the low southern end of the county, where the terrain opens into many bays and flooded valleys. A reader does not need technical GIS knowledge to use this comparison; the color changes and named waterways provide enough context to understand the basic relief.
Pick the map that matches the detail you need
Use the general county map for San Augustine, Broaddus, Routes 21, 85, 147, 103, and 96, or when the county boundary needs to appear with roads and streams. The city map is cleaner when only the two ranked places matter. The water map is the better choice for Ayish Bayou, Arenosa Creek, Caney Creek, the smaller lakes, and Sam Rayburn Reservoir. For the contrast between northern ridges and lower southern ground, the elevation map gives the clearest view.
The WebP images in the article are convenient for quick reference on screen. For printing or editing, use the ZIP below. It contains four high-resolution A3 JPG files from this package: the county reference map, city map, terrain-and-water map, and elevation map. Because the files are separate, a reader can print only the map needed for a lesson, presentation, local reference sheet, or personal project.
Frequently Asked Questions
Where are San Augustine and Broaddus on the county map?
San Augustine is in the north-central part of the county, while Broaddus is farther southwest. Route 147 provides the clearest mapped road connection between their general areas, and the city map offers the simplest way to compare their positions.
Where is Sam Rayburn Reservoir on the San Augustine County maps?
The reservoir occupies the southern part of the supplied water map and creates a highly indented shoreline along the lower county edge. Buck Bay and Coleman Bay are labeled around this southern water area.
What elevation range is shown for San Augustine County?
The provided elevation map reports an actual range of about 48 to 179 meters and a mean of 83 meters. Higher ridges are concentrated mainly in the north and northeast, while the terrain becomes lower toward the southern reservoir.
Map File Information
The ZIP contains the four San Augustine County maps in high-resolution A3 JPG format.
- Included Versions: County, city, terrain and water, elevation
- Included Files: 4 A3 JPG maps
Related Maps
Sources and data references
County boundaries and road reference data can be checked through the U.S. Census Bureau TIGER/Line Shapefiles. Rivers, creeks, and water features can be cross-checked with USGS National Hydrography, while elevation data are available through the USGS 3D Elevation Program. The city labels, road numbers, named water features, and elevation figures described in this article are based on the four San Augustine County maps supplied in the current ZIP package.
Green Map creates custom-edited map images using open geographic data sources such as geoBoundaries, Natural Earth, OpenStreetMap, and government open data.
These maps are edited visual materials, not raw data files, and are provided for education, documents, presentations, and graphic reference.