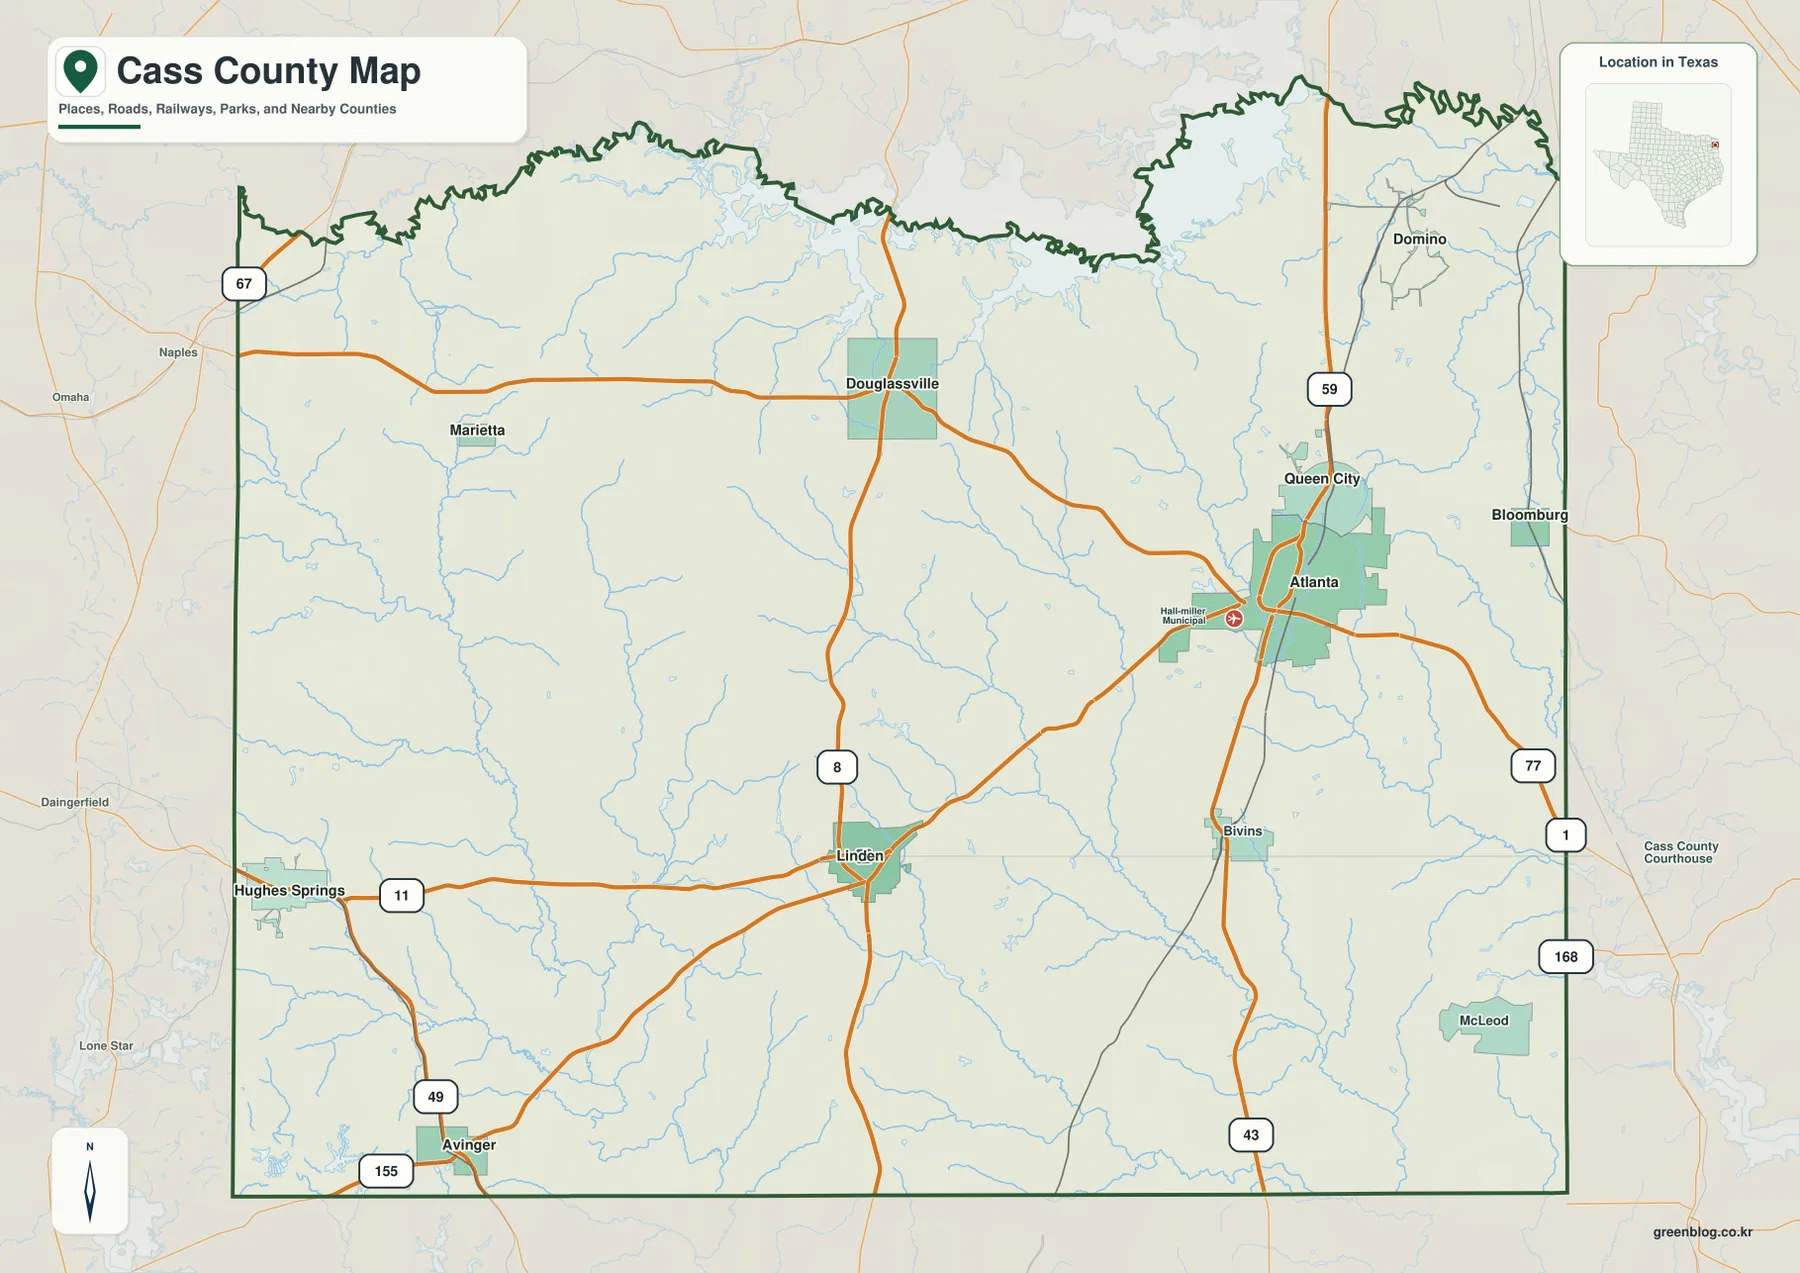
Cass County in Northeast Texas has a dispersed settlement pattern rather than one continuous urban center. Linden sits inland near the middle of the county, while Atlanta and Queen City form a much more concentrated pair to the east. Hughes Springs lies toward the western side, Douglassville is farther northwest, and Avinger is close to the southwest edge. The supplied maps add roads, waterways, and relief to that settlement pattern: US 59 is prominent around Atlanta and Queen City, the Sulphur River follows the northern side, and the elevation surface ranges from about 55 to 191 meters. The matching county, city, water, and elevation maps are also available as four high-resolution JPG files in a single ZIP download.
A practical starting point is to locate Linden and Atlanta, then compare the routes around them. Linden is close to the meeting of Highway 8 and Highway 11, while Atlanta is tied more directly to US 59 and the eastern road network. Moving north brings the irregular Sulphur River boundary into view; moving west and southwest reveals a less urban landscape crossed by Black Cypress Creek and other tributaries. The elevation map adds another distinction, with higher ridges concentrated in the southwest and central portions and lower green corridors following many of the stream valleys.
Table of Contents
From Linden to Atlanta: Two Different Road Settings
The general county map places Linden a little south of the county’s center. Highway 11 approaches from the Hughes Springs side, passes through Linden, and continues east, while Highway 8 runs north toward Douglassville and south beyond the city. Those routes make Linden a useful orientation point for the interior of Cass County. Avinger is farther southwest near routes 49 and 155, so the map also shows how travel toward the southwestern corner separates from the eastward route toward Atlanta.
Atlanta has a very different appearance. US 59 runs through the Queen City–Atlanta area and continues south toward Bivins. Route 77 and several local roads also meet around Atlanta, creating the densest road-and-settlement cluster on the supplied county map. Queen City is immediately north of Atlanta, and the two built-up areas sit much closer together than Linden and Hughes Springs. Bloomburg is near the eastern edge, while McLeod lies farther south near the county boundary.
The northwestern part of the county is more open. Douglassville sits on Highway 8, with Marietta to the west, and the northern boundary becomes highly irregular as it approaches the Sulphur River system. Roads do not simply mirror that boundary. Instead, they cross a landscape where tributaries and low valleys create many bends and separations. This is one reason the road map becomes more informative when it is compared with the supplied terrain-and-water map.
Six Ranked Cities Show How Strongly Atlanta Stands Out
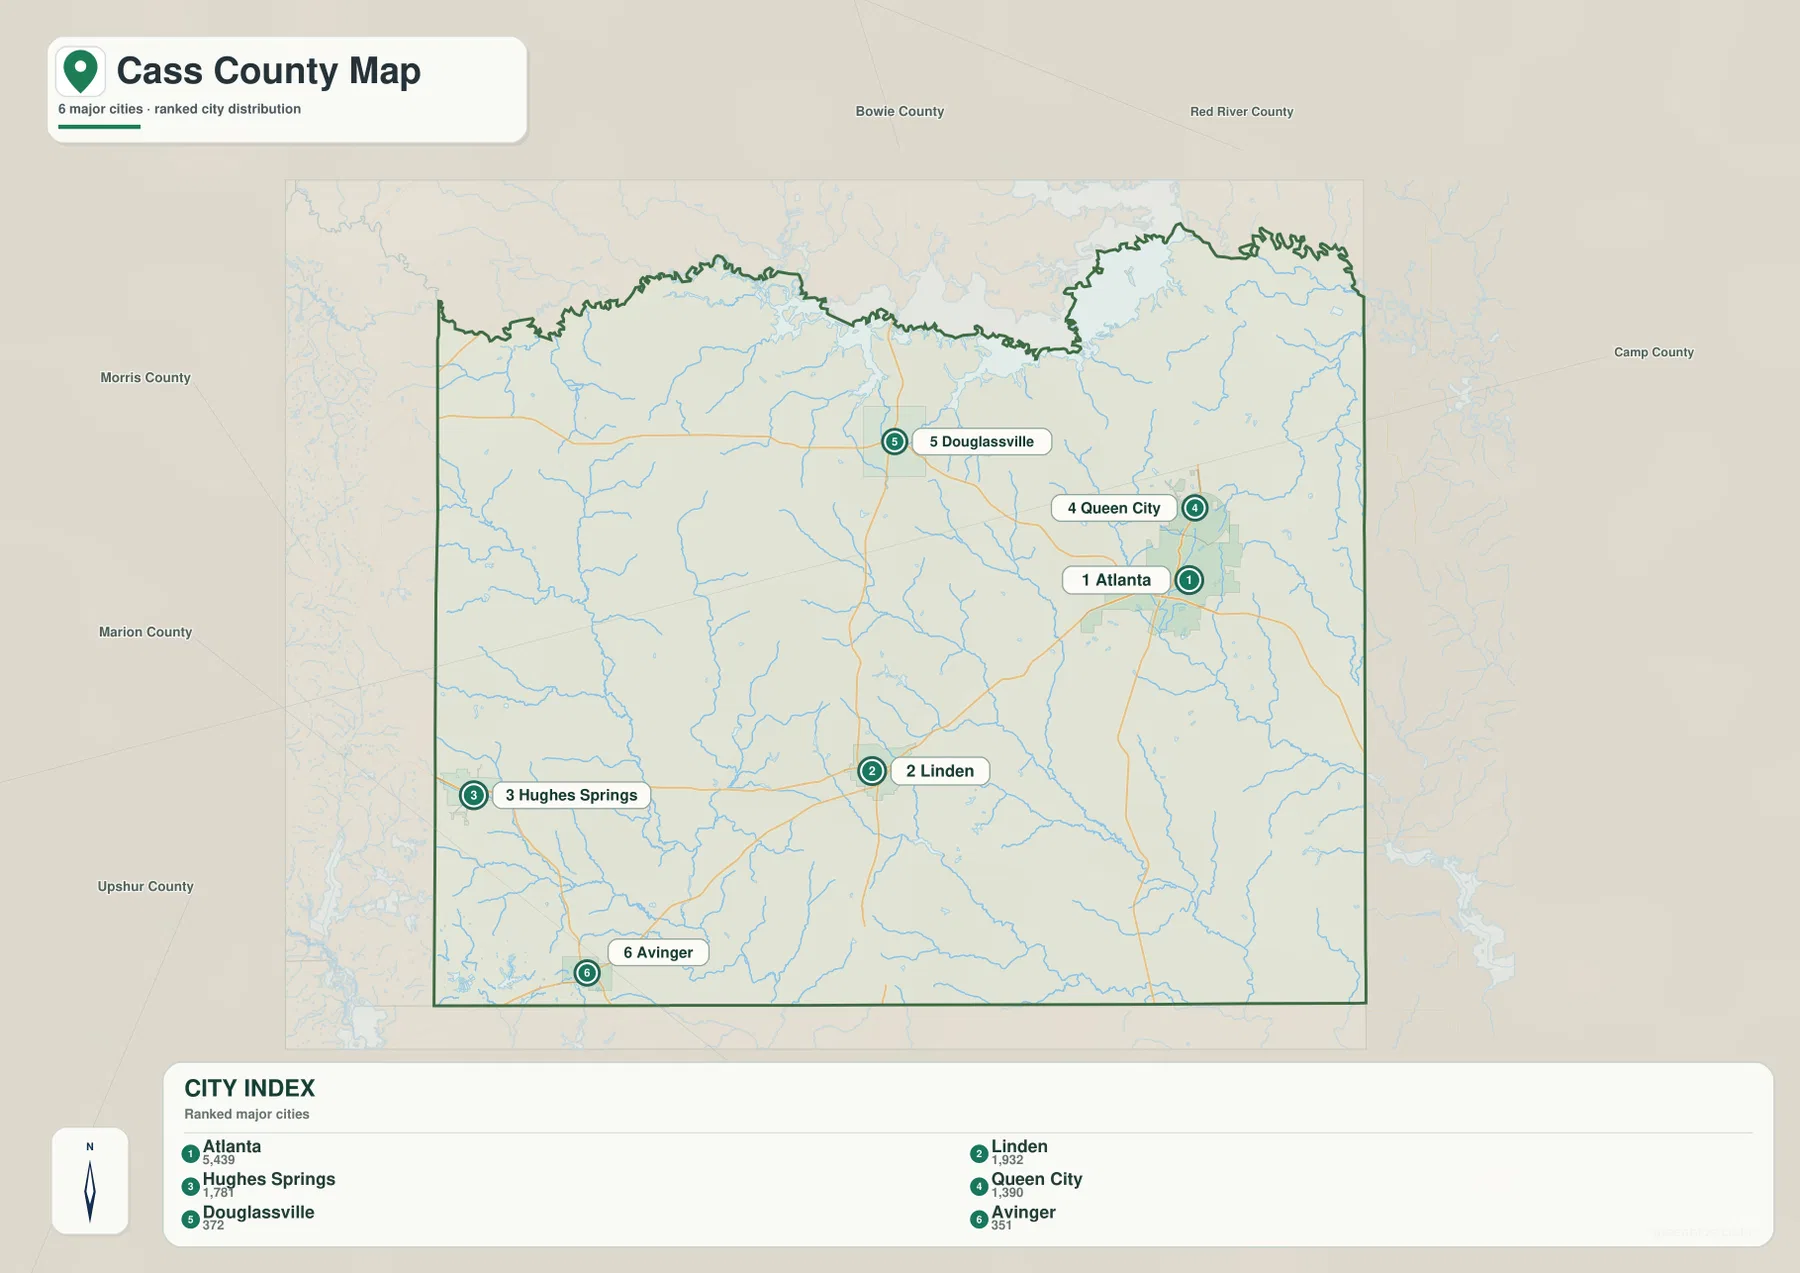
The city-distribution map ranks six places and removes much of the road detail, making the settlement pattern easier to compare. Its index lists Atlanta at 5,439, Linden at 1,932, Hughes Springs at 1,787, Queen City at 1,390, Douglassville at 372, and Avinger at 351. Atlanta is therefore the largest number shown on the supplied city map, while Linden and Hughes Springs form a middle tier and the two smallest mapped communities sit at very different edges of the county.
Location matters as much as rank. Atlanta and Queen City are close together in the east, whereas Linden is separated from them by a broad rural interior. Hughes Springs is near the western side, Douglassville is in the northwest, and Avinger is close to the southwest corner. The result is not a single line of towns but several distinct directions of settlement. That arrangement becomes obvious on the simplified city map because the labels are not competing with every highway and local road.
Neighboring county labels provide useful orientation without requiring a separate regional map. Morris, Marion, and Upshur counties appear along the western and southwestern sides of the view, Bowie and Red River counties are north of Cass County, and Camp County is shown to the east. Once the six city positions are established, those outside labels make it easier to see which communities lie closer to particular edges of the county.
This city map does not show connector lines or city-to-city mileages, so it should not be read as a distance diagram. Its strength is ranking and distribution. For a visitor trying to understand why Atlanta feels more prominent on the road map while Linden remains an important interior reference, the combination of the city index and the general county map answers that question directly.
Sulphur River in the North, Black Cypress Creek and Black Bayou Inside the County
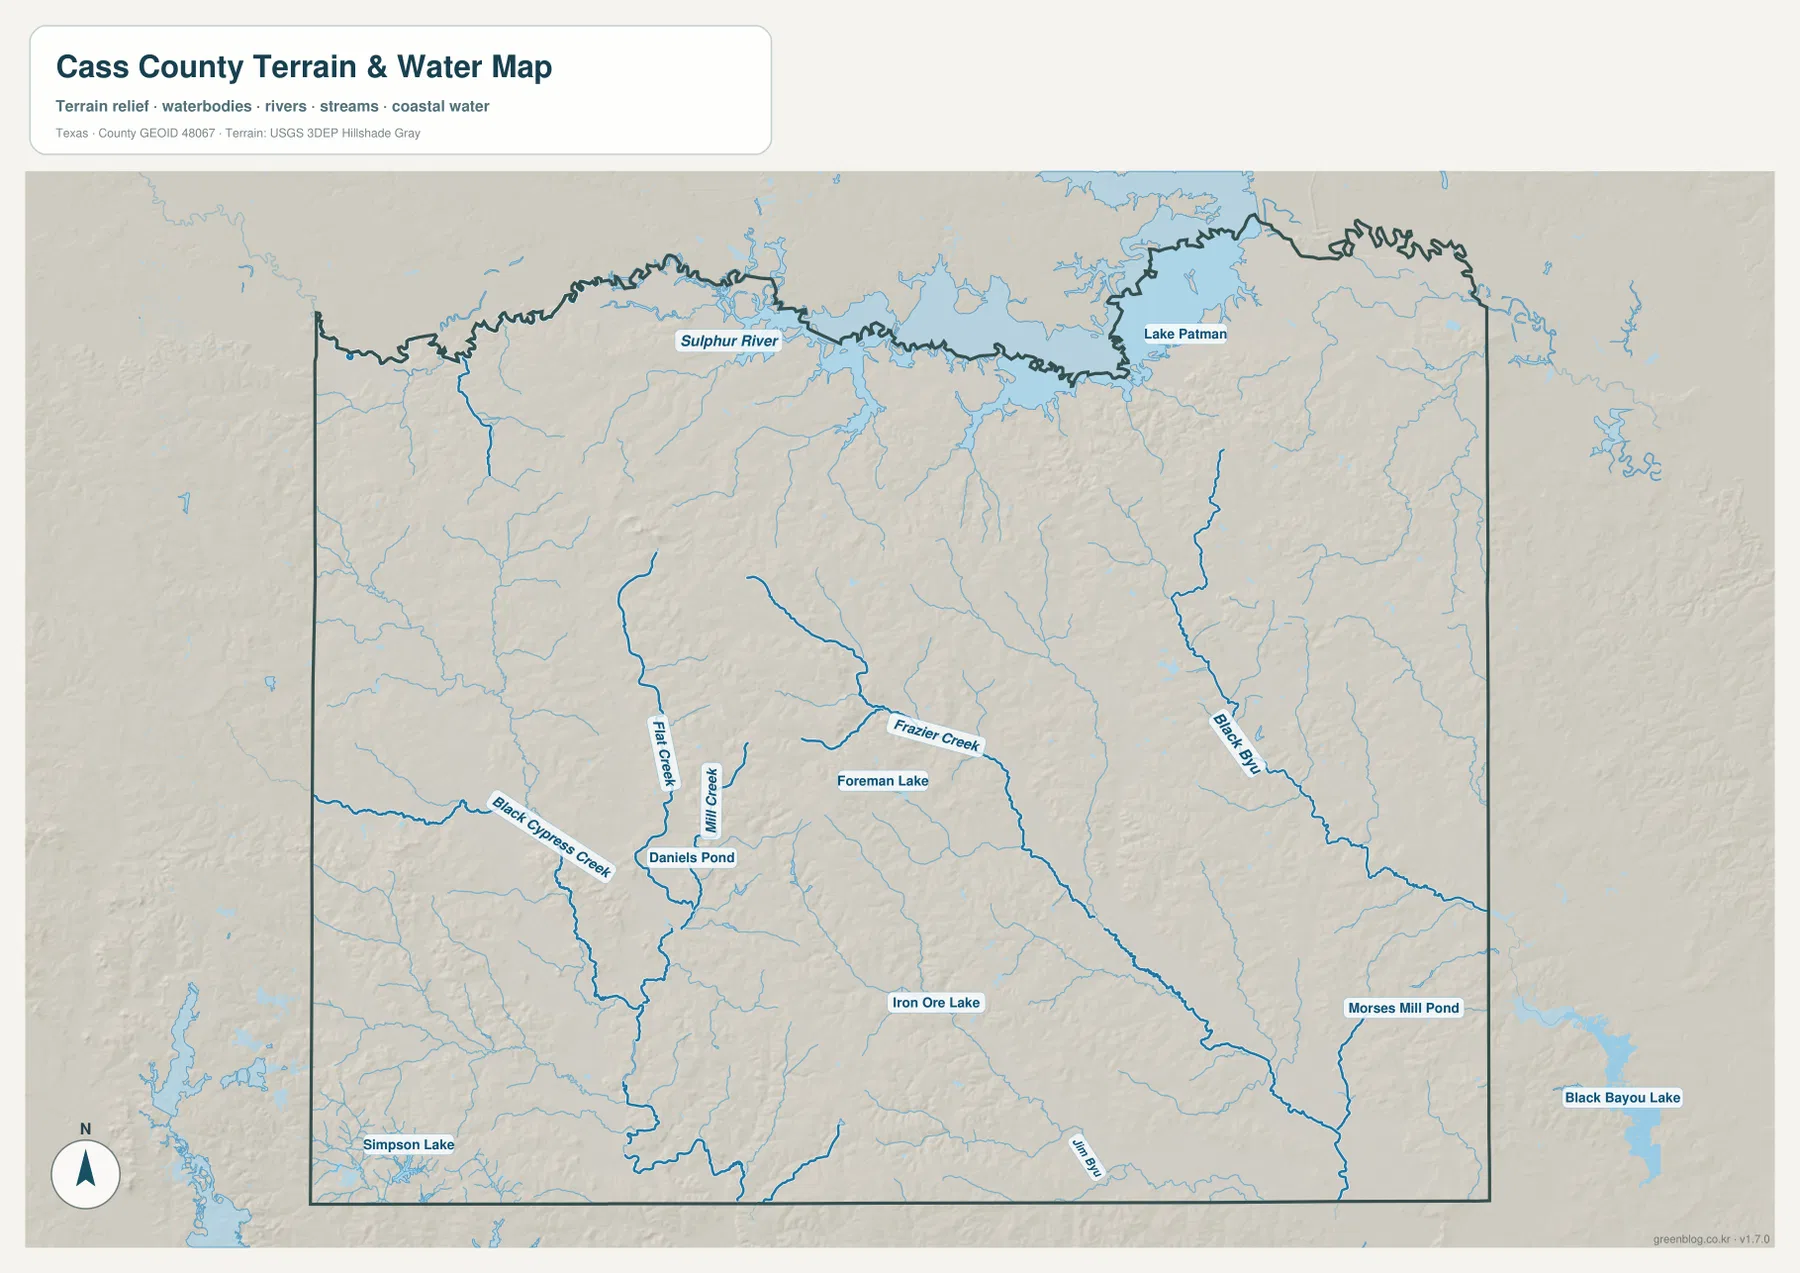
The terrain-and-water map changes the emphasis completely. The Sulphur River is the dominant northern feature, following a highly irregular course close to the county boundary. Near the northeast, the large water body is labeled Lake Patman on the supplied map. This helps explain why the top edge of the county appears so intricate on the boundary map: the river and reservoir country create a very different shape from the straighter southern boundary.
Smaller waterways are spread across the interior. Black Cypress Creek enters the southwestern side, with Flat Creek and Carter Creek nearby. Frazier Creek runs across the central area, and Foreman Lake is labeled close to it. Daniels Pond appears farther west, while Iron Ore Lake provides another useful point in the southern half. These names make the water map particularly useful when a general road map contains too many thin blue tributaries to follow comfortably.
The eastern half has its own strong drainage reference. Black Bayou runs for a long distance from the north toward the southeast, with Morses Mill Pond marked farther east. Black Bayou Lake lies outside the county to the southeast, and Jim Bayou is labeled near the southern boundary. Simpson Lake is visible beyond the southwest side. Together, these features show that Cass County’s drainage is not organized around one river alone; the county contains several tributary systems leading toward different larger waters.
The map is best treated as a geographic reference for the locations of streams, lakes, and terrain. It is not a flood-hazard map, parcel map, water-quality map, depth chart, or navigation product. Those uses require purpose-built official data. For ordinary map reading, the most useful approach is to identify the Sulphur River, Black Cypress Creek, Frazier Creek, and Black Bayou, then compare their paths with the nearby roads and elevation colors.
Elevation from About 55 to 191 Meters Reveals a Creek-Cut Landscape
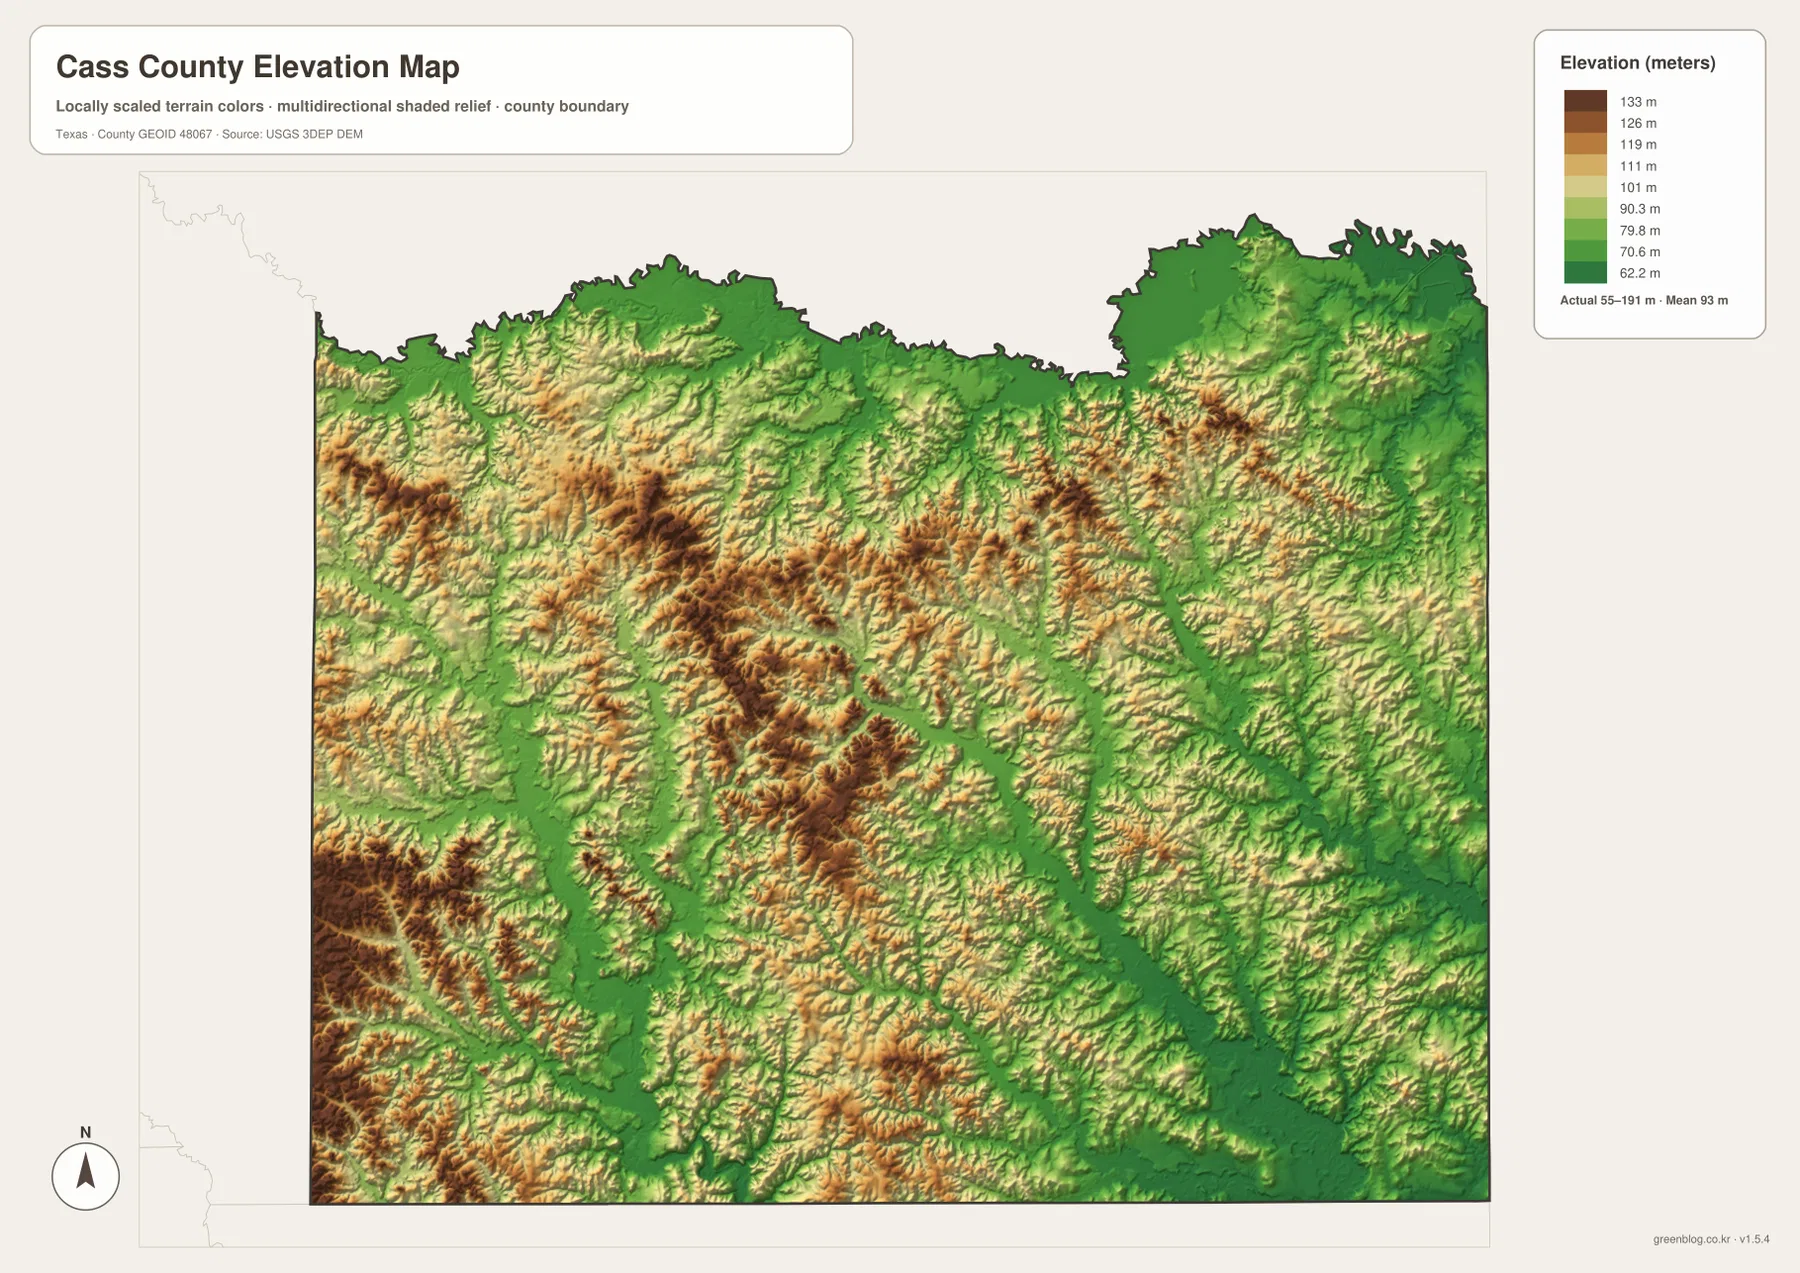
The supplied elevation map reports an actual range of about 55 to 191 meters and a mean near 93 meters. Cass County is not mountainous, but the relief is much more varied than a plain boundary map suggests. The strongest concentration of high brown terrain appears in the southwest, and additional ridges extend through the western and central portions. Lower green terrain follows the northern river corridor and many of the tributary valleys.
The central part of the county is especially useful for comparing the elevation and water maps. Narrow green valleys cut between higher ridges, and several of them align with the creek network visible around Frazier Creek and the Black Cypress system. In the east, Black Bayou occupies another lower corridor, although small ridges remain on both sides. The surface therefore alternates repeatedly between upland and drainage rather than changing in one smooth direction.
Near the northeast, the Lake Patman area occupies broadly lower terrain and connects visually with the low belt along the Sulphur River. The southwestern corner is the opposite: higher colors are much more extensive near the Avinger side and along adjacent ridges. This contrast gives the county a useful internal comparison between a river-and-reservoir edge and a more elevated, strongly dissected southwest.
The elevation surface is designed for county-scale interpretation, not survey or engineering work. It should not be used to determine the exact elevation of a house, parcel corner, road grade, or construction site. The 55–191 meter range and 93 meter mean are most useful as broad references for identifying higher ridges, lower creek valleys, and the way those features relate to the transportation and water maps.
How the Same Part of Cass County Changes Across the Road, Water, and Relief Maps
The Linden-to-Atlanta area is a good place to compare layers. On the county map, the eye follows roads and communities toward the denser eastern settlement cluster. On the water map, however, smaller tributaries repeatedly interrupt that route. The elevation map adds ridges between those low stream corridors. Looking at the same part of the county in all three views explains why a seemingly simple eastward trip crosses a landscape with much more local variation than the road pattern alone suggests.
Hughes Springs and Avinger tell a different story. Their side of the county has less urban concentration than Atlanta, but it is close to Black Cypress Creek and some of the strongest higher relief on the elevation map. Farther north, the Sulphur River and Lake Patman occupy a long low corridor. Those contrasts divide Cass County into recognizable settings: an eastern urban cluster, an interior road hub around Linden, a higher and more creek-cut southwest, and a northern river-and-reservoir edge.
The northwestern area around Douglassville and Marietta also benefits from this cross-reading. The county boundary is extremely irregular to the north, roads are less dense than around Atlanta, and numerous small streams occupy the terrain. In the far east, Bloomburg and McLeod help locate the county edge, while the Atlanta–Queen City cluster remains the clearest built-up reference. Switching maps by question—roads for travel, city ranking for settlement, water for named drainage, elevation for relief—is faster than trying to extract every detail from one image.
Choosing the Best Cass County File for Printing or Comparison
The county map is the best single choice for general orientation because it combines Linden, Atlanta, Queen City, Hughes Springs, Douglassville, Avinger, major roads, and the county outline. The ranked city map is cleaner when the purpose is to compare settlement size and distribution. For named streams such as the Sulphur River, Black Cypress Creek, Frazier Creek, or Black Bayou, the water map is much easier to read. The elevation map is the most direct option when the difference between the higher southwest, central ridges, and lower river valleys matters.
High-resolution files are particularly useful in Cass County because many of the tributary labels are too small to read comfortably in a reduced web preview. Enlarging the original JPG also makes it easier to compare the Atlanta–Queen City road cluster with the more dispersed western communities. When several Northeast Texas counties are being placed side by side, using the same map type at a similar scale helps prevent display size from being mistaken for a real difference in road or settlement density.
The ZIP below contains four high-resolution JPG files corresponding to the county, city, water, and elevation maps shown in the article. They can be enlarged for detailed label reading, printed for classroom or personal reference, or arranged with neighboring county maps for regional comparison.
Frequently Asked Questions
How do Atlanta and Linden differ on the Cass County maps?
Linden is an interior reference near Highways 8 and 11, while Atlanta sits in the denser eastern road cluster around US 59 and Queen City. The ranked city map also places Atlanta first and Linden second, making both the size contrast and the different locations easy to compare.
Where is the Sulphur River most visible in Cass County?
On the supplied terrain-and-water map, the Sulphur River follows the northern side of the county and is especially prominent near the irregular northern boundary. The large water body labeled Lake Patman appears toward the northeast, creating a broad low-water setting that is easy to match with the elevation map.
Which part of Cass County is highest on the supplied elevation map?
The strongest higher terrain appears in the southwest, with additional elevated ridges through parts of the west and center. The mapped elevation range is about 55–191 meters with a mean near 93 meters, while the Sulphur River and many creek valleys occupy lower ground.
Sources and Reference Data
- U.S. Census Bureau TIGER/Line Shapefiles — official geographic boundary, road, and place data.
- USGS National Hydrography — official stream, river, and lake information.
- USGS 3D Elevation Program — official elevation and terrain data information.
- USGS The National Map Viewer — interactive access to boundaries, transportation, hydrography, terrain, and other geographic layers.
Map File Information
Download the Cass County county, city, water, and elevation maps together as high-resolution JPG files.
- Included Files: 4 maps
- File Type: JPG
Related Maps
- Morris County Texas map
- Red River County Texas map
- Panola County Texas map
- Rusk County Texas map
- Upshur County Texas map
Green Map creates custom-edited map images using open geographic data sources such as geoBoundaries, Natural Earth, OpenStreetMap, and government open data.
These maps are edited visual materials, not raw data files, and are provided for education, documents, presentations, and graphic reference.