The 2025 Pinellas County land-cover summary is dominated by one category: developed land covers 73.84% of the mapped county area. Water accounts for 12.35% and wetlands another 10.49%, leaving forest at 2.13%, agriculture at 0.51%, and only very small shares of grassland and shrubland. On the map, the developed color fills most of the long peninsula while water and wet ground repeatedly appear around the edges and in selected interior pockets.
This page compares four views of the same county: 2025 land cover, forest and farmland, impervious surface and developed land, and 1985–2025 class differences. The WebP images are convenient for reading on the page, and the four original JPG maps are available together in one ZIP download below. They can be used for county profiles, classroom work, presentations, and comparisons between urban cover and the remaining coastal or natural surfaces.
Table of Contents
The impervious map shows how intensely the developed footprint is built
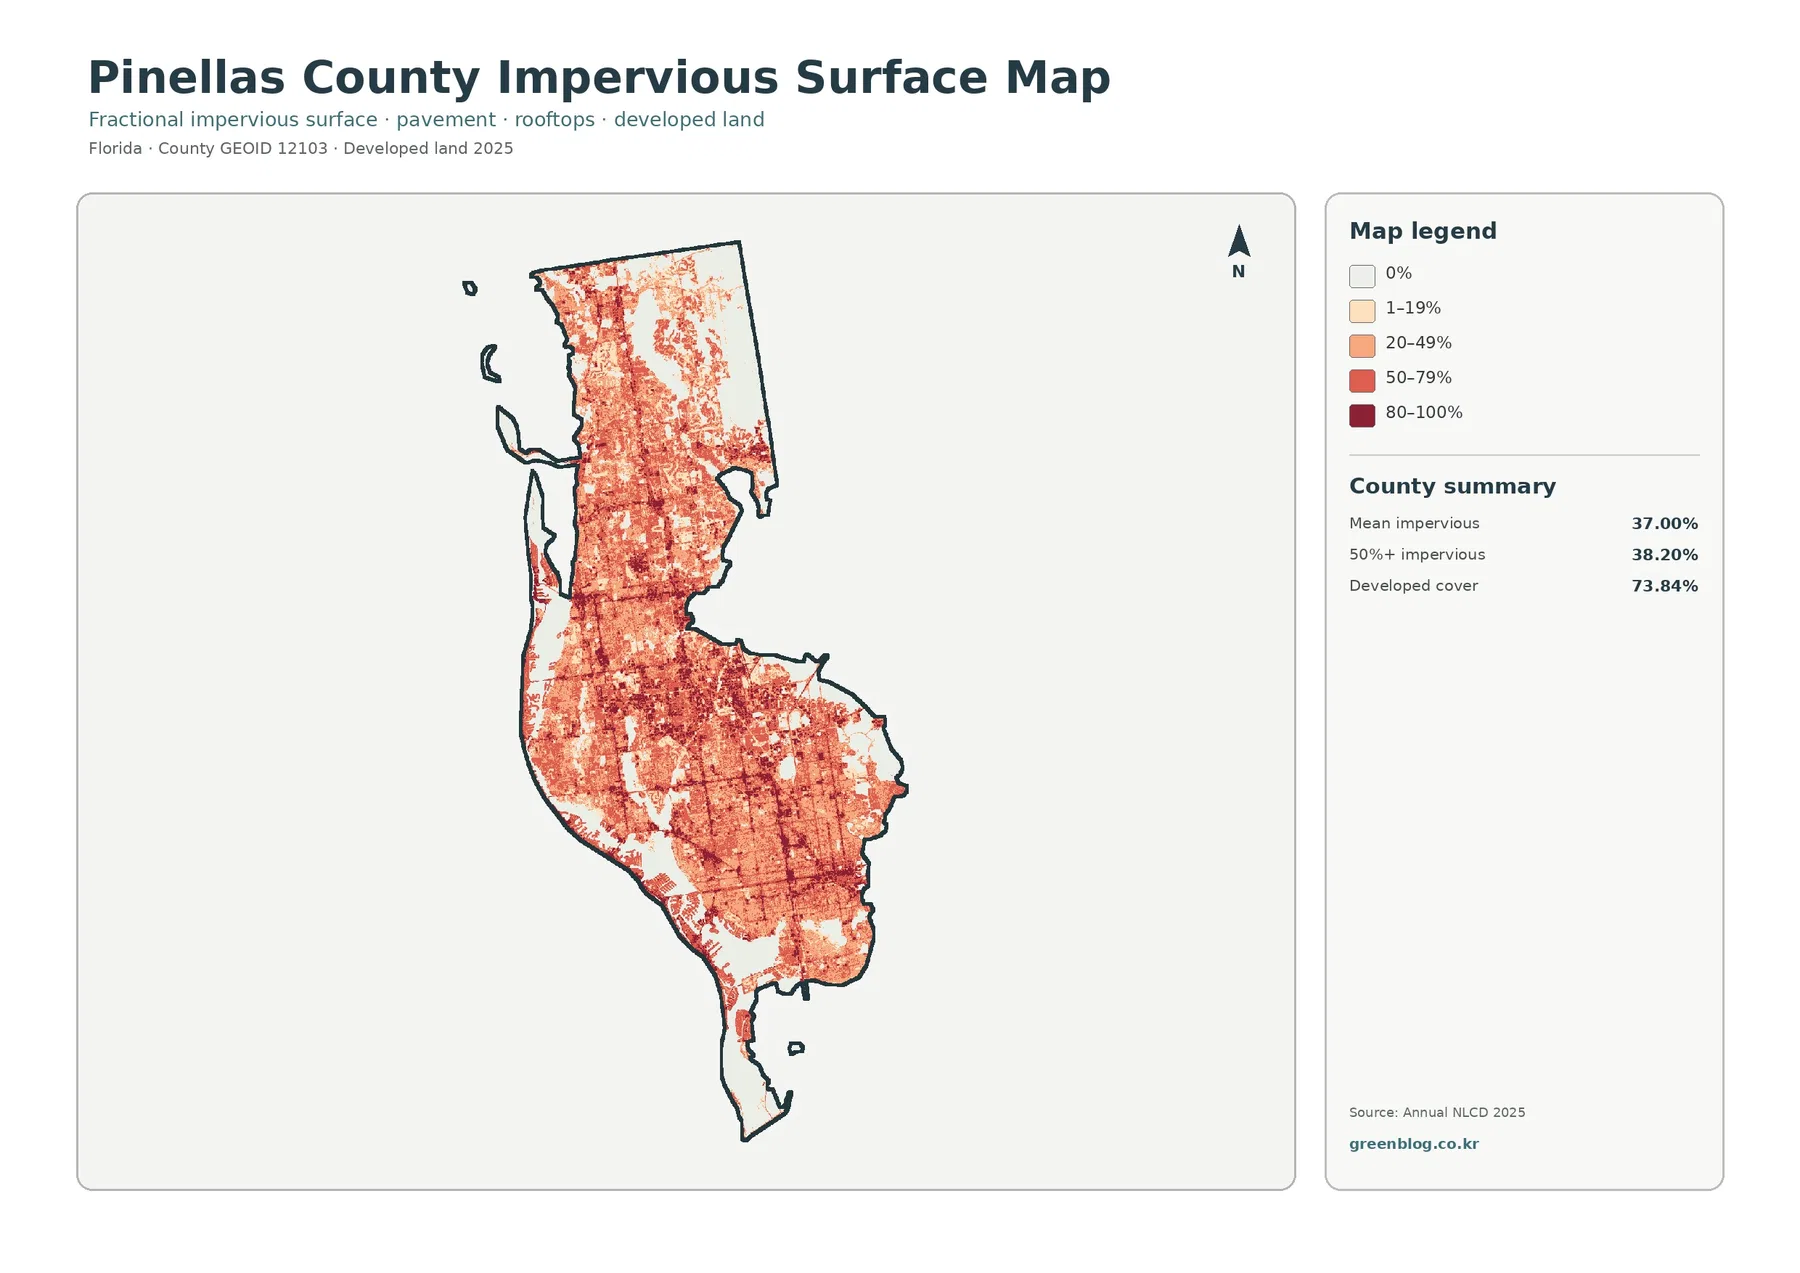
Pinellas County has a mean impervious cover of 37.00%, and 38.20% of the mapped area falls in the 50%-or-greater impervious category. Those figures are unusually important here because developed land is already the dominant 2025 cover at 73.84%. The impervious map adds a second layer of information by showing where the developed landscape contains the highest concentrations of roofs, streets, parking areas, and other hard surfaces.
Darker impervious colors occur through broad parts of the central and southern peninsula and continue through much of the northern developed area. Lighter patches interrupt that pattern where open space, water, wetlands, or lower-density development reduce the hard-surface fraction. The result is not a single uniform block of pavement; development intensity changes noticeably even inside a county where developed cover is widespread.
The difference between 73.84% developed land and a 37.00% mean impervious value is useful to explain. A developed land-cover cell can include lawns, trees, landscaped areas, or other permeable ground alongside buildings and roads. Impervious percentage focuses on the hard portion only, so the two values answer different questions and should not be substituted for one another.
Some narrow dark features resemble transportation corridors, but this is not a road map. It does not identify route names, lane counts, traffic volume, or pavement condition. A high impervious percentage also does not by itself prove drainage or flood problems; those questions require rainfall, elevation, drainage, soil, and hydrologic information that is outside this map set.
A countywide view is mostly developed land bordered by water and wet ground
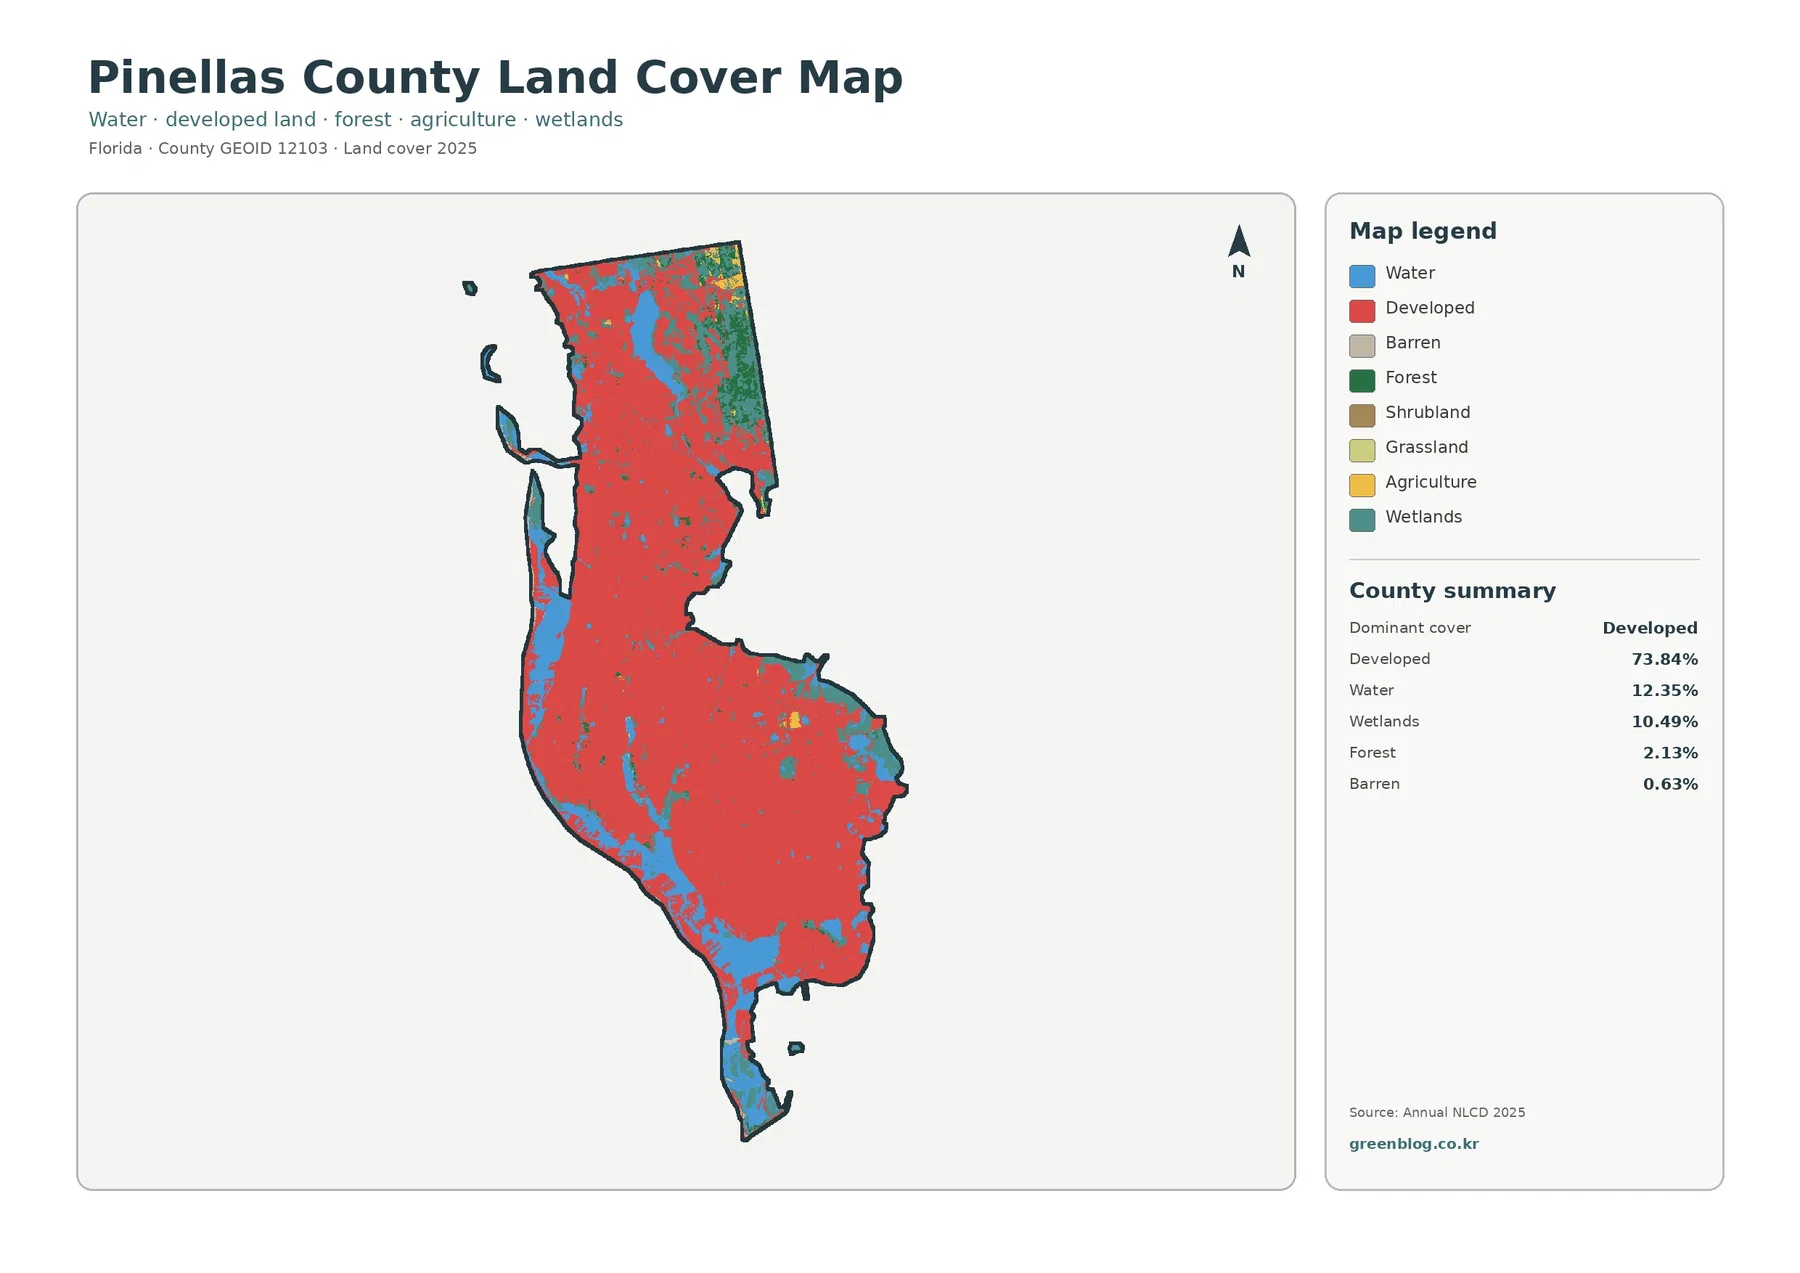
The general map explains why the impervious values are so high. Red developed cover extends from the northern end of the county through the central peninsula and across most of the south. The county summary reports 73.84% developed cover, and the broad red field on the map makes that dominance visually obvious before any percentages are read.
Pinellas County is a narrow peninsula on Florida’s west coast, positioned between the Gulf coast and Tampa Bay. The county’s own geographic overview describes this peninsula setting and its long shoreline. That context helps explain the repeated blue water along the map edges and the close proximity between urban land and coastal environments without requiring the land-cover image itself to label every bay, beach, or island.
Water is the second-largest mapped class at 12.35%. Blue areas appear along both sides of the peninsula, around the southern end, and in several interior water bodies. Because the county has a highly indented shoreline and offshore or barrier features, water is not a minor background element; it is a substantial part of the mapped composition.
Wetlands account for 10.49%. Teal areas are visible around coastal margins and bay-side edges, but they also appear in northern and interior locations. They should not be treated as simply another kind of open water. Wetlands may contain vegetation and saturated or seasonally wet ground, so they can occupy a sizable area without appearing as continuous blue water.
Forest is only 2.13%, barren land 0.63%, and agriculture 0.51%. Grassland and shrubland are smaller still at 0.03% and 0.01%. These values make Pinellas very different from a county where forest or agriculture sets the visual character. Here, the main countywide story is the relationship among developed land, water, wetlands, and the smaller natural areas that remain inside or beside a heavily urbanized peninsula.
Land cover is not zoning, ownership, or a legal land-use designation. It classifies what covers the ground in remotely sensed data. A red developed cell may contain a home, road, lawn, trees, and open ground together, and a wetland cell does not automatically identify a regulatory wetland boundary. Parcel and permitting questions require separate official records.
Forest and wetland remnants stand out once developed land is simplified
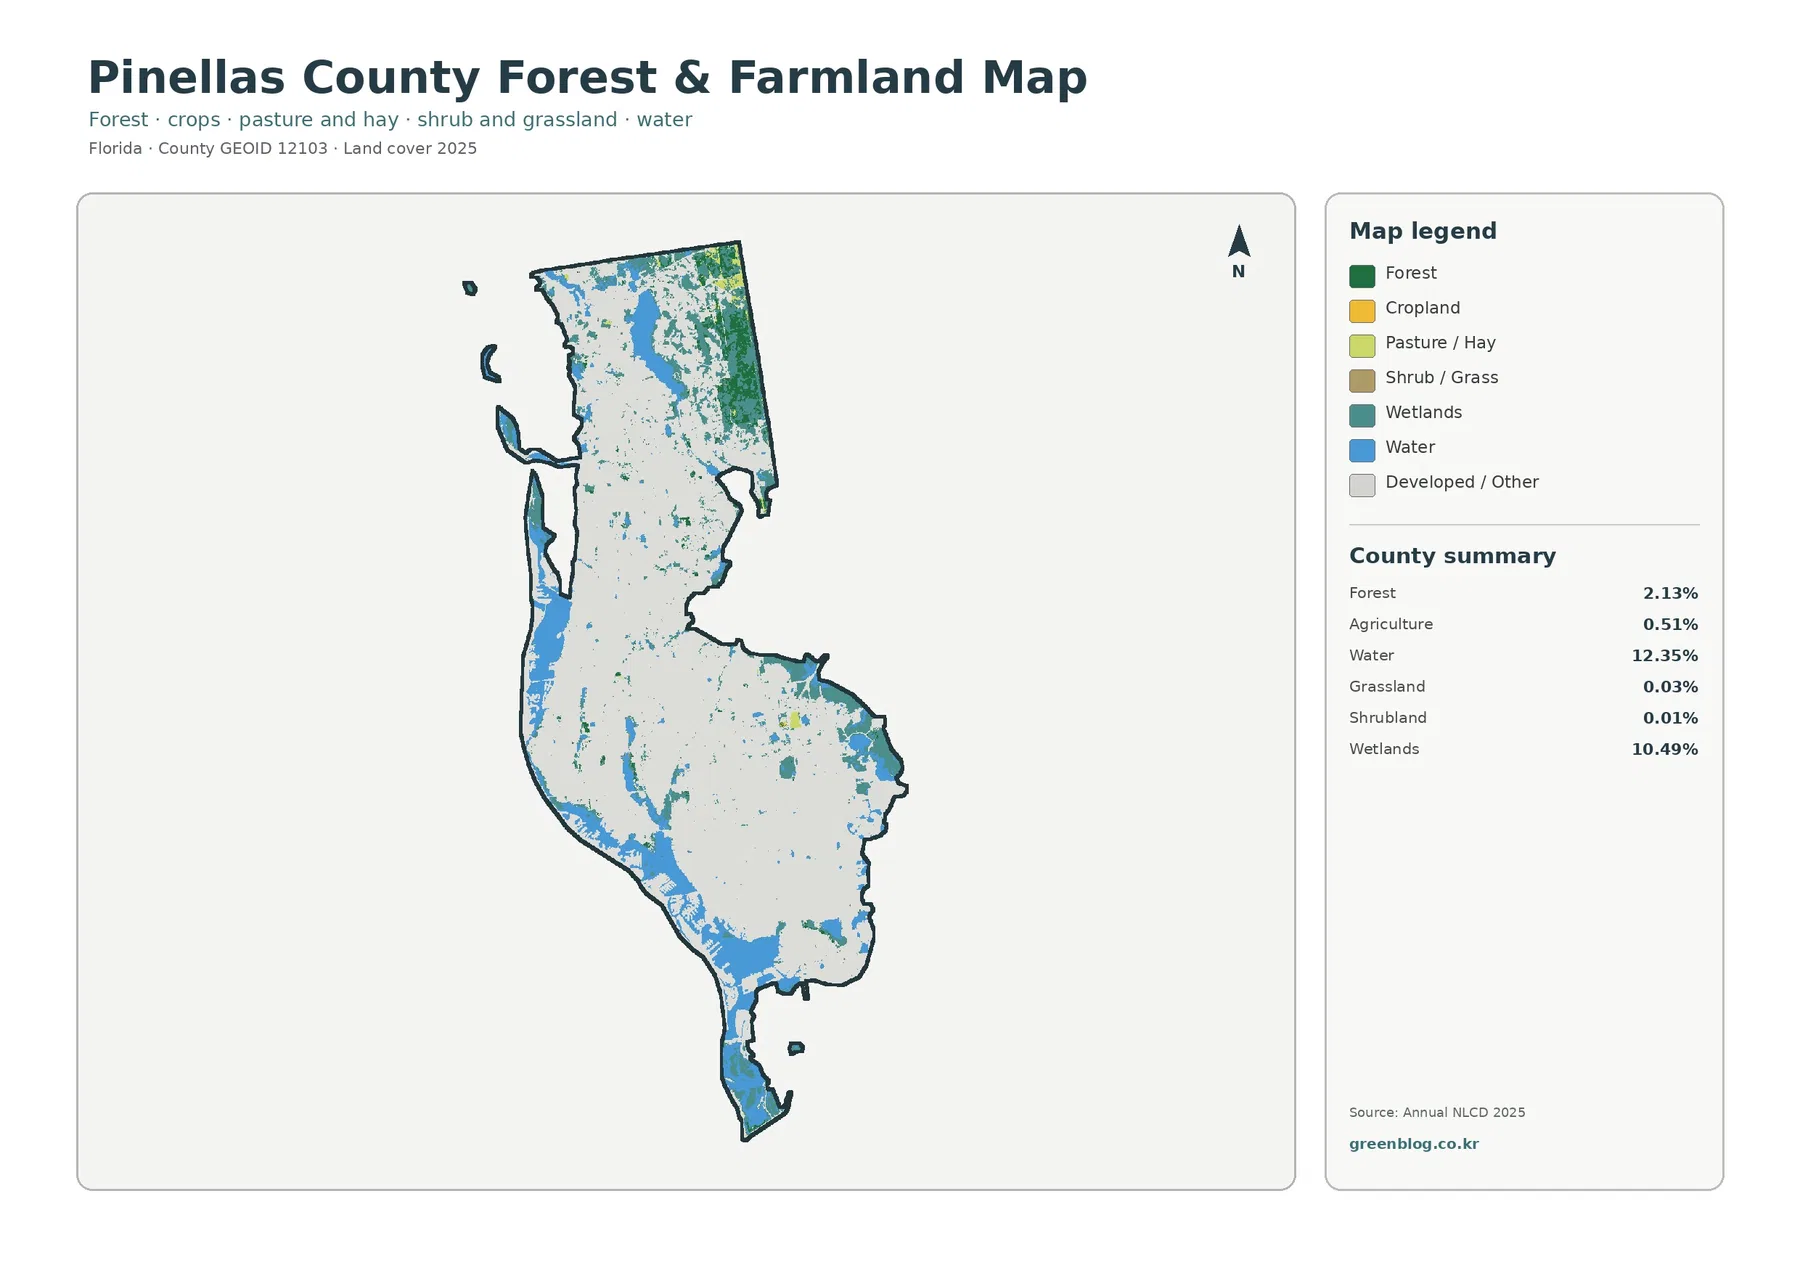
The forest-and-farmland view turns most developed or other land light gray, which makes the smaller natural classes easier to follow. Forest is most noticeable in the north and northeast, with smaller green pieces elsewhere. The countywide share is only 2.13%, but its distribution is not uniform; some areas retain visibly larger wooded tracts than the highly developed center and south.
Pinellas County’s Parks and Conservation Resources information identifies Brooker Creek Preserve, Weedon Island Preserve, and other managed natural lands. The map does not include preserve boundaries, so a green or teal patch should not be assigned to a named preserve simply from color. The official information is useful as background, however, because it confirms that natural lands remain actively managed within this densely developed county.
Agriculture is only 0.51% in the supplied 2025 summary, and agricultural colors are correspondingly scarce. There is no broad farming district comparable with agricultural counties farther inland. The focused map may distinguish cropland from pasture or hay visually, but the verified county statistic combines agriculture, so exact subtype percentages should not be estimated from the image.
Wetlands remain much more prominent than forest or agriculture. Their 10.49% share appears along shorelines and in scattered inland pieces, while water at 12.35% frames much of the peninsula. Looking at these classes together is more informative than discussing forest alone because coastal and wet surfaces form a larger part of the county’s remaining non-developed landscape.
This view is useful when the goal is to identify where natural cover is concentrated rather than where every developed category lies. It is not a conservation ownership map, habitat inventory, or legal wetland map. A wooded cell could be public or private, and a wet cell could fall inside or outside a managed preserve; those questions need authoritative boundary data.
The 1985–2025 comparison marks 16.06% of cells as different
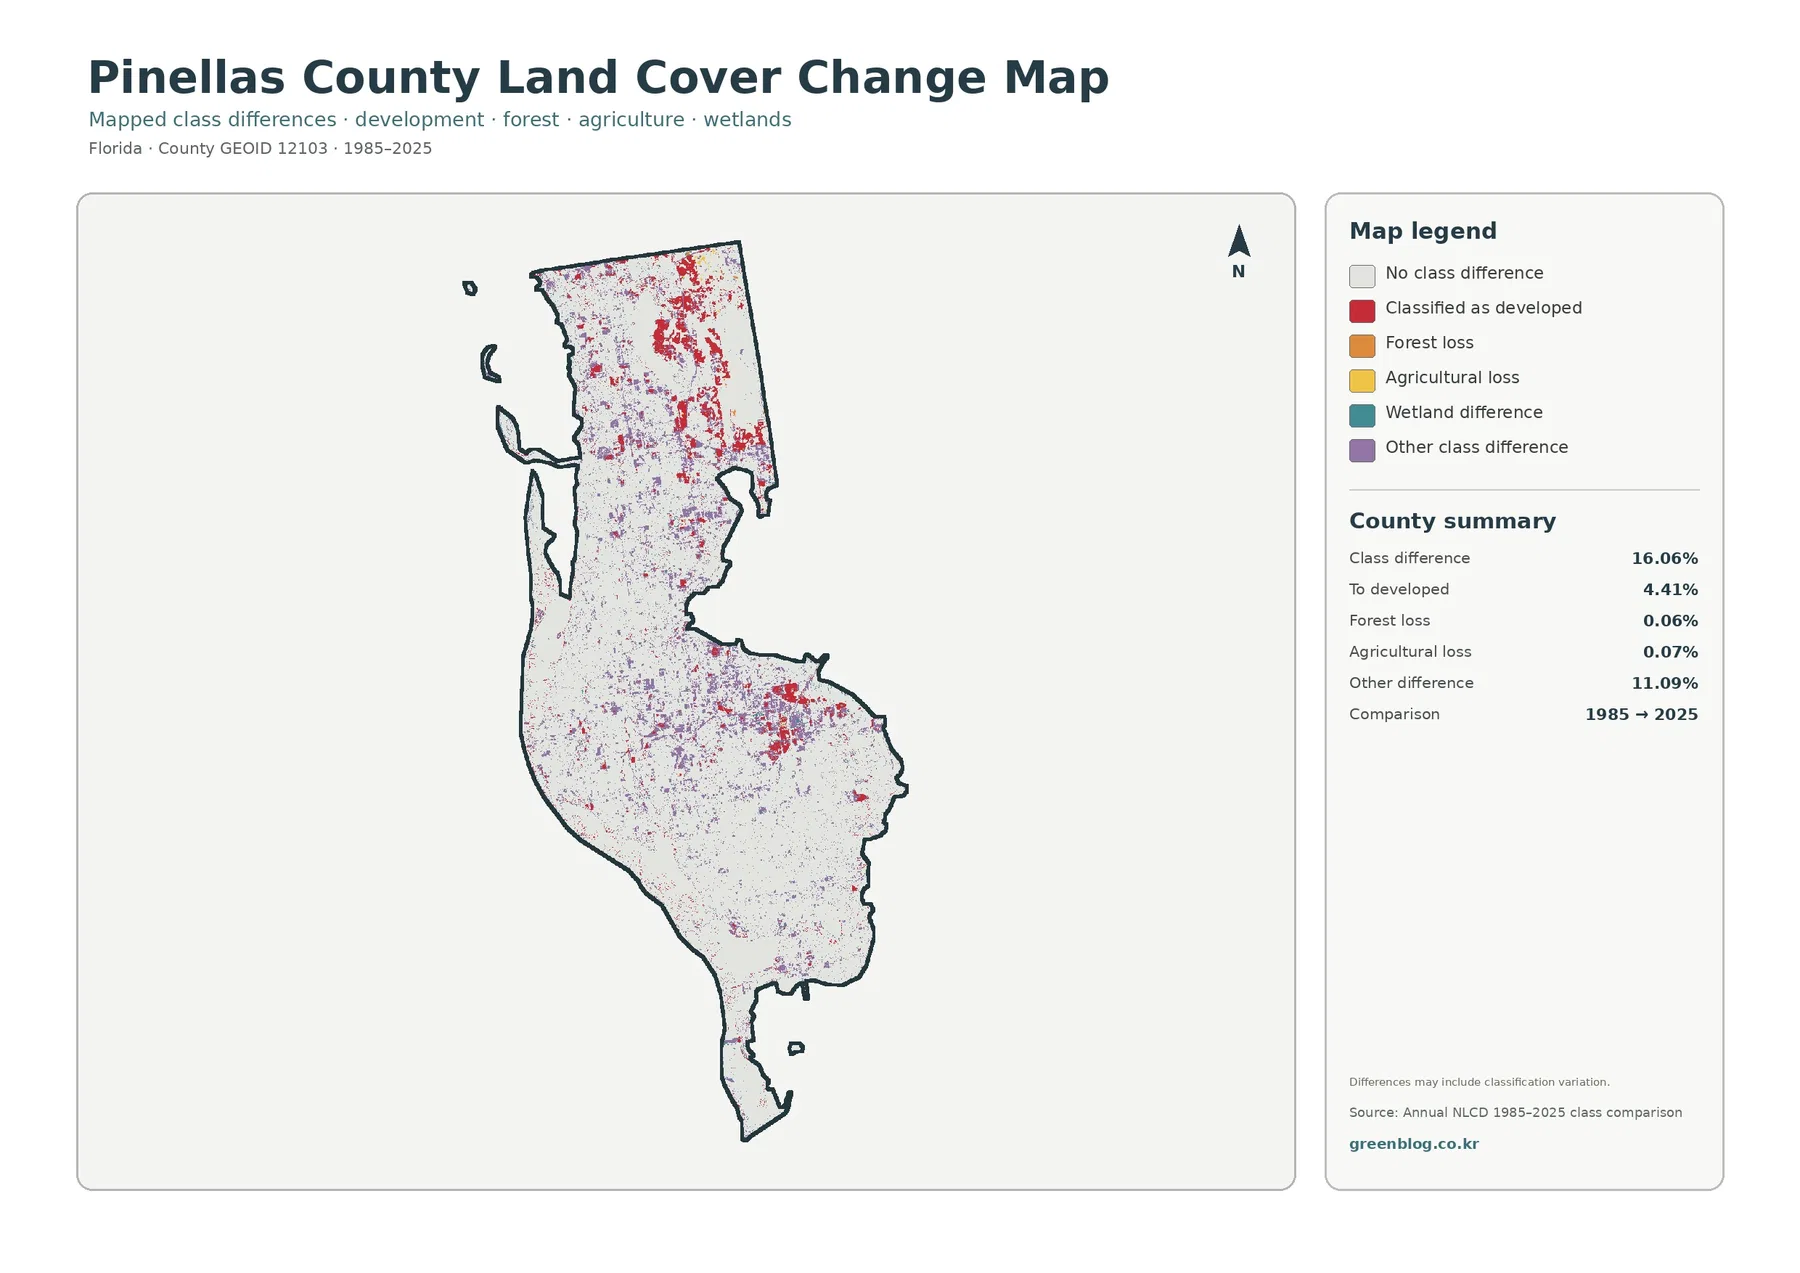
The supplied comparison reports a total class difference of 16.06% between 1985 and 2025. Within that total, 4.41% is listed as classified to developed, 0.06% as forest loss, 0.07% as agricultural loss, and 11.09% as other difference. The legend also includes wetland difference, but no separate verified percentage is provided for that category.
Red developed-difference cells are most noticeable in parts of the north and center, with smaller clusters elsewhere. They should not be interpreted as meaning that 73.84% of the county became developed during the comparison period. The current developed share and the two-date change category are separate measures: one describes the 2025 surface, while the other flags cells whose classifications differ between the two dates.
Other difference accounts for 11.09%, which is the largest named component of the 16.06% total. Purple and light difference marks are scattered through many sections of the county. A change symbol can represent a real shift in cover, but classification rules, imagery conditions, seasonal differences, or mixed pixels may also influence how a cell is labeled.
For that reason, the 16.06% value should not be rewritten as “16.06% of Pinellas County was physically transformed.” It is the share of cells receiving different classes in the two snapshots. A cause should be assigned only after checking intermediate imagery, local development records, environmental information, or other evidence suited to the location.
Forest loss at 0.06% and agricultural loss at 0.07% are very small countywide values. Their small size partly reflects the limited amount of forest and agriculture present in 2025. A small percentage can still be worth examining locally, but the map does not support claims about a specific project, property owner, or cause.
Water, wetlands, and the coastline remain important inside an urban county
Pinellas is easy to describe as urban because developed land covers nearly three quarters of the mapped area, yet the shoreline setting remains visible in every map. Water and wetlands together account for more than one fifth of the summary, and both repeatedly meet developed areas along the peninsula’s edges. The maps therefore work best when urban cover and coastal surfaces are discussed together rather than as unrelated topics.
The county’s official coastal information describes 35 miles of sandy beaches on 11 barrier islands. Those legal or named coastal features are not drawn as separate thematic boundaries in this land-cover set, but the official context helps explain why a county with such a large developed share can still contain extensive water-facing edges and wet environments.
Open water and wetlands deserve separate labels in classroom or presentation graphics. A blue area represents water as the dominant mapped surface, while a wetland can include vegetation and seasonally saturated ground. Combining the 12.35% water figure and the 10.49% wetland figure into one unlabeled category would erase a distinction the source maps intentionally preserve.
The northern forest concentrations offer another useful contrast. Although forest is only 2.13% countywide, the focused map shows larger green sections in the north than in most of the center and south. This is a good example of why percentages should be paired with location: a small class can still be regionally important when it is concentrated rather than evenly scattered.
Use all four maps to separate area, intensity, and change
The general land-cover map answers the broadest question: what kinds of surfaces occupy the county in 2025? It is the strongest opening figure because the 73.84% developed share, 12.35% water, 10.49% wetlands, and much smaller forest and agricultural classes can all be seen in one frame.
The impervious map answers a different question: how much of the surface is hard and where is that hard cover concentrated? Comparing a 37.00% mean with the 73.84% developed share shows why the phrase “developed land” should not be treated as a synonym for “paved land.” The 38.20% area at 50% or greater impervious cover also shows that high-intensity hard surfaces occupy a substantial part of the county.
The vegetation-focused view is best for locating the limited forest and agricultural cover that can be hard to notice on the general map. Wetlands and water remain visible as important companions to those categories. This makes the map suitable for a discussion about where natural surfaces remain within a largely developed peninsula.
The change map should be introduced last when an audience already understands the current landscape. It does not show a fifth set of present-day land-cover classes. Instead, it identifies where the 1985 and 2025 classifications differ, with 16.06% total class difference and 4.41% classified to developed among the supplied summary values.
Together, the maps prevent several common mistakes. They separate developed area from hard-surface intensity, wetlands from open water, present condition from two-date difference, and physical cover from legal land use. Those distinctions matter especially in Pinellas County because dense development sits close to water, wet ground, parks, and other natural surfaces.
Scale and classification limits matter when the map is enlarged
The original JPG files in this package are 2480 × 1754 pixels. The asset manifest does not mark them as meeting its A3 high-resolution reference. They remain practical for screen use, ordinary printing, and presentation graphics, but a large enlargement cannot create detail that does not exist in the source image.
Annual NLCD is raster data. The landscape is divided into grid cells and each cell is represented by a class or, for the impervious product, a percentage. A real location can contain pavement, trees, grass, open water, and soil within a small area, so the mapped cell is a simplified representation rather than a surveyed boundary.
Edges deserve particular caution in Pinellas County because so many developed areas sit near shoreline, wetland, park, and open-water surfaces. A sharp color edge in the image should not be assumed to match a parcel line, regulatory wetland limit, seawall, or ownership boundary. The map is designed for county-scale patterns, not site staking.
The 2025 view also represents the supplied observation year. Later redevelopment, vegetation changes, restoration work, or other surface changes may not be reflected. For current property decisions, Pinellas County provides separate zoning and land-use resources, and those official planning tools should be used rather than inferring legal status from a land-cover color.
What the download includes
The ZIP contains the four original JPG maps used in this article: the 2025 land-cover overview, forest and farmland view, impervious surface and developed land map, and 1985–2025 class-difference map. Keeping the set together makes it easy to move from a broad county profile to a focused discussion of natural cover, development intensity, or long-term classification differences.
Use the general map when one image must summarize Pinellas County, the impervious map when hard-surface intensity is the subject, the forest-and-farmland view when remaining natural cover needs emphasis, and the change map when comparing the two supplied dates. Preserve the original aspect ratio when placing a map in slides or printed material, and use current authoritative data for parcel or regulatory work.
Frequently Asked Questions
How much of Pinellas County is mapped as developed land in 2025?
Developed land is the dominant class at 73.84% in the supplied 2025 summary. Water accounts for 12.35%, wetlands 10.49%, forest 2.13%, barren land 0.63%, and agriculture 0.51%. The general map also shows developed cover extending through most of the peninsula.
Why does the impervious map show a 37.00% mean when developed cover is 73.84%?
Developed land is a broad class that can contain permeable lawns, trees, landscaping, and open space along with buildings and roads. Impervious cover isolates hard surfaces such as rooftops, pavement, and parking areas. Because the two products measure different things, the countywide mean impervious value can be much lower than the developed-land share.
Does the 16.06% class difference mean that 16.06% of the county was physically changed?
No. It is the share of cells classified differently in the 1985 and 2025 comparison. The supplied summary lists 4.41% as classified to developed, 0.06% as forest loss, 0.07% as agricultural loss, and 11.09% as other difference. Classification variation may be included, so the map is a screening tool rather than proof of one physical cause.
Sources and Reference Data
- MRLC Annual NLCD Data — source data for the 2025 land-cover views and the 1985–2025 comparison.
- USGS Annual NLCD Land Cover Classification — definitions and background for developed, forest, agricultural, wetland, and other mapped classes.
- U.S. Census Bureau TIGER/Line Shapefiles — official geographic boundary reference for Pinellas County.
- Pinellas County – About Pinellas County — official geographic context for the peninsula and shoreline setting.
- Pinellas County Parks & Conservation Resources — official information about county parks, preserves, and managed natural lands.
- Pinellas County Zoning and Land Use Data — separate official planning information for zoning and land-use questions.
Map File Information
The Pinellas County package contains the four original JPG land-cover maps shown in this article.
- Included Files: Use only the versions confirmed in the article and supplied images
- File Type: Use the confirmed download contents
- Intended Use: Printing, education, presentations, and map-based projects
Related Maps
- Alachua County Florida Land Cover Map
- Baker County Florida Land Cover Map
- Bay County Florida Land Cover Map
Green Map creates custom-edited map images using open geographic data sources such as geoBoundaries, Natural Earth, OpenStreetMap, and government open data.
These maps are edited visual materials, not raw data files, and are provided for education, documents, presentations, and graphic reference.