Texas has more than 30 million residents in the supplied 2024 ACS 5-year estimates, but those residents occupy a state with an enormous land area and a highly uneven settlement pattern. Houston, Dallas–Fort Worth, Austin, and San Antonio form the four largest population systems. El Paso, the Rio Grande Valley, Corpus Christi, Laredo, Lubbock, Amarillo, and the Midland–Odessa area create additional regional centers separated by broad areas of much lower density.
The project data place the 2024 ACS population at 30,188,424. The county-density map reports about 261,259 square miles of land and a statewide average near 116 people per square mile. That average hides enormous internal differences. Harris County has the largest current population, but Dallas County has the highest county-average density. Hays County, not either of those two, recorded the fastest percentage growth from 2010 to 2020. The maps are most useful when total population, density, detailed tract settlement, and historical change remain separate measures.
Table of Contents
Census tracts reveal four dominant metro systems and several isolated regional clusters
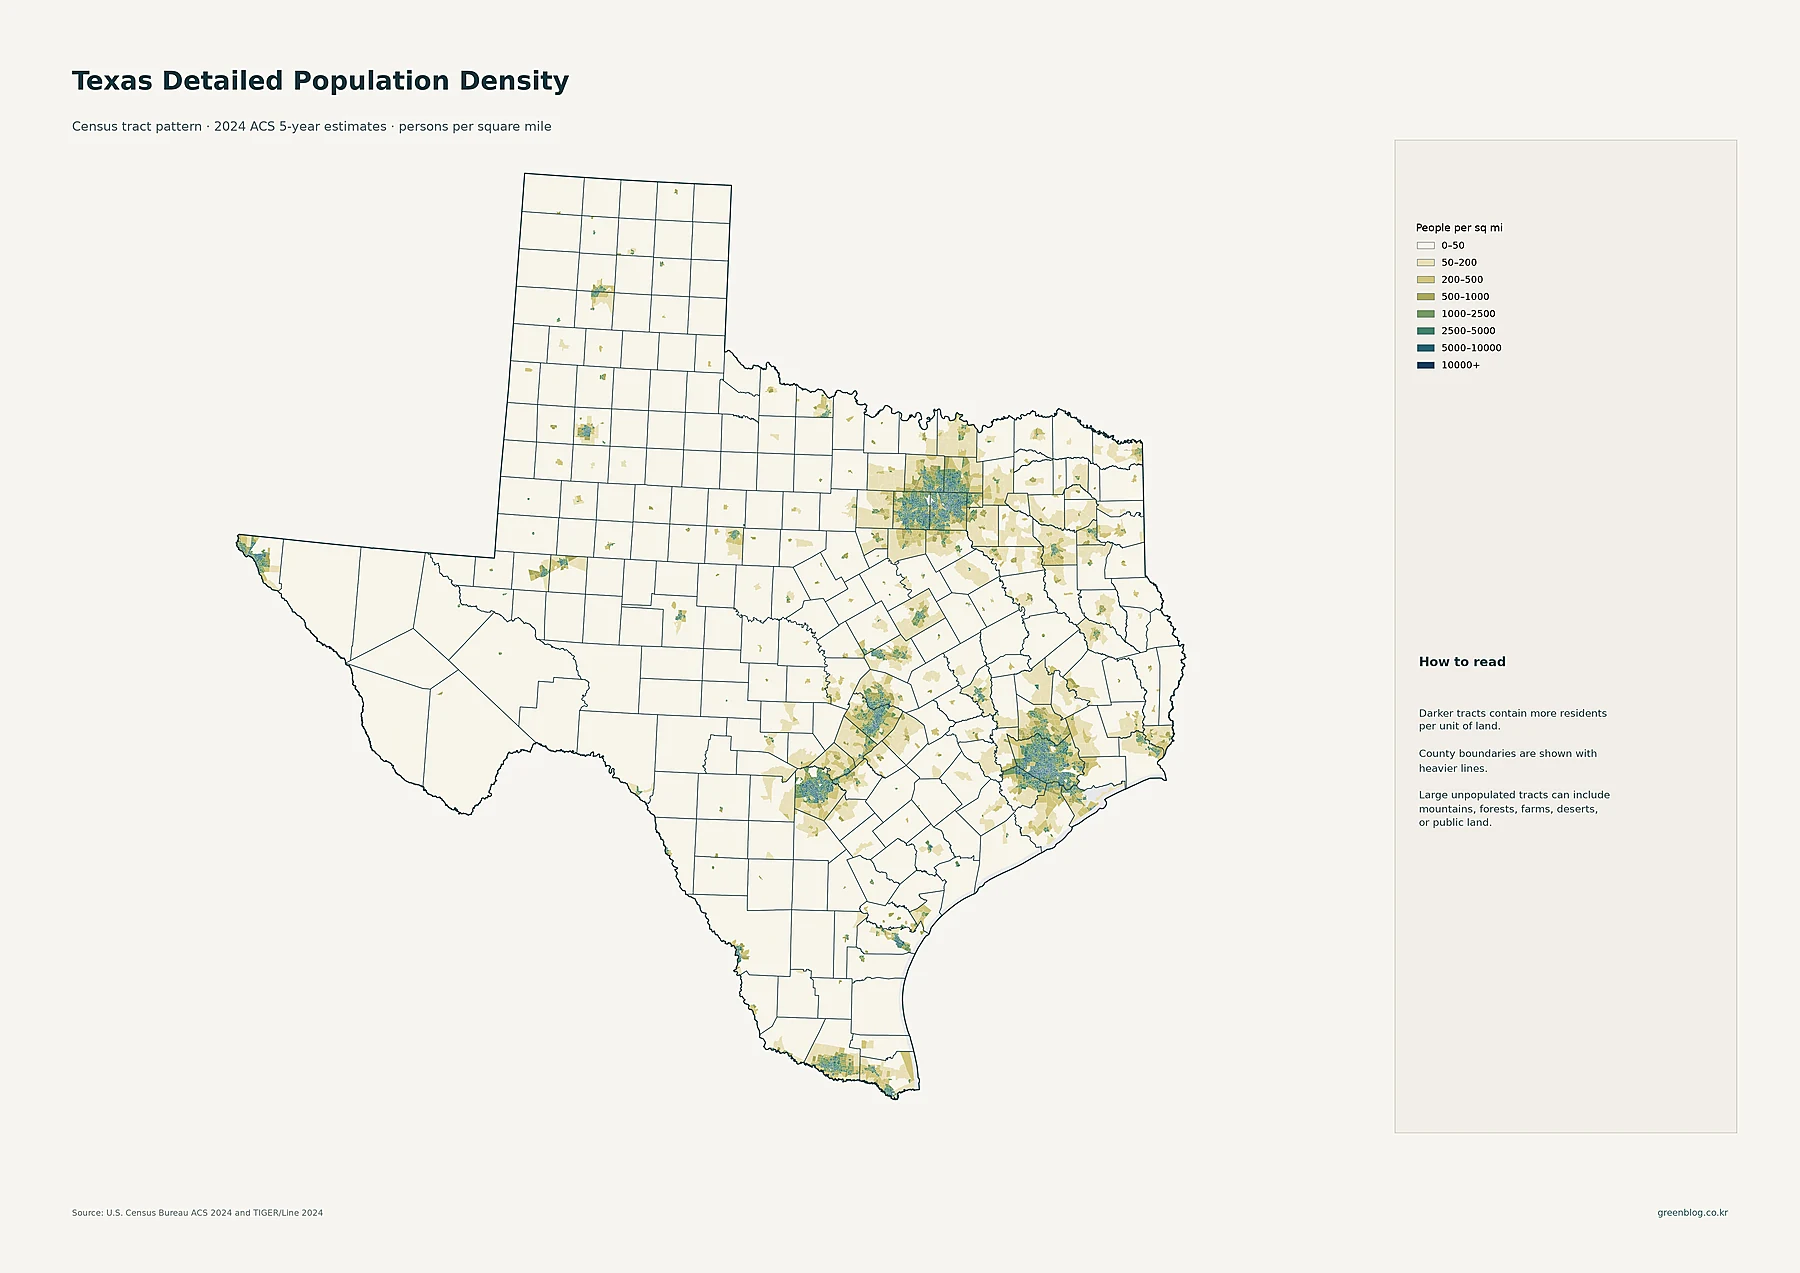
Dallas–Fort Worth forms one of the broadest connected groups of medium- and high-density tracts. Dallas and Fort Worth are joined by Arlington, Grand Prairie, Irving, and other communities, while higher-density settlement extends north through Plano, Frisco, McKinney, and Denton. The pattern crosses Dallas, Tarrant, Collin, and Denton county boundaries, showing that the region functions as a large metropolitan settlement system rather than as two isolated central cities.
The Houston area creates another exceptionally large cluster in southeast Texas. Darker tracts cover central Harris County and extend southwest into Fort Bend County, north into Montgomery County, and toward Galveston and Brazoria counties. Houston’s urban footprint therefore spreads far beyond the city boundary. The tract pattern is consistent with the strong 2010–2020 growth seen in several surrounding suburban counties.
Central Texas contains two major concentrations that are increasingly connected along the Interstate 35 corridor. Austin creates a dense core in Travis County and extends north into Williamson County and south into Hays County. San Antonio dominates Bexar County, with additional higher-density settlement extending toward Comal, Guadalupe, and Kendall counties. These counties also appear prominently on the historical growth map.
Elsewhere, El Paso forms a compact high-density cluster at the far western edge of the state. The Rio Grande Valley contains multiple concentrations around McAllen, Edinburg, Mission, Brownsville, and Harlingen. Corpus Christi and Laredo form additional southern centers. Amarillo in the Panhandle, Lubbock on the South Plains, and Midland and Odessa in the Permian Basin stand out as urban islands within much more sparsely populated surroundings.
Houston is the largest census place, followed by San Antonio and Dallas
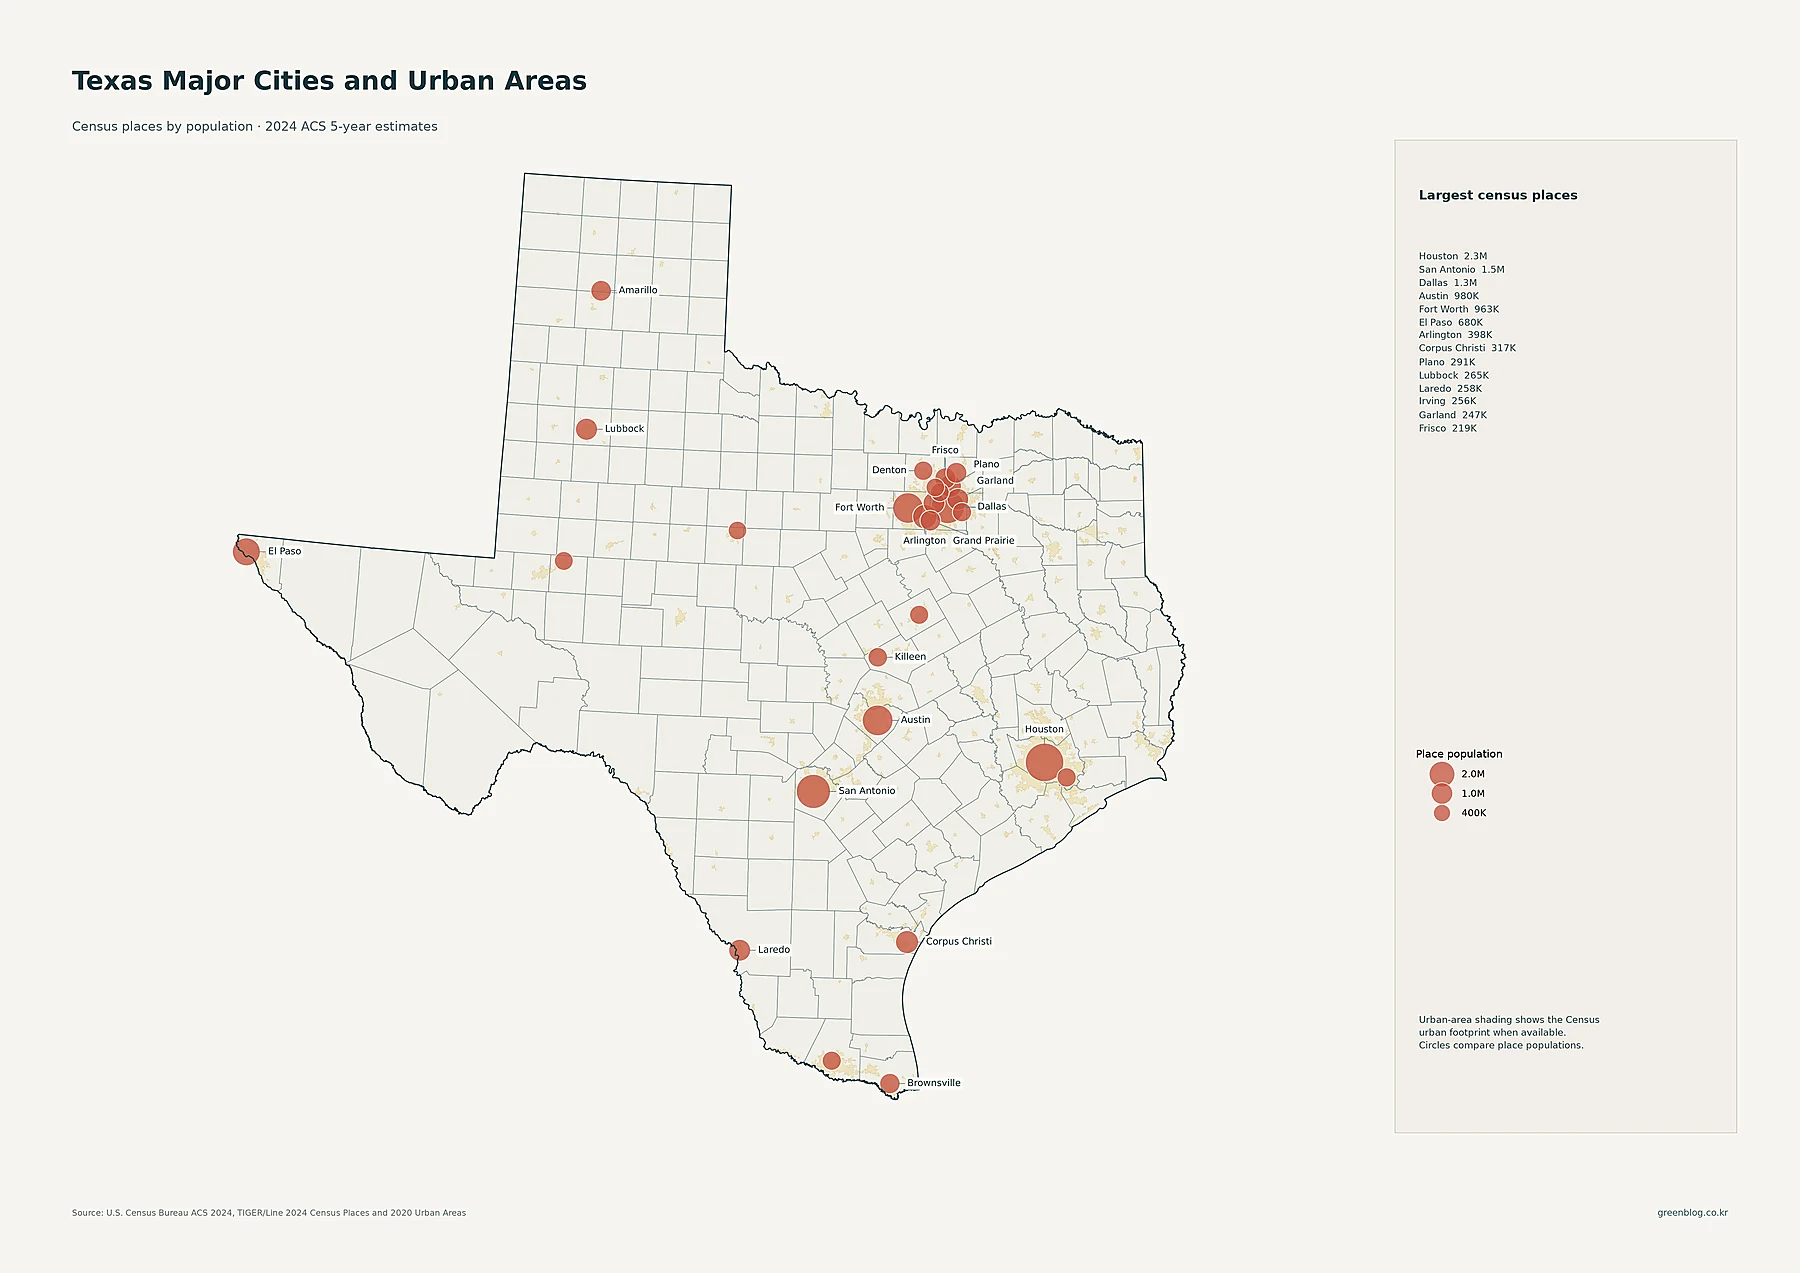
Houston has 2,328,253 residents in the supplied census-place data, making it the largest place in Texas. San Antonio follows with 1,479,835 and Dallas with 1,307,930. Austin has 979,539 residents, and Fort Worth is close behind at 963,194. El Paso has 680,130, Arlington 397,742, and Corpus Christi 317,419.
The next group includes Plano at 290,594, Lubbock at 264,814, Laredo at 257,619, Irving at 256,492, Garland at 246,844, Frisco at 219,304, and McKinney at 210,600. Amarillo has 201,885 residents and Grand Prairie 201,883, while Brownsville has 189,177. The concentration of multiple large circles around Dallas and Fort Worth is especially noticeable because several independently incorporated places are part of the same metropolitan system.
The proportional circles show total place population, not density. Houston’s large circle means the city contains more residents than any other census place shown. It does not mean Harris County has the state’s highest county density; Dallas County ranks higher on that measure. Likewise, the many separate circles around DFW appear as a much more continuous urban area on the census-tract map.
Harris County has nearly 4.84 million residents, far more than any other Texas county
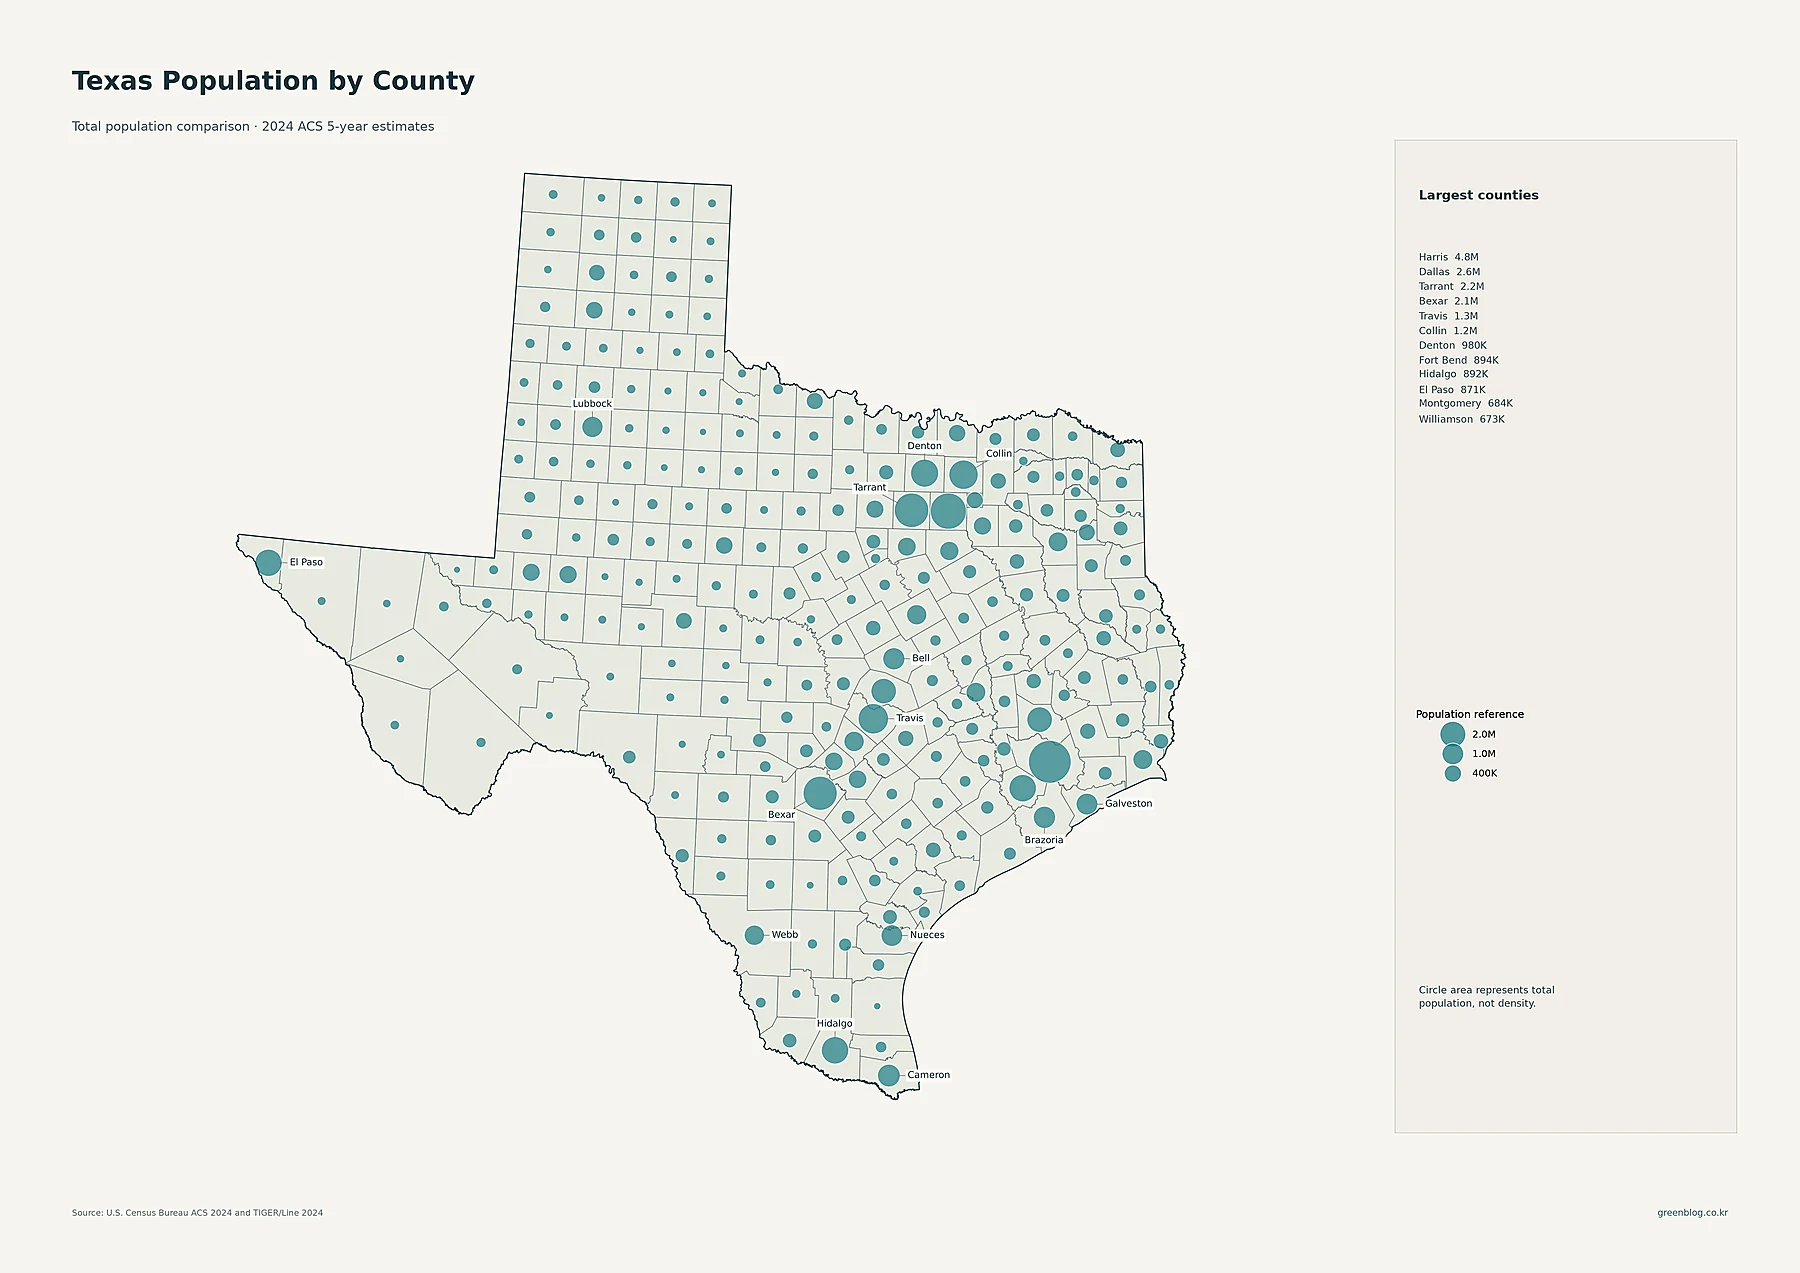
Harris County has 4,838,303 residents, making it the largest county in the supplied 2024 ACS data. Dallas County has 2,621,179, Tarrant County 2,167,390, and Bexar County 2,067,341. Travis County has 1,330,015 residents, Collin 1,163,337, Denton 979,561, Fort Bend 893,767, Hidalgo 891,977, and El Paso 870,779.
Montgomery County has 684,432 residents and Williamson County 672,688. Cameron has 426,120, Brazoria 391,255, and Bell 386,897. The large circles correspond closely to the major metro systems: Harris and surrounding counties in Houston, Dallas–Tarrant–Collin–Denton in DFW, Travis and Williamson around Austin, Bexar around San Antonio, and Hidalgo and Cameron in the Rio Grande Valley.
Texas has 254 counties, so the range between the largest and smallest totals is extraordinary. Loving County has a 2024 ACS estimate of only 33 residents, while several western and Panhandle counties contain only a few thousand people. A small population total does not automatically establish the lowest density because county land areas differ, but the total-population map makes the sheer scale of the metropolitan concentration easy to see.
Dallas County is the densest county, ahead of Harris and Tarrant
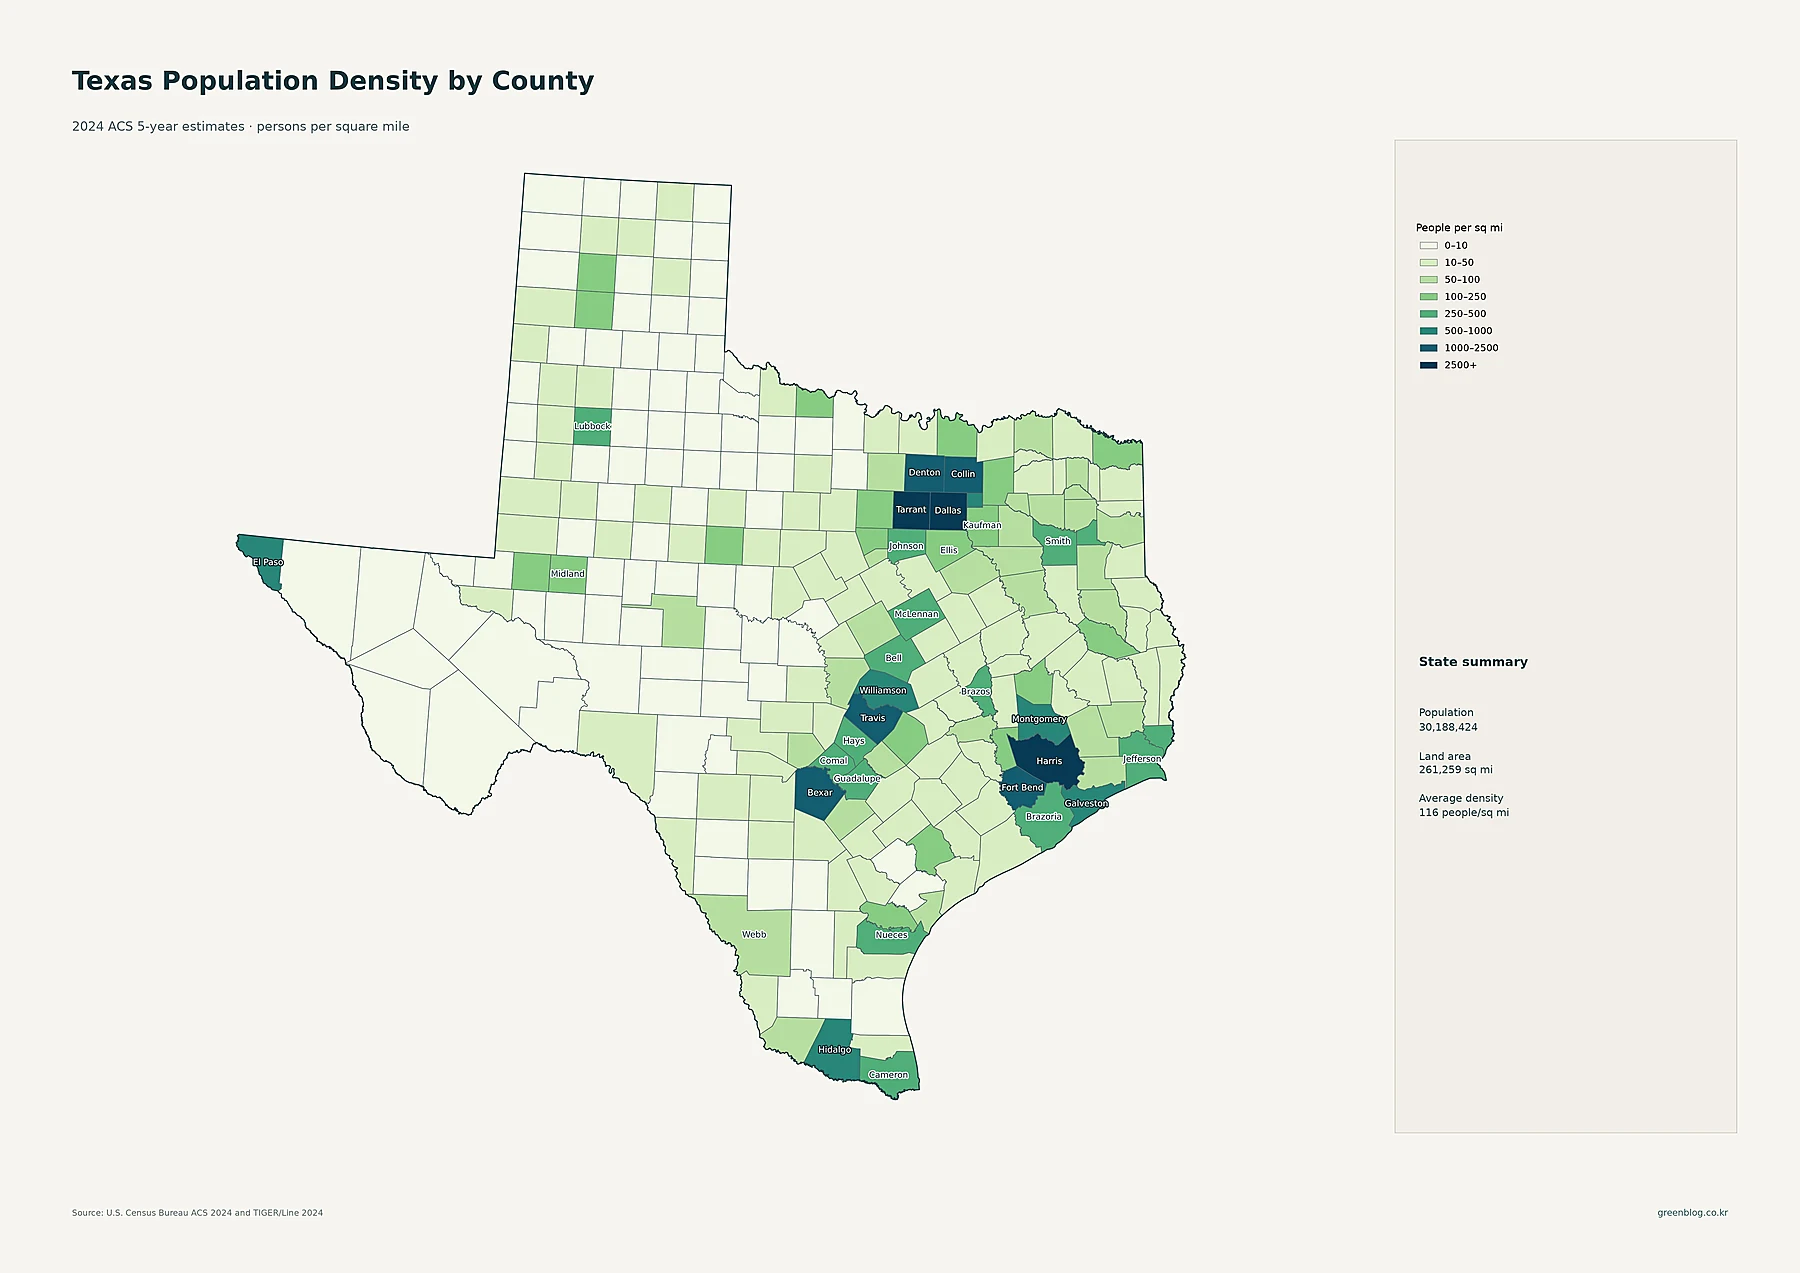
Dallas County has the highest county-average density in the supplied data at about 3,001.9 people per square mile. Harris County follows at about 2,833.9 and Tarrant County at 2,504.6. Bexar County averages about 1,666.7, Collin 1,382.7, Travis 1,337.6, Denton 1,114.7, and Fort Bend 1,037.1 people per square mile.
Rockwall County averages about 971.8 people per square mile, Galveston 946.2, and El Paso 859.2. Montgomery is about 656.7, Williamson 602.8, Hidalgo 567.7, and Cameron 477.9. The darkest county classes therefore align with the largest metro areas, although the exact ranking differs from total population. Dallas County is denser than Harris even though Harris contains more than two million additional residents.
The statewide average of roughly 116 people per square mile is much lower because Texas includes vast low-density territory in the west, Panhandle, and rural interior. Several counties average only a few people per square mile. The contrast between a 3,000-per-square-mile Dallas County and single-digit rural counties is one of the defining features of Texas population geography.
| Measure | Leading area | Value in supplied data |
|---|---|---|
| State population | Texas | 30,188,424 |
| Largest place population | Houston | 2,328,253 |
| Largest county population | Harris County | 4,838,303 |
| Highest county density | Dallas County | about 3,001.9/sq mi |
| Fastest 2010–2020 growth | Hays County | +53.4% |
| Largest 2010–2020 decline | Schleicher County | -29.2% |
The fastest 2010–2020 growth occurred along major metro fringes and the Austin–San Antonio corridor
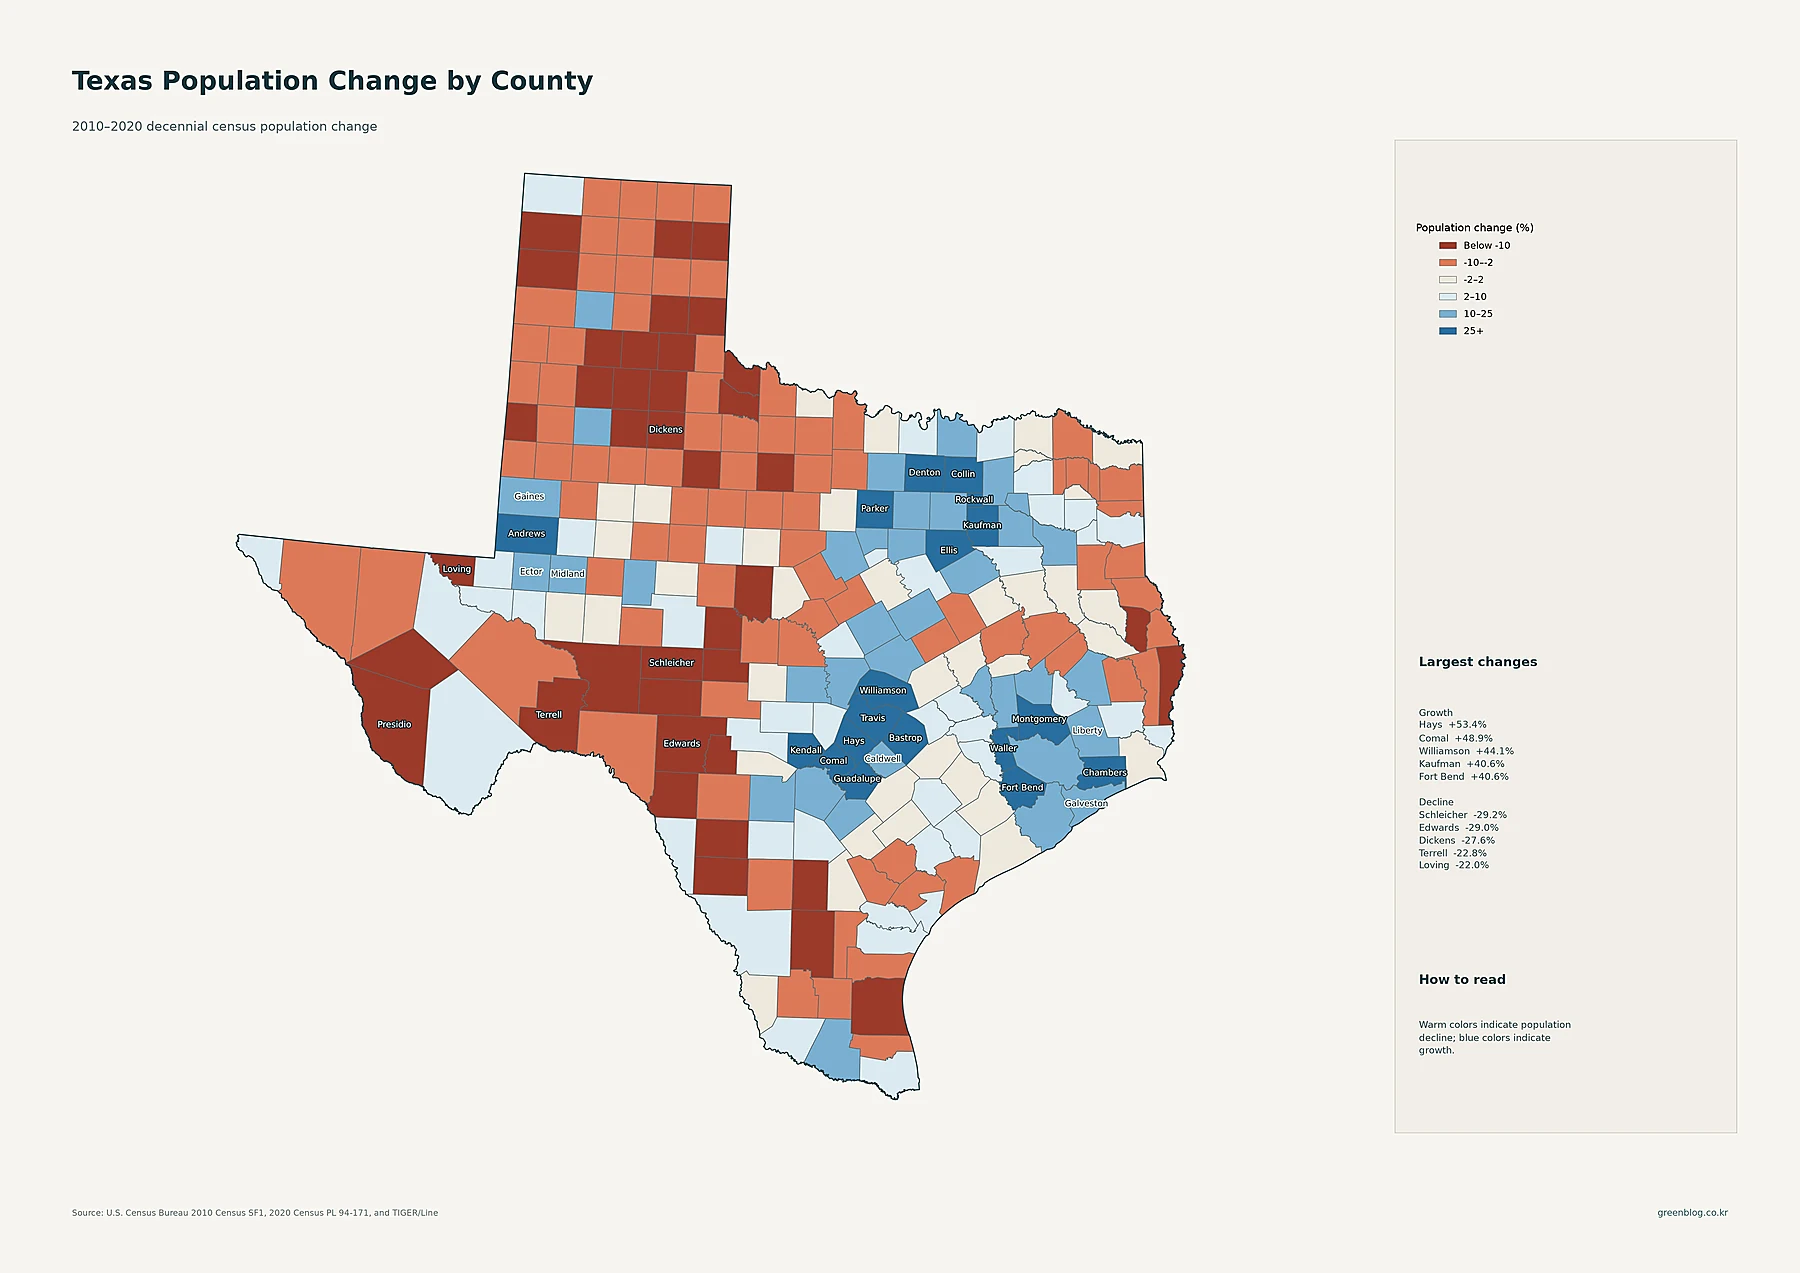
Hays County recorded the fastest percentage increase in the supplied decade data. Its population rose from 157,107 in 2010 to 241,067 in 2020, a gain of about 53.4%. Comal County grew from 108,472 to 161,501, or about 48.9%. Williamson County increased 44.1%. Kaufman and Fort Bend each grew about 40.6%.
Several other metro-fringe counties were close behind. Rockwall grew 37.6%, Denton 36.8%, Montgomery 36.1%, and Collin 36.1%. Chambers increased 32.7%, Kendall 32.5%, Waller 31.5%, Guadalupe 31.3%, Bastrop 31.1%, and Ellis 28.6%. The geography is highly consistent: Hays, Comal, Williamson, Kendall, Guadalupe, and Bastrop sit around Austin and San Antonio; Kaufman, Rockwall, Denton, Collin, and Ellis surround DFW; Fort Bend, Montgomery, Chambers, and Waller are part of the broader Houston region.
The large core counties also grew, but generally at slower percentage rates than their suburban neighbors. Travis County increased about 26.0%, Bexar 17.2%, Tarrant 16.7%, and Harris 15.6%. This distinction matters because current size and growth speed are not the same thing. Harris has the largest current county population, yet Hays grew more than three times as fast in percentage terms during the 2010s.
Declines were concentrated in many smaller rural counties, especially in the west and Panhandle. Schleicher County fell from 3,461 residents in 2010 to 2,451 in 2020, a decrease of about 29.2%. Edwards declined 29.0%, Dickens 27.6%, Terrell 22.8%, Loving 22.0%, and Presidio 21.6%. Concho, Cochran, Sutton, Foard, Zavala, Crockett, Real, and Duval also posted substantial declines.
These percentages belong specifically to the 2010–2020 decennial-census period. They should not be presented as 2024 ACS changes. The 2024 maps describe current estimated population and density, while the change map describes the direction and scale of county population change during the previous census decade.
Texas combines enormous metro populations, fast suburban expansion, and vast sparse regions
The full map set shows a state whose current population is dominated by four large metro systems. Houston is the largest census place and Harris County has the largest county population. Dallas County, however, has the highest county-average density. DFW also contains several large cities and some of the fastest-growing suburban counties, including Collin, Denton, Rockwall, and Kaufman.
Central Texas adds another major growth pattern. Williamson and Hays around Austin and Comal and Guadalupe toward San Antonio grew rapidly during the 2010s, strengthening the Interstate 35 corridor. Around Houston, Fort Bend and Montgomery posted very large gains. El Paso and the Rio Grande Valley remain major population centers in their own right, while Corpus Christi, Laredo, Lubbock, Amarillo, and Midland–Odessa organize other regions of the state.
At the same time, broad parts of western Texas, the Panhandle, and the rural interior remain extremely sparse, and numerous small counties lost population during the 2010s. The most accurate way to read Texas is therefore to keep place totals, county totals, county density, tract-level density, and historical change separate. Together, the layers explain where Texans live today, how concentrated those settlements are, and which areas changed most rapidly during the decade.
Download the Texas population map collection
The ZIP includes detailed census-tract density, major cities and urban areas, county population totals, 2010–2020 county population change, and county population density.
FAQ
Which Texas county has the largest population?
Harris County is the largest in the supplied 2024 ACS 5-year estimates, with 4,838,303 residents. Dallas County has 2,621,179 and Tarrant County 2,167,390.
Which Texas county has the highest population density?
Dallas County has the highest county-average density at about 3,001.9 people per square mile. Harris County is about 2,833.9 and Tarrant County about 2,504.6 people per square mile.
Which Texas county grew fastest from 2010 to 2020?
Hays County grew about 53.4%, followed by Comal at 48.9%, Williamson at 44.1%, and Kaufman and Fort Bend at about 40.6%. These percentages compare the 2010 and 2020 decennial censuses.
Related Maps
Sources
- U.S. Census Bureau — American Community Survey (ACS): 2024 5-year population and density estimates
- U.S. Census Bureau — TIGER/Line Shapefiles: 2024 state, county, census tract, and census place boundaries
- U.S. Census Bureau — Decennial Census: 2010 and 2020 county population comparison
Green Map creates custom-edited map images using open geographic data sources such as geoBoundaries, Natural Earth, OpenStreetMap, and government open data. These maps are edited visual materials, not raw data files, and are provided for education, documents, presentations, and graphic reference.