Logan County, Illinois is overwhelmingly agricultural in the 2025 land-cover data. Agriculture accounts for 88.90% of the county, while the largest concentration of developed land sits around Lincoln and smaller built-up areas remain scattered across a broad farm landscape. The four maps on this page separate those patterns into general land cover, forest and farmland, impervious surface, and mapped class differences between 1985 and 2025.
The four original JPG maps are also available together in one ZIP file for printing, offline reference, or side-by-side comparison. Each view answers a different practical question, so it is useful to start with the county-wide pattern and then move to the specialized maps. Land cover describes what is physically on the ground, such as crops, trees, water, wetlands, and developed surfaces; it does not establish zoning, property ownership, or development rights.
Table of Contents
A farm-dominant county with small but distinct breaks in the pattern
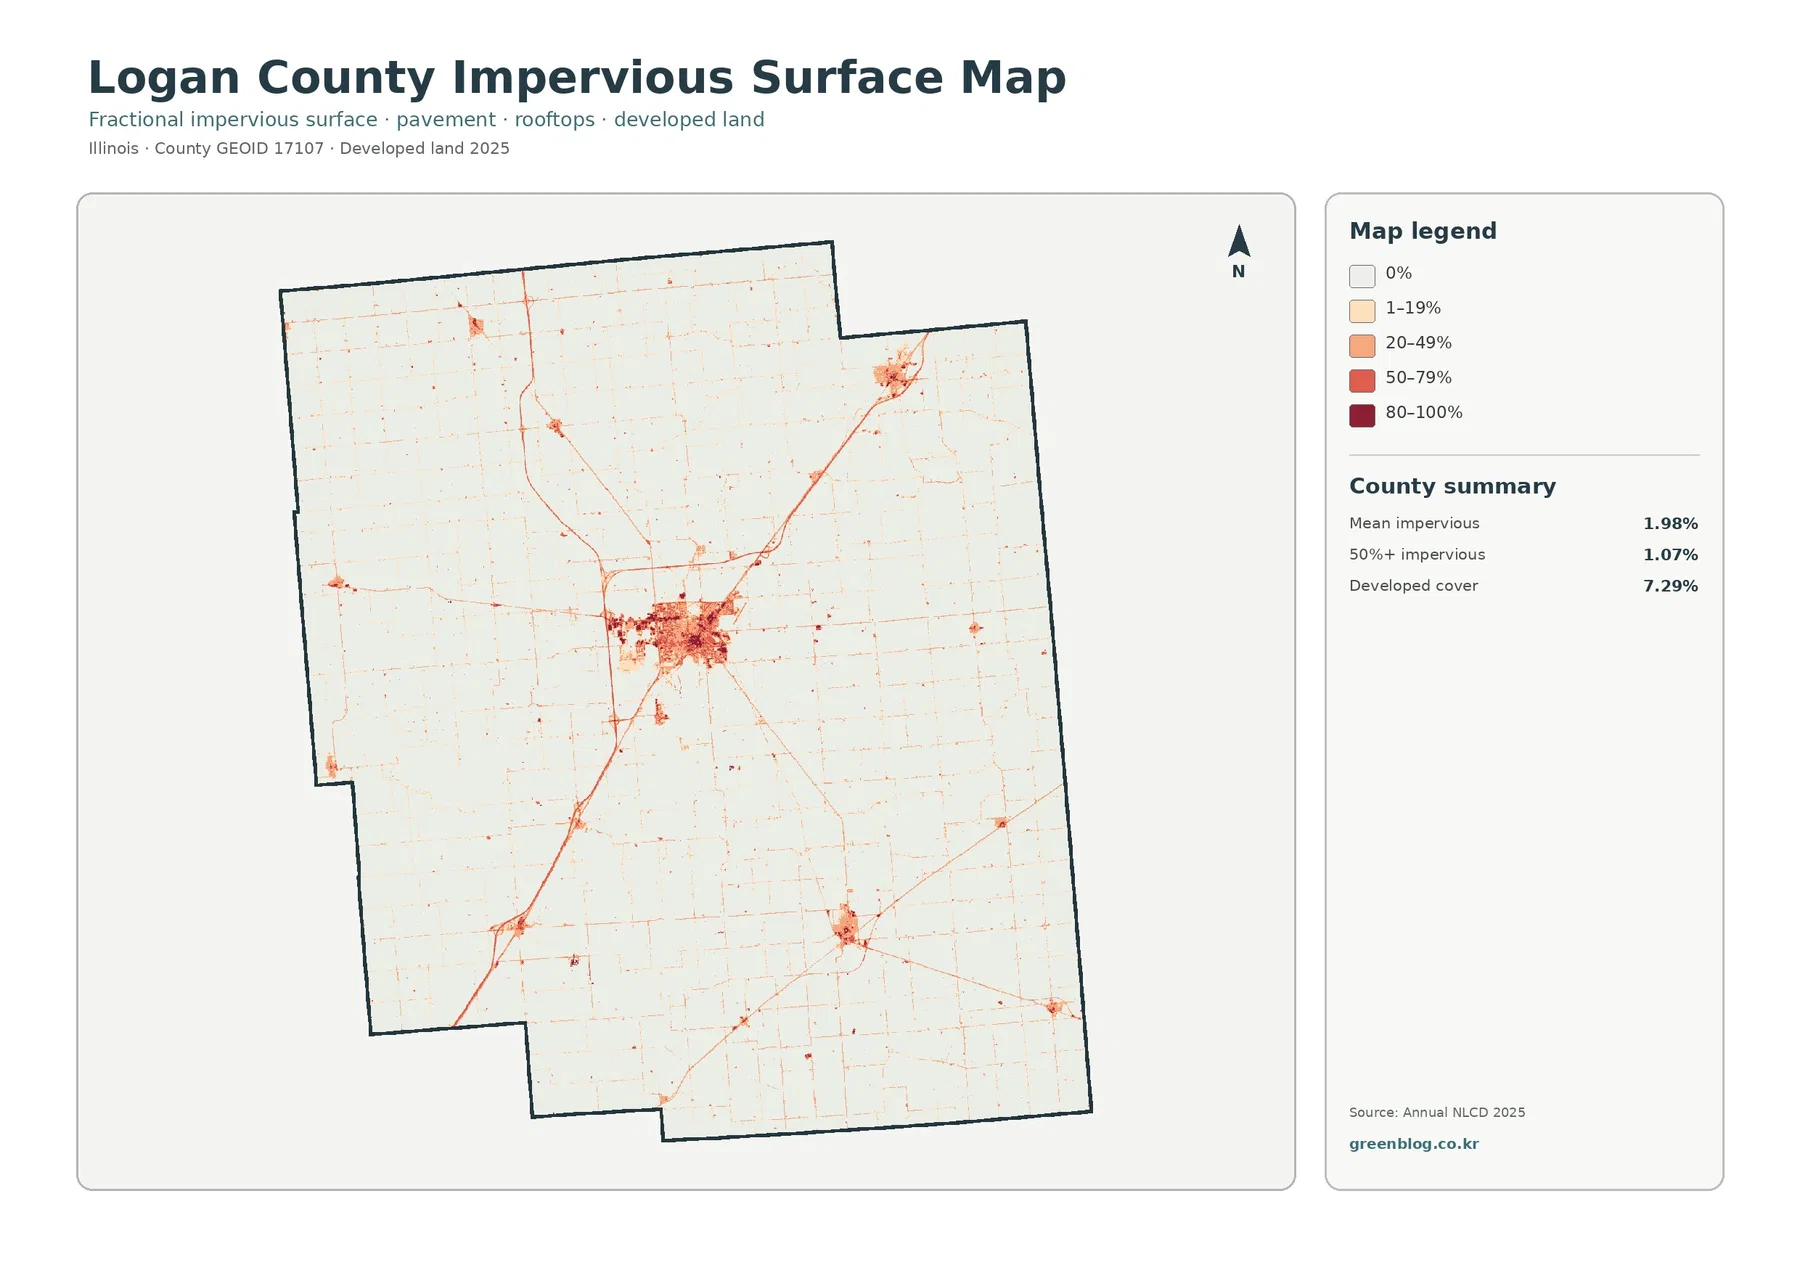
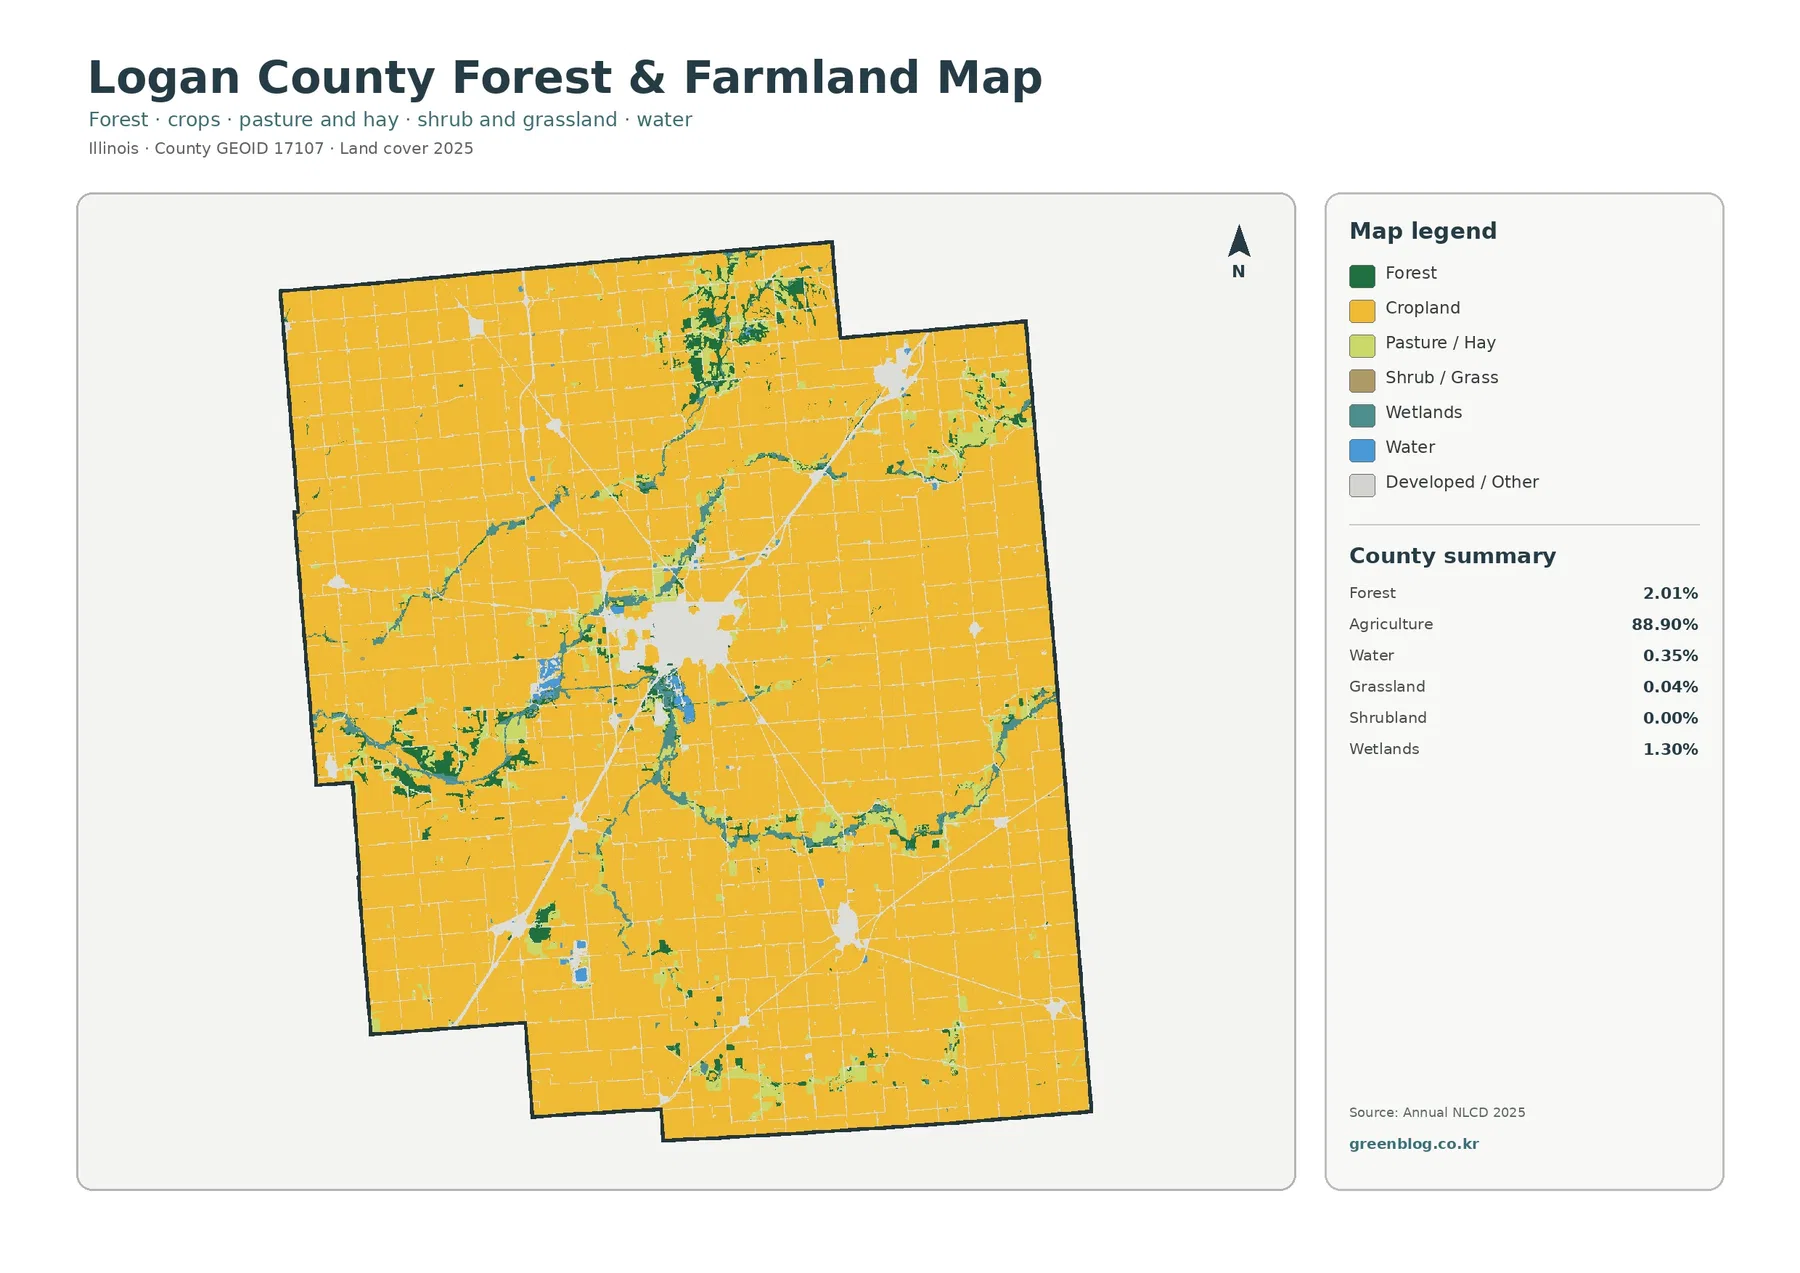
The general land-cover map is dominated by the yellow agriculture class from the northern edge of Logan County to the southern boundary. That continuous field pattern is the best starting point for reading the county. Red developed areas, dark green forest, teal wetlands, and blue water occupy much smaller portions of the map, but their shapes make them easy to locate because they interrupt an otherwise broad agricultural background.
Logan County’s official website describes the county as a rural community between Bloomington and Springfield, with productive farmland and several small communities. That local description is separate from the NLCD classification, but it provides useful context for the map’s strong agricultural signal. The agriculture class should not be read as a crop inventory, however. The map does not identify individual fields as corn, soybeans, hay, or another crop; it groups land into broader cover categories at the county scale.
The impervious view separates Lincoln’s core from the surrounding farm grid
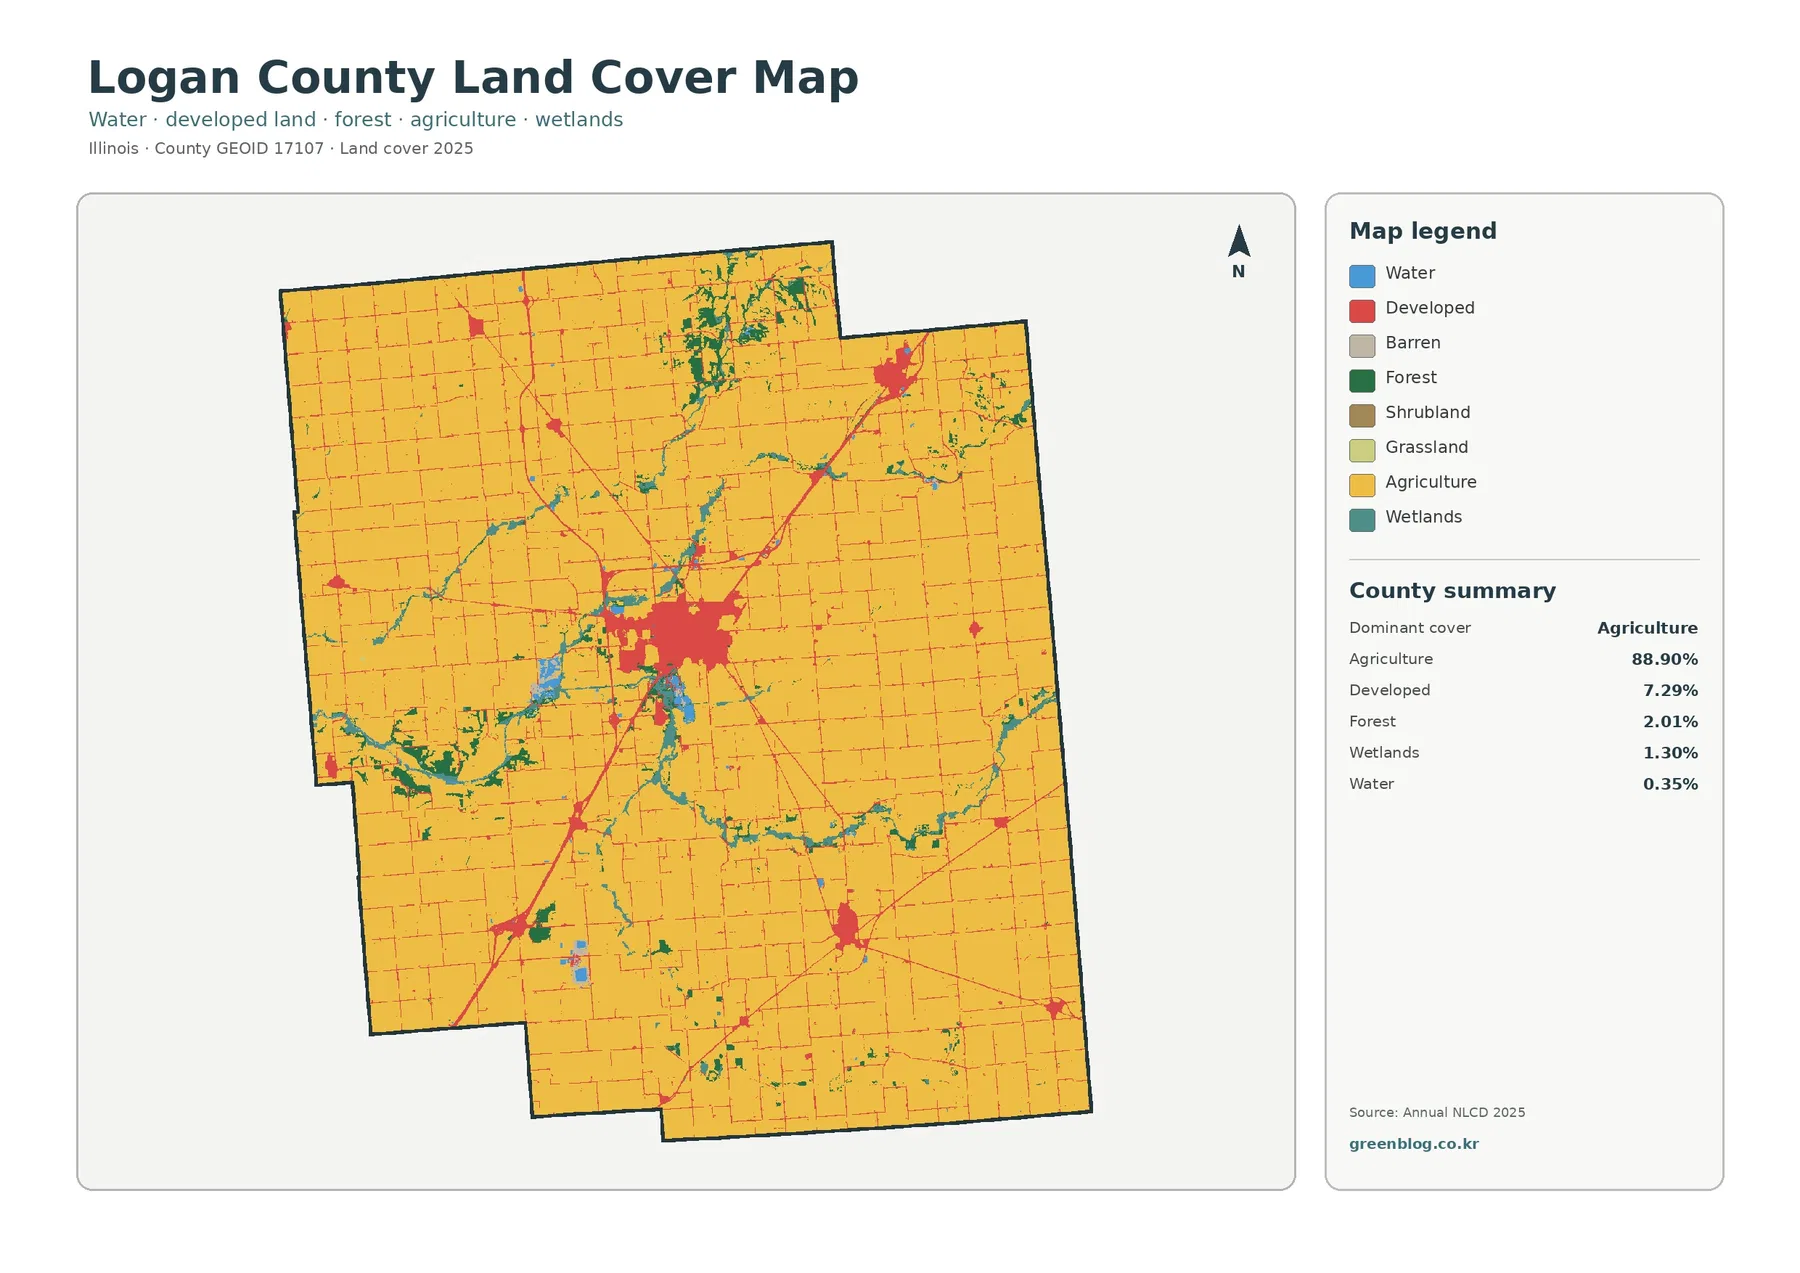
Impervious surface means pavement, rooftops, parking areas, and other hard surfaces that allow little water to soak directly into the ground. The impervious map uses percentage classes rather than the broad developed-land category. As a result, the agricultural countryside fades to very light tones while streets, town centers, and larger built-up areas appear in stronger orange and red. It is especially useful in Logan County because the county-wide average is low but the local concentrations are sharp.
Lincoln forms the largest and darkest cluster near the center of the county. Within that cluster, some blocks have much higher impervious values than the edges, and thin linear features extend outward along major transportation routes. Smaller clusters are visible toward the northeast, southeast, and other parts of the county. The map does not prove that a particular road caused development, but it clearly shows that higher impervious values and established settlement corridors occupy many of the same locations.
The summary gives a mean impervious value of 1.98% for the county. Areas above 50% impervious account for 1.07%, while the separate developed-cover figure is 7.29%. These numbers are not supposed to match. A developed NLCD cell can include grass, trees, bare ground, and other permeable surfaces mixed with buildings or pavement, while the impervious layer estimates the hard-surface share of the cell itself. The two maps describe related conditions from different angles.
Forest and wetlands appear as branching corridors rather than a large wooded block
The forest-and-farmland map removes much of the detail associated with developed classes and makes the contrast between cropland and natural cover easier to follow. Cropland still fills nearly the entire county, but green forest and teal wetland patches form recognizable branches through the agricultural matrix. The most noticeable concentrations occur in the north-central area and along sinuous corridors that enter from the west and southwest before continuing across the middle and lower parts of the county.
Forest accounts for 2.01% of Logan County, so the map does not show an extensive continuous woodland. Much of the green appears in narrow belts, small patches, or groups of connected patches near drainage features. Wetlands cover 1.30% and frequently occur near those same corridors, although the two classes are not interchangeable. Forest identifies tree-dominated cover, while wetlands identify areas characterized by water-influenced soils and vegetation under the classification system.
Most of the 1985–2025 comparison stays quiet, with change concentrated in small areas
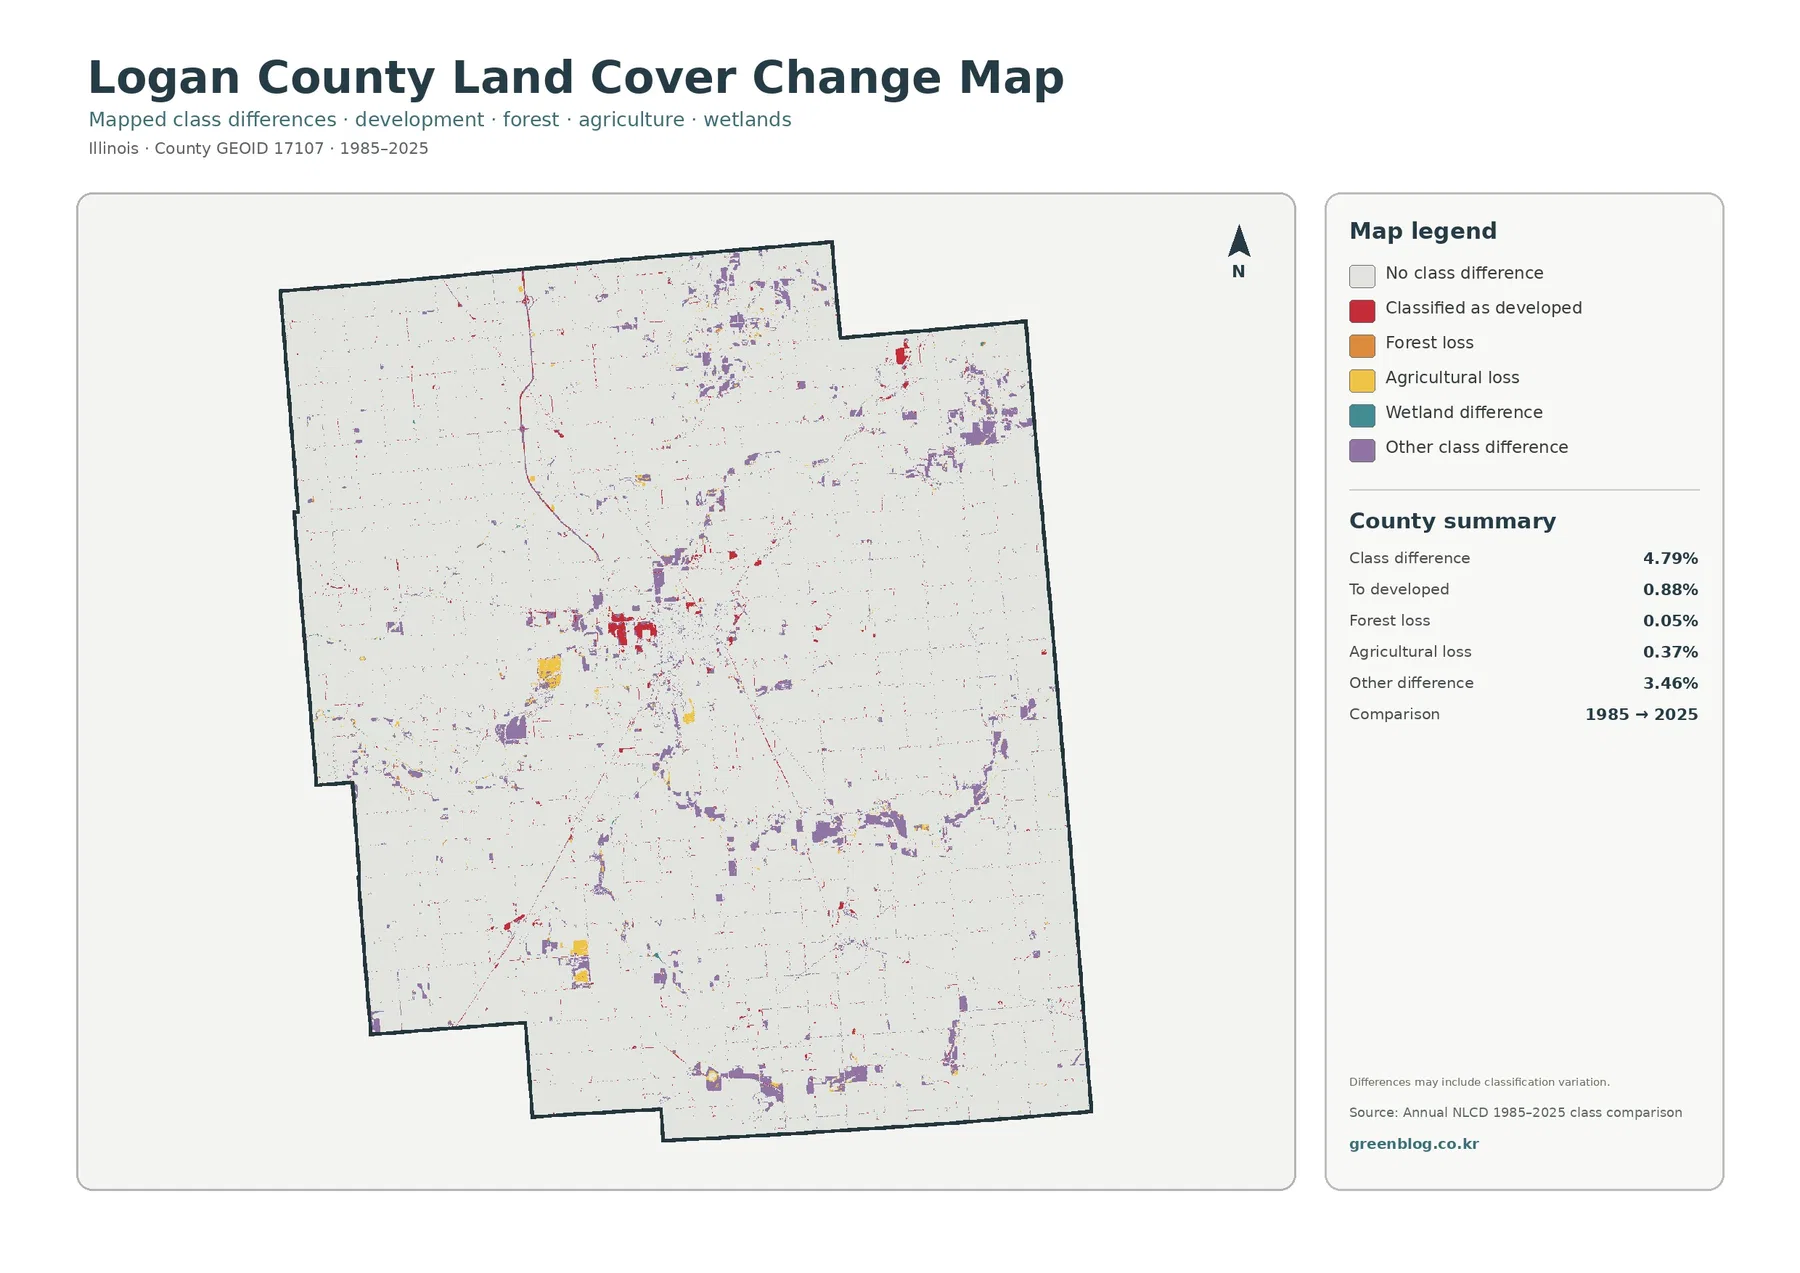
The change map compares mapped classes from 1985 with those from 2025. Most of Logan County remains in the pale no-difference background, while colored cells appear as scattered points, narrow lines, and small clusters. Red marks locations classified as developed in the later comparison, yellow identifies agricultural loss, orange marks forest loss, teal identifies wetland differences, and purple covers other class differences. The pattern is dispersed rather than a single broad conversion zone.
The summary reports a total class difference of 4.79%. Within the listed categories, 0.88% is mapped as a change to developed, 0.05% as forest loss, 0.37% as agricultural loss, and 3.46% as other difference. Red cells are visible around Lincoln and in smaller settlement or transportation-related clusters, but the map does not contain permits, construction dates, or project histories. A color change tells us that the two mapped classifications differ, not why the change happened.
Four views are more useful when the same location is checked across them
At Lincoln, the general map answers the simplest question: where is the largest developed area within the agricultural county? The impervious layer then shows that the urban area is not internally uniform, with stronger hard-surface values in the center and along major streets or routes. The forest-and-farmland view makes nearby non-agricultural natural cover easier to see, while the change map highlights only places where the 1985 and 2025 classes differ. Looking at all four prevents one layer from being asked to do a job it was not designed to do.
Use the maps for county-scale context, not parcel-level decisions
Annual NLCD is a raster product, meaning the landscape is represented by a grid of cells rather than legal parcels. With the commonly used 30-meter grid, a single cell can contain a road edge, grass, crops, trees, or part of a building at the same time. The classification assigns a representative condition or percentage to that cell. Narrow features can therefore look wider, narrower, or less continuous than they do on high-resolution aerial photography.
The date is another important limit. The main land-cover, forest-and-farmland, and impervious views are based on 2025 data as shown on the supplied maps. Development or land-cover changes after that observation period will not appear. The change map is also a two-date comparison rather than a year-by-year history, so it cannot tell the exact year in which a cell changed or whether it changed more than once between 1985 and 2025.
Choosing the JPG map that fits the task
If you need a single image that explains Logan County at a glance, start with the general land-cover map. For a cleaner agriculture-versus-natural-cover comparison, the forest-and-farmland map removes much of the developed-class detail. The impervious map is the better choice when the focus is Lincoln, smaller settlement centers, roads, pavement, or rooftops. Use the change map when the question is where the 1985 and 2025 classifications differ.
Frequently Asked Questions
What is the dominant land cover in Logan County?
Agriculture is the dominant 2025 class at 88.90%. Developed land accounts for 7.29%, forest 2.01%, wetlands 1.30%, and water 0.35%. This is why the county appears primarily agricultural at small scale even though Lincoln, smaller communities, and natural corridors remain clearly visible.
Why is 7.29% developed land different from the 1.98% mean impervious value?
They measure different things. The developed land-cover class can include a mixture of pavement, buildings, grass, trees, and other surfaces within developed settings. The impervious layer estimates the share of hard surface within each cell. A place can therefore be classified as developed without being mostly pavement or rooftops.
Does the 4.79% class difference mean that 4.79% of the county was physically converted after 1985?
No. The 4.79% figure represents locations where the mapped 1985 and 2025 classes differ. The map notes that classification variation can contribute to those differences. Confirming an actual conversion, its date, and its cause requires additional evidence such as historical aerial imagery and local planning or permit records.
Sources and Reference Material
The interpretation above uses the supplied Annual NLCD 2025-based maps together with official references for land-cover classification, boundary data, and Logan County context.
- MRLC Annual NLCD Data – access to Annual NLCD products and data resources
- USGS Annual NLCD Land Cover Classification – land-cover classes and interpretation guidance
- U.S. Census Bureau TIGER/Line Shapefiles – county boundaries and geographic reference data
- Logan County, Illinois Official Website – official local context on the county, its communities, and agricultural setting
Map File Information
The ZIP package contains four original JPG maps for Logan County: general land cover, forest and farmland, impervious surface and developed land, and mapped land-cover change from 1985 to 2025.
- Included Versions: Land cover / Forest & farmland / Impervious & developed land / Land-cover change
- File Type: ZIP containing four JPG maps
Related Maps
- Adams County Illinois Land Cover Map
- Alexander County Illinois Land Cover Map
- Bond County Illinois Land Cover Map
Green Map creates custom-edited map images using open geographic data sources such as geoBoundaries, Natural Earth, OpenStreetMap, and government open data. These maps are edited visual materials, not raw data files, and are provided for education, documents, presentations, and graphic reference.