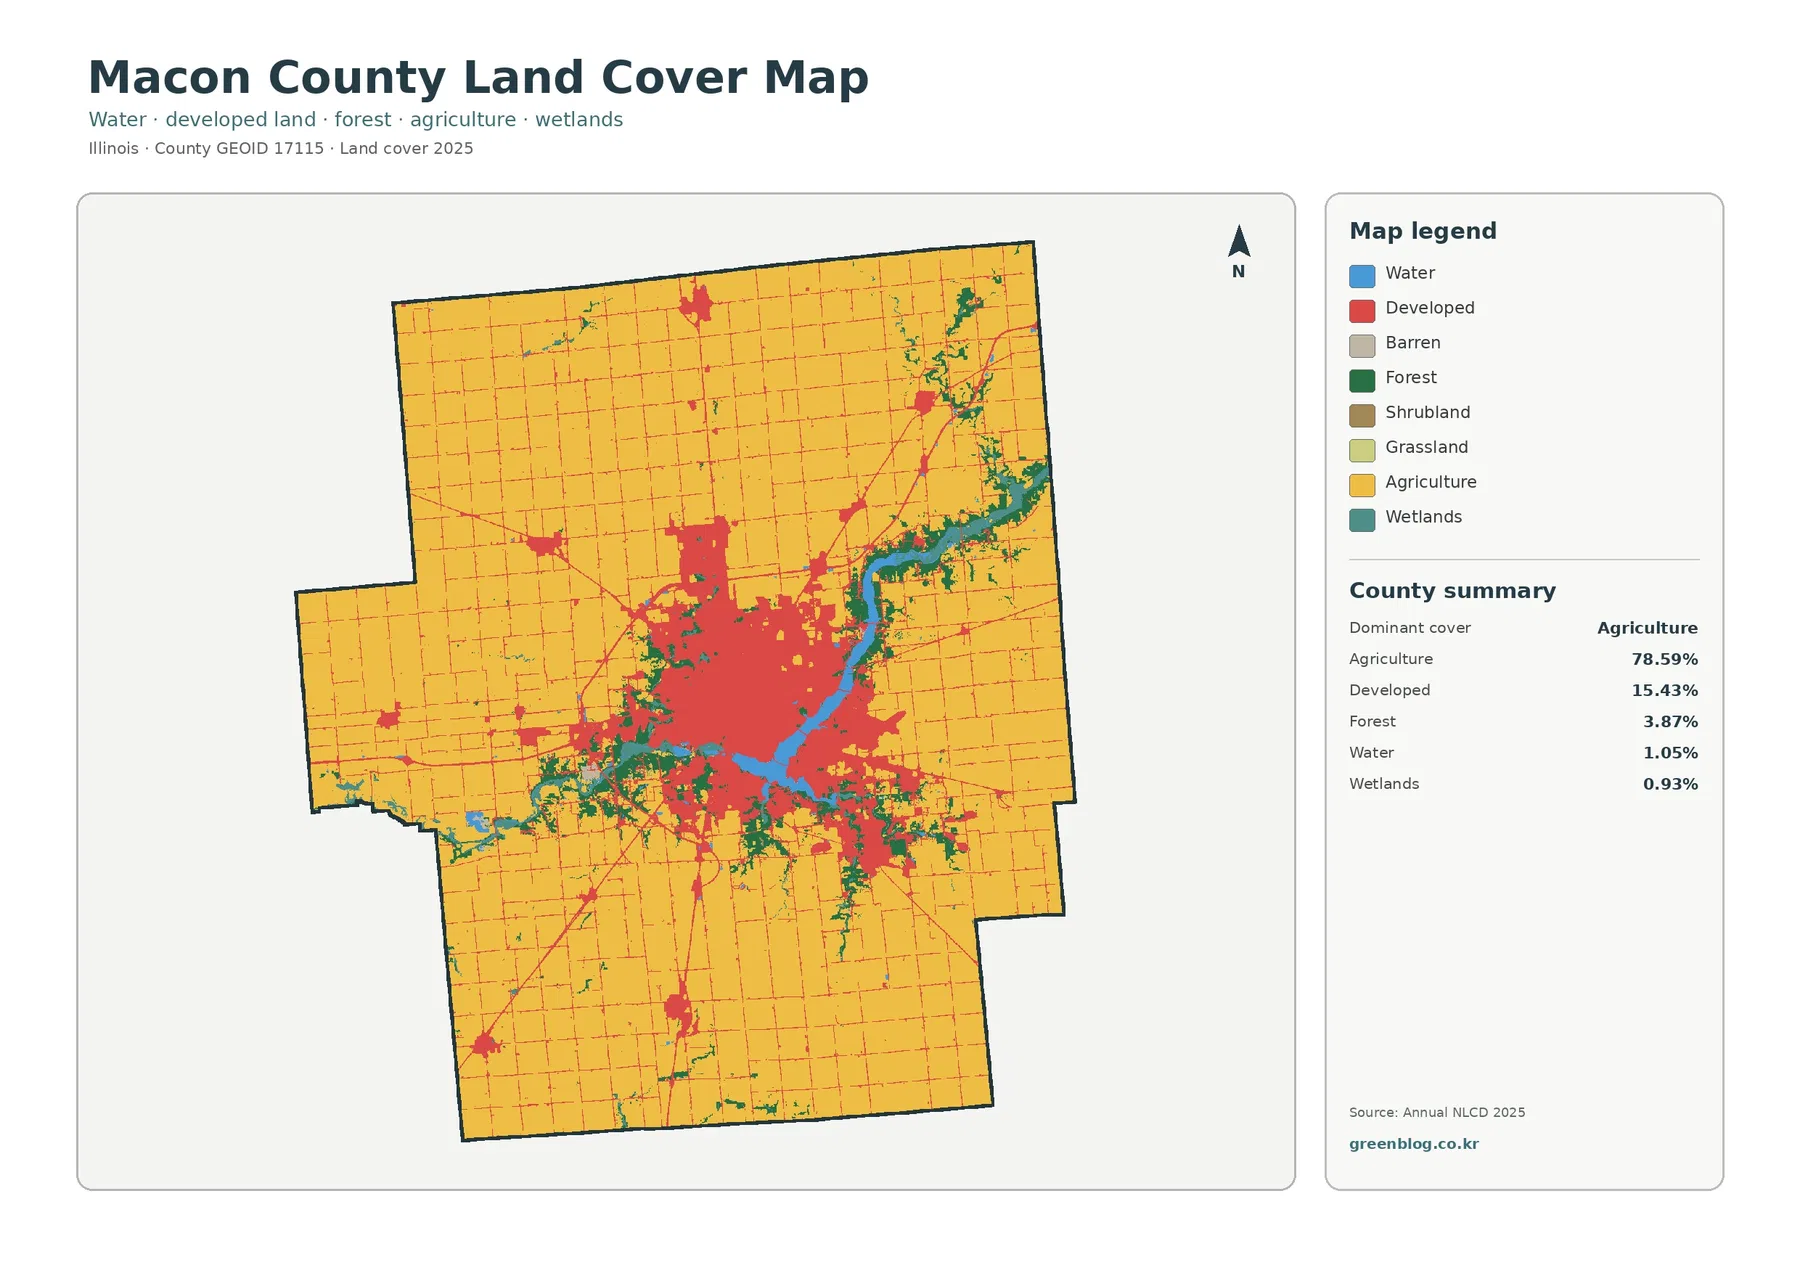
Macon County’s 2025 land-cover pattern is dominated by agriculture, but the county does not read as one uninterrupted farm landscape. A large developed cluster around Decatur sits near the center, while Lake Decatur extends east and northeast through a corridor where water, forest, and wetlands break up the surrounding cropland. The four maps on this page let you compare the overall land-cover classes, forest and farmland, impervious surface, and mapped class differences between 1985 and 2025.
The same four maps are also available as original JPG files in one ZIP download. Use the general map when you need the county-wide pattern, the forest-and-farmland view when you want to isolate green and agricultural cover, the impervious map for paved and built surfaces, and the change map when you need to locate cells classified differently in 1985 and 2025. Land cover describes what is physically covering the ground; it is not a zoning map, property map, ownership record, or statement about development rights.
Table of Contents
Decatur stands out inside a county that is 78.59% agricultural
The broadest feature on the general land-cover map is the yellow agricultural class. It covers most of the county north, west, and south of Decatur and reaches close to the edge of the developed area. The county summary gives agriculture a 78.59% share, which matches the visual impression of a large farm matrix interrupted by towns, roads, water, and narrow natural corridors. The agricultural area is not shown as one crop type or one ownership pattern; it is a broad land-cover category that combines the agricultural classes represented in the source data.
Developed land accounts for 15.43%, making it the clear second-largest category in the summary. Most of the red cover is concentrated in the central Decatur area, where a large urban shape contrasts sharply with the surrounding fields. Smaller red patches and thin lines appear away from the core, often where roads and smaller settlements cut through the agricultural background. This general map is useful for locating developed land, but it does not show how much of each developed cell is actually roof, pavement, parking area, lawn, or tree cover. The impervious-surface map provides that second layer of detail.
Forest covers 3.87%, water 1.05%, and wetlands 0.93%. Those values are small compared with agriculture and development, yet their shapes are important. Green and blue-green classes form narrow bands along drainage corridors, and the most obvious water body is the long, branching lake east of the central city. Forest and wetland cover also appears south and southwest of Decatur along smaller channels. A percentage table alone can make these classes seem minor, while the map shows that they repeatedly mark the boundaries between fields, water, and built land.
Impervious surface separates the dense urban core from its lower-density edges
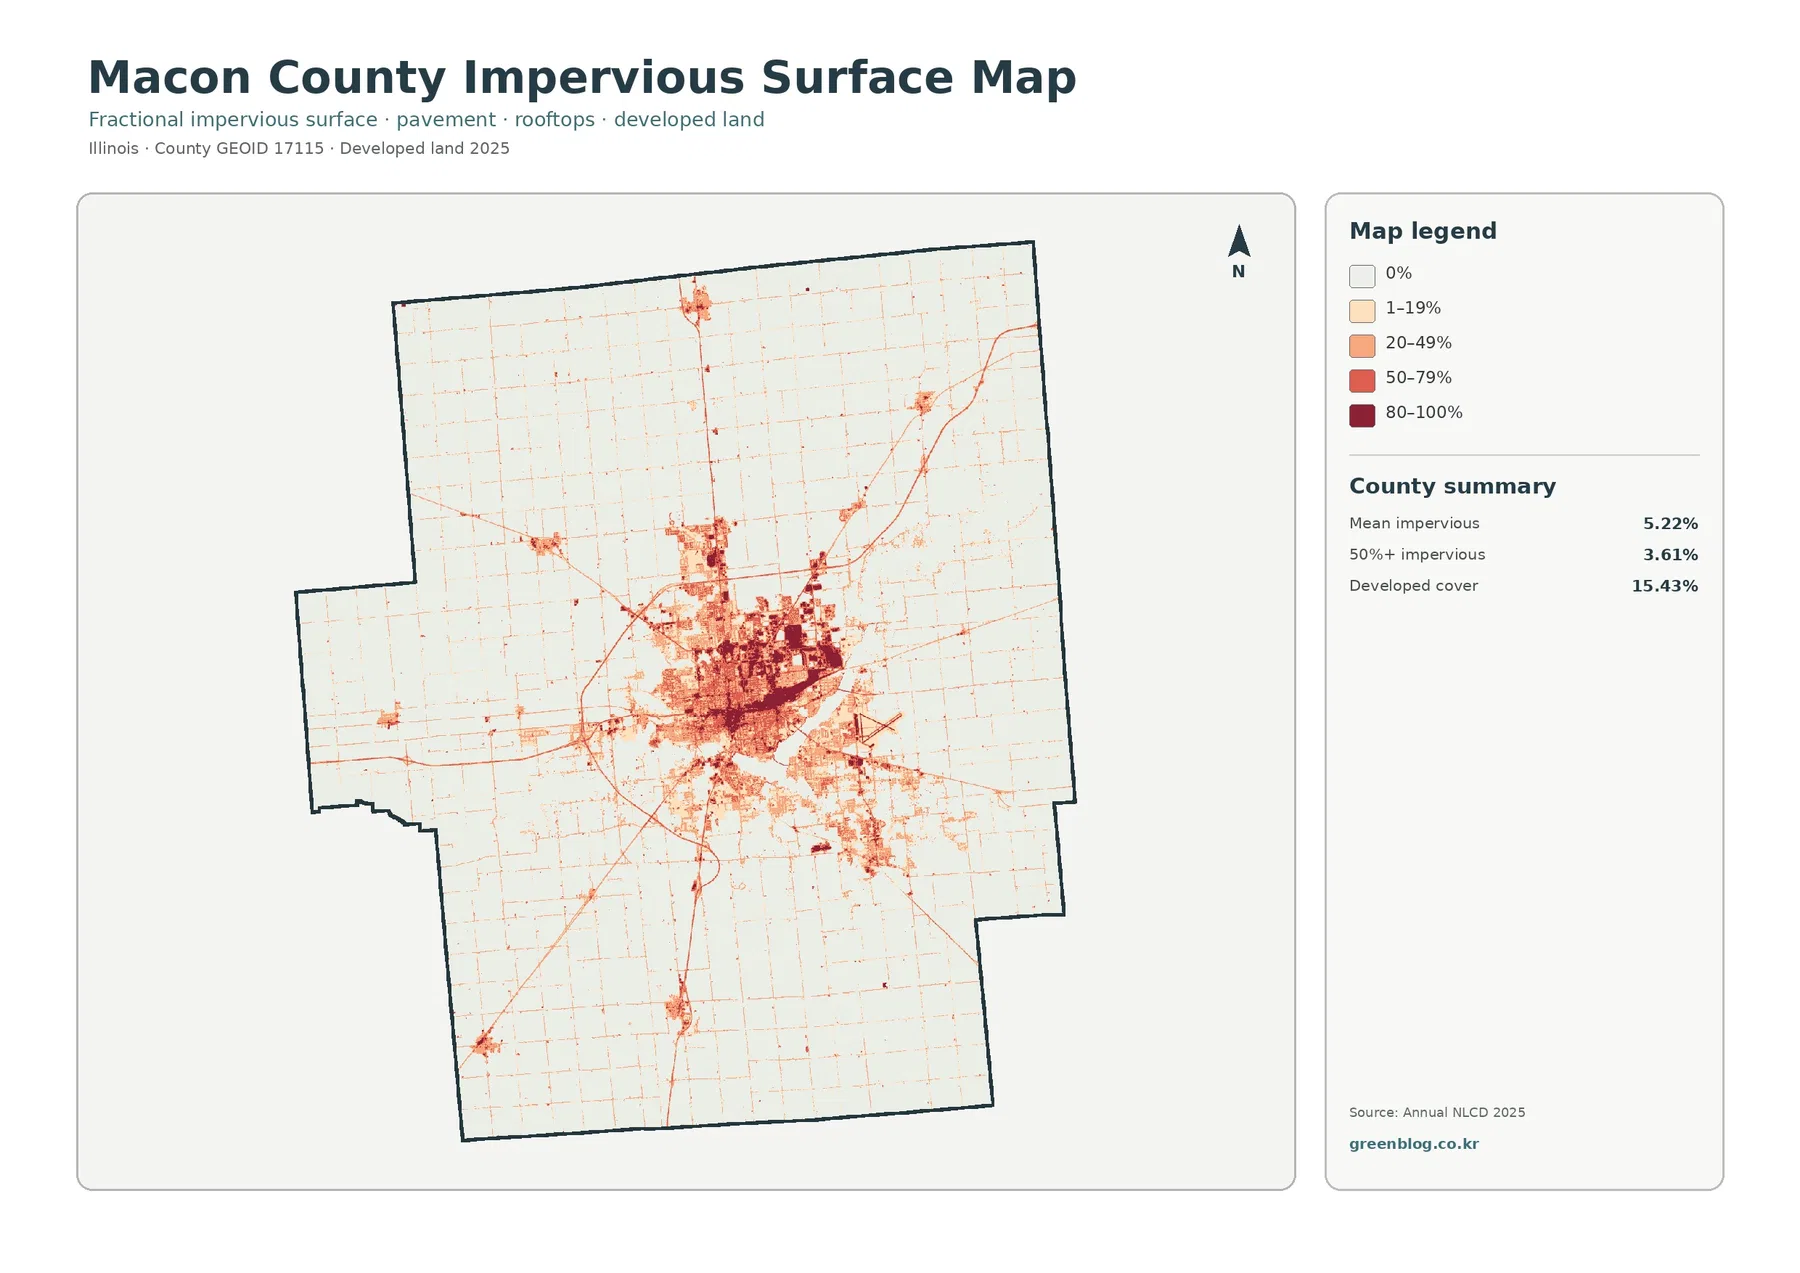
The impervious-surface map changes the way Decatur appears. Instead of assigning every developed location to one red land-cover class, it shows the estimated fraction of each cell covered by surfaces that water does not easily soak through, such as rooftops, paved streets, parking lots, and other hard surfaces. Values are grouped into 0%, 1–19%, 20–49%, 50–79%, and 80–100%. This makes the internal texture of the developed area visible without treating all urban land as equally paved.
The darkest values are concentrated in the main Decatur cluster. High-impervious cells occur across the central built area, while lighter shades extend outward toward the agricultural edge. Thin linear patterns also trace major transportation routes, and several smaller built clusters appear elsewhere in the county. The map shows that roads and developed land occupy many of the same corridors, but that visual association does not establish a cause-and-effect relationship. It simply identifies where built surfaces and transportation features are concentrated together in the mapped landscape.
The county-wide mean impervious value is 5.22%, and 3.61% of the county falls in cells with more than 50% impervious surface. Both figures are much lower than the 15.43% developed-cover share because the measures answer different questions. A developed land-cover class can contain lawns, trees, exposed soil, and other permeable surfaces alongside buildings and pavement. The impervious layer isolates the hard-surface fraction within each cell. It is therefore useful for comparing built intensity, but it should not be read as a municipal boundary or population-density map.
Lake Decatur organizes a narrow band of water, forest, and wetlands through the farm landscape
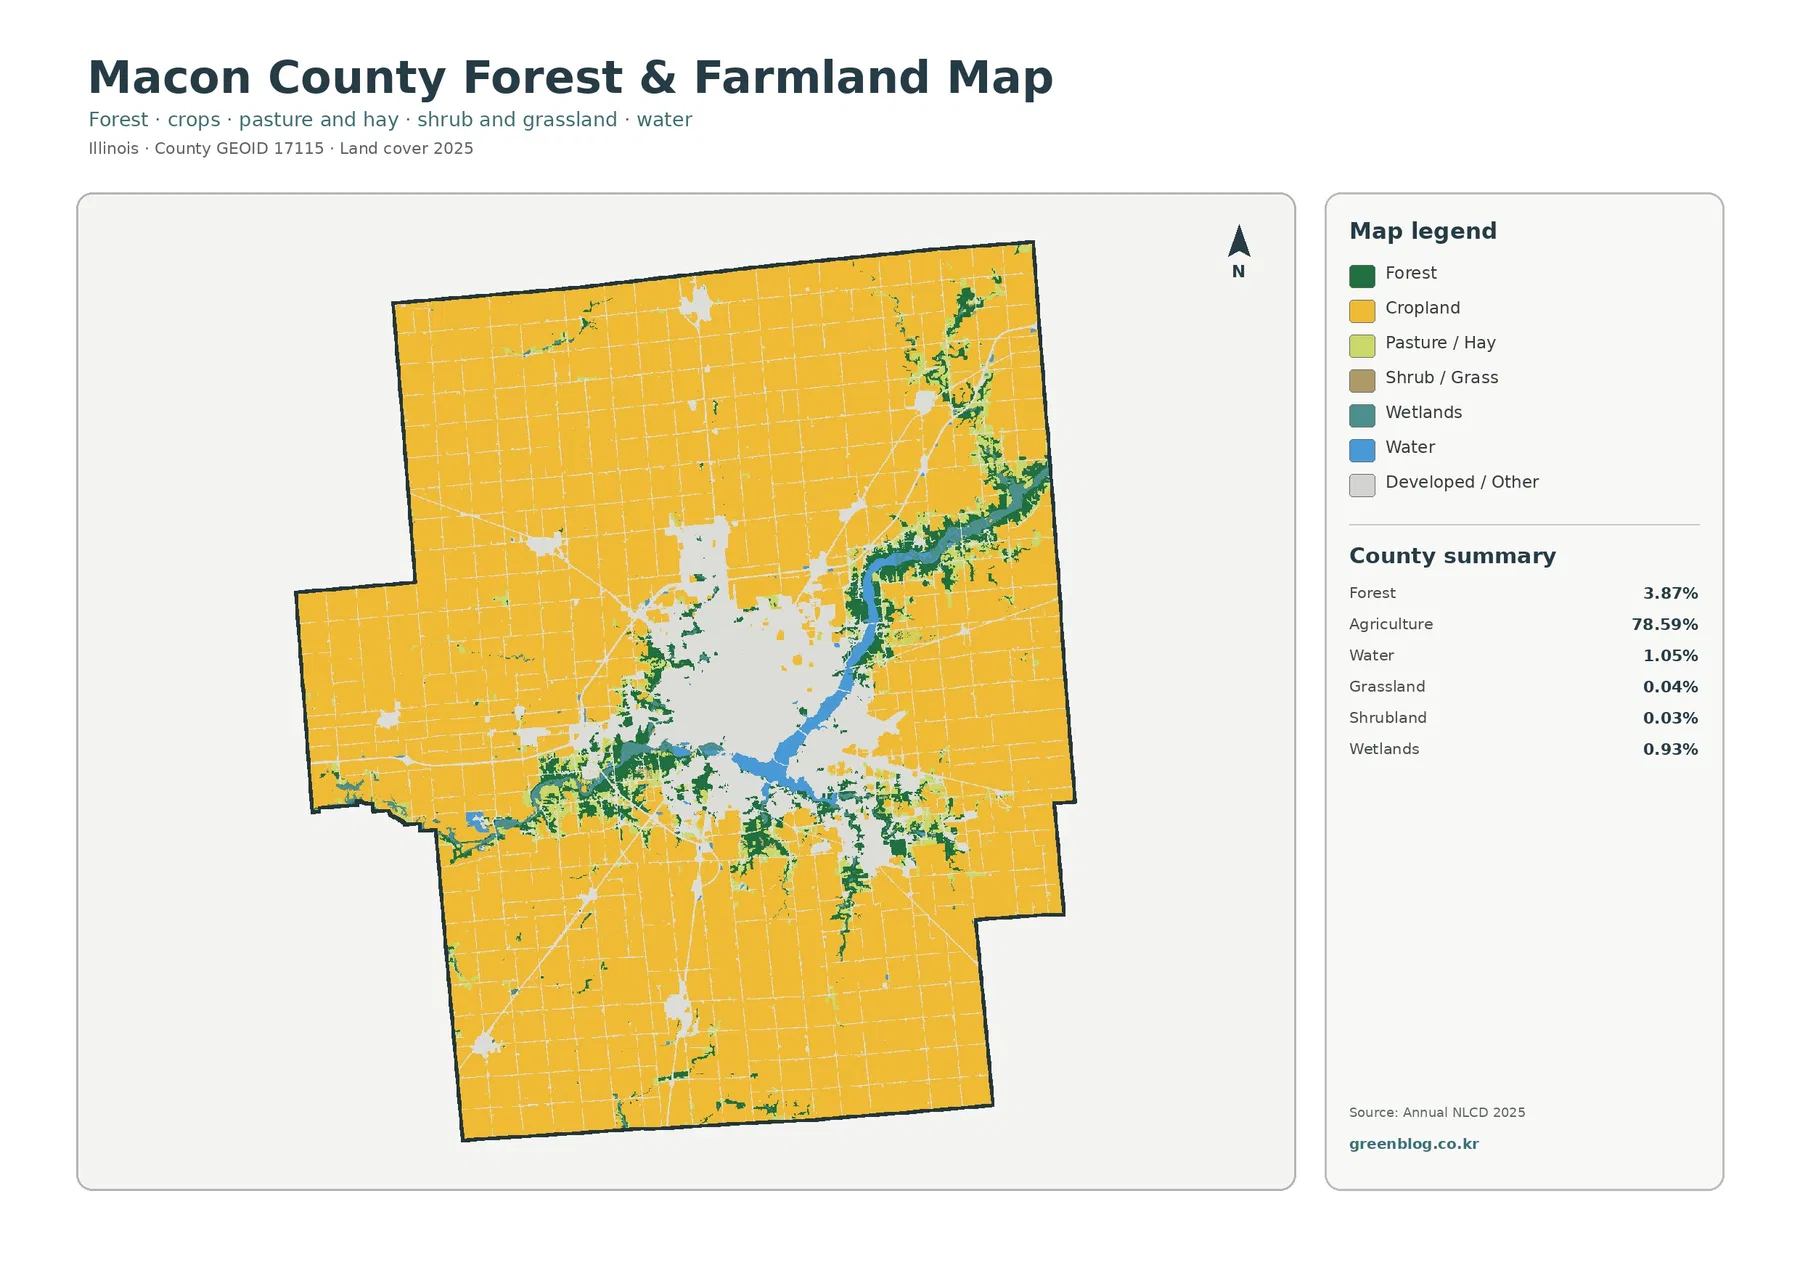
The forest-and-farmland map removes much of the visual competition from the developed classes, making the lake corridor easier to follow. Cropland dominates nearly every outer part of the county, but forest and wetlands recur along the lake, tributary-like branches, and smaller drainage features. This pattern is especially visible from the east side of Decatur toward the northeast, where the blue water body is bordered in many places by green forest and teal wetland cells. The resulting corridor is narrow compared with the surrounding agricultural blocks but visually continuous enough to define a distinct part of the county.
City of Decatur information describes Lake Decatur as an approximately 3,090-acre reservoir located in the city and about 13 miles long. That local reference helps identify the long water feature seen in the map, but the land-cover classes still come from the Annual NLCD source rather than the city website. On the map, water, forest, and wetlands remain separate categories even where they touch. A wooded shoreline should not be counted as wetland simply because it is next to the lake, and a wetland cell should not be treated as open water unless the source classifies it that way.
The summary for this simplified view lists agriculture at 78.59%, forest at 3.87%, water at 1.05%, wetlands at 0.93%, grassland at 0.04%, and shrubland at 0.03%. The extremely small grassland and shrubland values matter because they prevent an exaggerated description of open natural cover. Macon County’s mapped pattern is not a broad prairie-and-shrub mosaic in this 2025 classification. It is primarily cropland and developed land, with forest, wetland, and water concentrated in much narrower features.
The 1985–2025 map marks a 5.74% class difference, not a single type of land conversion
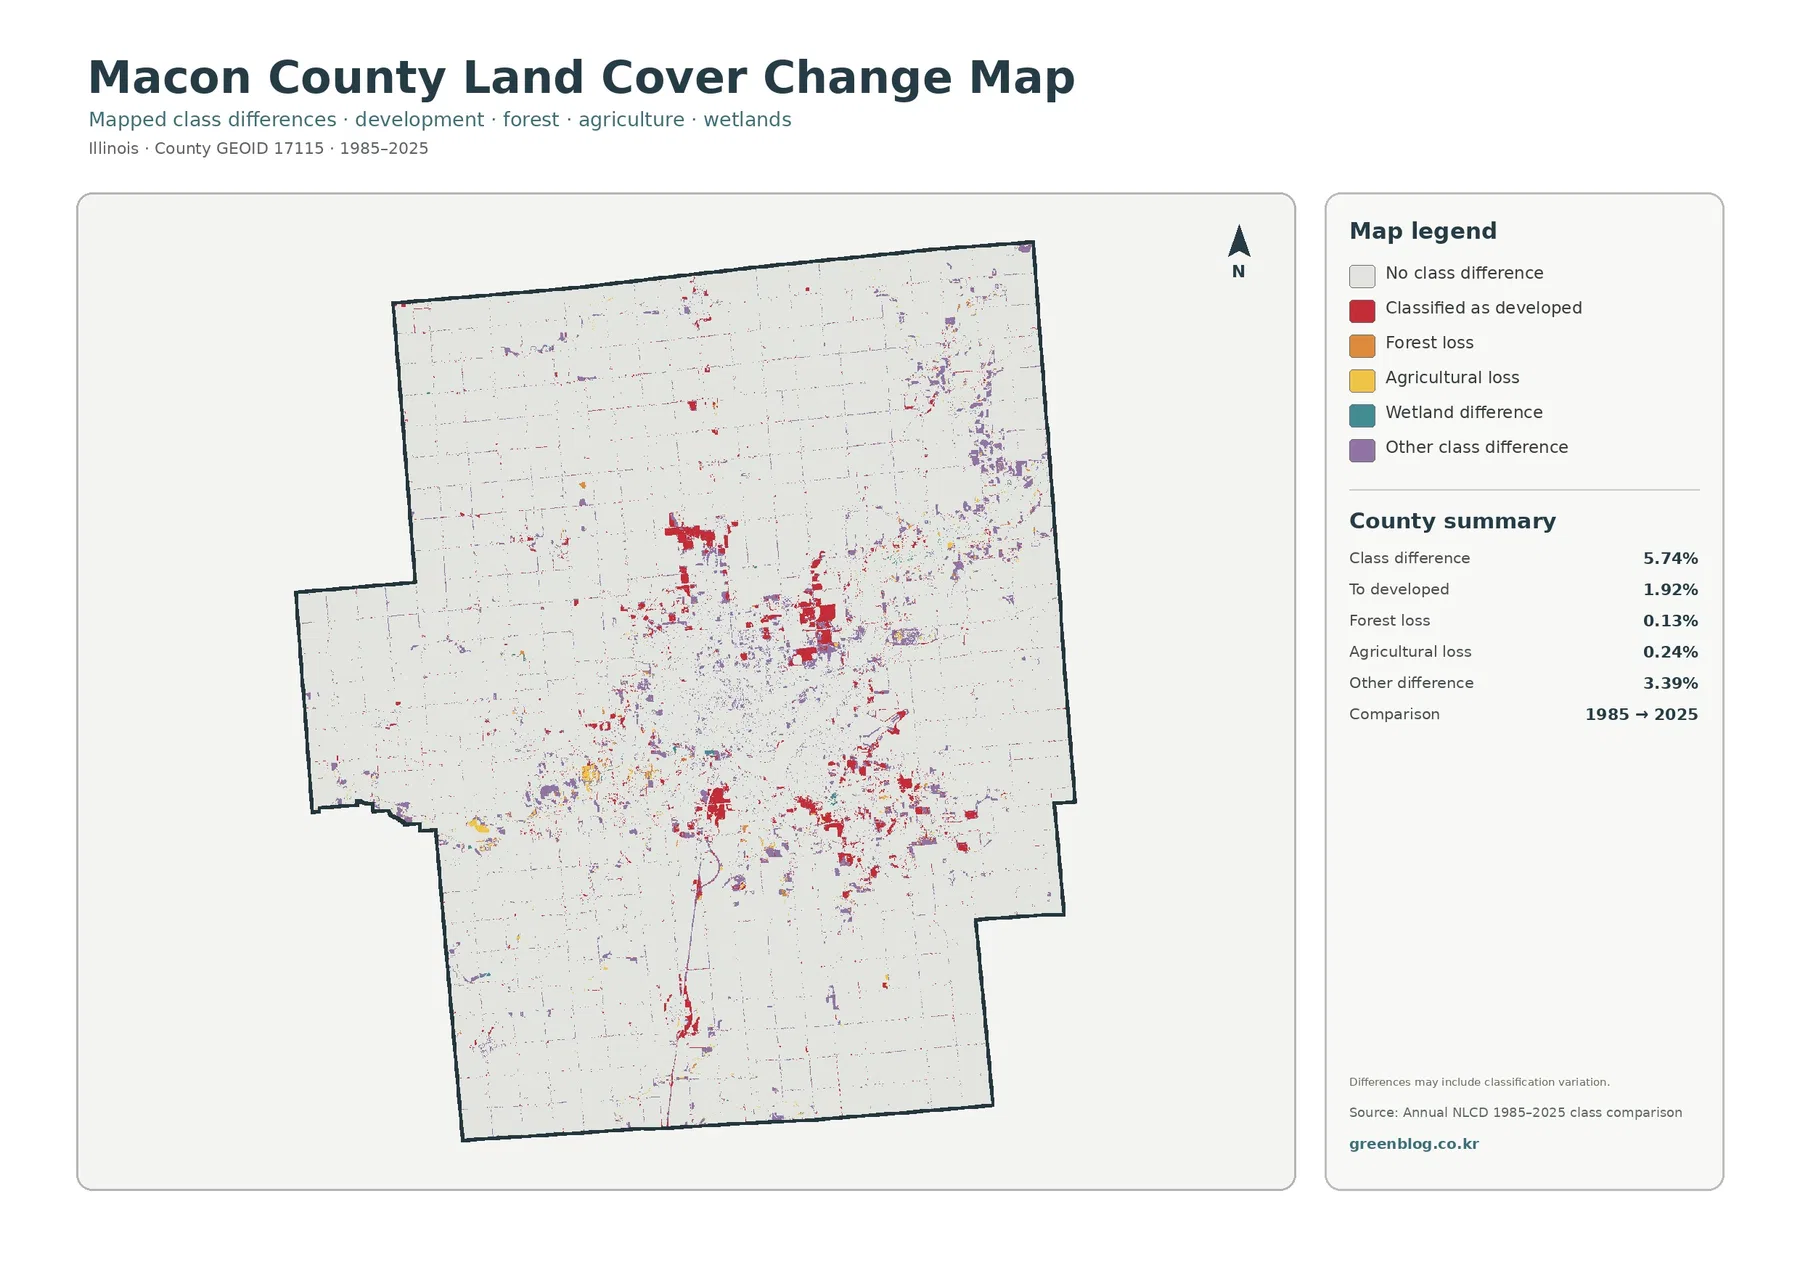
Most of the change map is pale because most cells are placed in the “no class difference” category. Colored cells are scattered across the county, with noticeable red developed-class changes around parts of the central urban area and at several smaller locations. Purple “other class difference” cells appear in many places as well, including clusters toward the east and northeast. The map therefore looks very different from the 2025 land-cover view: it intentionally removes the stable background and highlights only where the two endpoint classifications differ.
The county summary reports a total class difference of 5.74%. Within that display, 1.92% is labeled as change to developed, 0.13% as forest loss, 0.24% as agricultural loss, and 3.39% as other difference. The large “other” component is an important warning against calling the full 5.74% urban growth. It also means a colored patch cannot be assigned a detailed real-world story solely from this map. A site shown as different may need aerial imagery, planning records, or other year-specific evidence before its actual history can be described.
The map itself notes that differences may include classification variation. Annual land-cover products are based on raster cells and classification methods, so some differences can occur around mixed surfaces, narrow features, water edges, or places where the dominant class changes between observations. The 1985–2025 layer is best used as a screening map: find a cluster of change, return to the 2025 general and impervious maps to understand the present condition, and then use additional source material if the date or cause of change matters.
Frequently Asked Questions
What is the dominant land cover in Macon County?
Agriculture is the dominant 2025 category at 78.59%. Developed land follows at 15.43%, while forest is 3.87%, water 1.05%, and wetlands 0.93%. On the map, that produces a broad agricultural background with a large developed concentration at Decatur and narrower water, forest, and wetland corridors around Lake Decatur and other drainage features.
Why does Decatur look different on the impervious map?
The general map places developed locations into land-cover classes, while the impervious map measures how much of each cell is covered by hard surfaces such as pavement and rooftops. Decatur therefore breaks into a range of values rather than one uniform developed color. The county mean is 5.22%, and 3.61% of the county is in cells above 50% impervious cover.
Does the 5.74% class difference mean Macon County developed by 5.74%?
No. The 5.74% figure is the total share of cells classified differently between the 1985 and 2025 endpoints. Only 1.92% is labeled as change to developed, while 3.39% falls into other class differences and smaller shares are shown for forest and agricultural loss. The map also warns that classification variation can be included, so detailed land-conversion claims require additional evidence.
Raster cells are useful for county patterns, not parcel-level decisions
Annual NLCD is a raster dataset, meaning the landscape is represented as a grid of cells rather than as property parcels. A cell receives a classification based on the source data and processing method. In a place such as the edge of Decatur, one cell can contain a house, lawn, street, trees, and exposed soil at the same time. The general land-cover layer must still assign a representative class, while the impervious layer can record the hard-surface fraction separately. This is why boundaries in the map can look simpler than the real ground pattern.
Small or narrow features deserve particular care. A roadside tree strip, tiny pond, drainage ditch, or narrow wetland may occupy only part of a cell and can be less obvious when the county map is viewed at a reduced size. Conversely, a colored cell does not mean every square foot inside it has exactly the same cover. The maps are strong for finding broad concentrations, corridors, and contrasts across Macon County, but they should not replace surveying, parcel GIS, wetland delineation, zoning records, or site-specific field work.
The date also matters. The three current-condition maps represent the 2025 land-cover products supplied in this package. Construction, demolition, shoreline work, crop rotation, or other changes after that date are outside their scope. The historical map compares two endpoints rather than providing a year-by-year timeline. If you need to know exactly when a site changed, use dated aerial imagery or local records in addition to these maps. Treating the map year and classification limits as part of the caption will make reused images much easier to understand.
Choosing and downloading the Macon County JPG map set
The downloadable ZIP contains four JPG images covering the same Macon County boundary. The general land-cover map is the best single-file overview because it keeps agriculture, development, water, forest, and wetlands together. The forest-and-farmland map is cleaner when cropland and green corridors are the focus. The impervious map is more useful for comparing central Decatur with lower-density edges and rural roads. The 1985–2025 change map should be selected when the task is to locate endpoint class differences rather than describe current cover.
Keeping all four files together is helpful when the map will be printed, placed in a report, or used in a lesson where readers move from a broad county view to a more specific question. Because the maps use different legends, keep each legend and year visible when copying the images into another document. In particular, do not label the change map as a 2025 current-condition map, and do not use the impervious percentage as if it were the county’s developed-land percentage. The download preserves the separate files so each layer can be used for the question it actually answers.
Map File Information
The ZIP contains four original JPG maps for Macon County, including current land cover, forest and farmland, impervious surface and developed land, and the 1985–2025 land-cover class comparison.
- Included Versions: Land cover / Forest & farmland / Impervious & developed land / 1985–2025 land cover change
- File Type: ZIP containing four JPG maps
Related Maps
- Adams County Illinois Land Cover Map
- Alexander County Illinois Land Cover Map
- Bond County Illinois Land Cover Map
Sources and References
The mapped percentages and class descriptions follow the supplied Annual NLCD-based images. Official data pages provide the classification and boundary references, while City of Decatur material supplies local context for Lake Decatur.
- MRLC Annual NLCD Data – Annual NLCD data access and product information
- USGS Annual NLCD Land Cover Classification – land-cover classes and classification guidance
- U.S. Census Bureau TIGER/Line Shapefiles – county boundary and geographic reference data
- City of Decatur – Enjoying Lake Decatur – official information on the lake’s location, size, and management
- City of Decatur Official Website – local government information and map resources
Green Map creates custom-edited map images using open geographic data sources such as geoBoundaries, Natural Earth, OpenStreetMap, and government open data. These maps are edited visual materials, not raw data files, and are provided for education, documents, presentations, and graphic reference.