McIntosh County looks different from an inland Georgia county before the details are even counted. Wetlands cover 52.49% of the supplied 2025 map, forest 25.12%, and open water 9.82%. Developed land is only 4.12% and appears in a few compact mainland clusters. This McIntosh County Georgia Land Cover Map focuses on that coastal contrast: extensive marsh and tidal water surrounding small settlement centers and wooded uplands.
The article uses four WebP previews for current land cover, vegetation, impervious surface, and the 1985–2025 endpoint comparison. The four original 2480 × 1754 JPG maps are packaged in one ZIP for county profiles, coastal-environment lessons, reports, and presentations.
Table of Contents
More than half the county is mapped as wetland, not open water
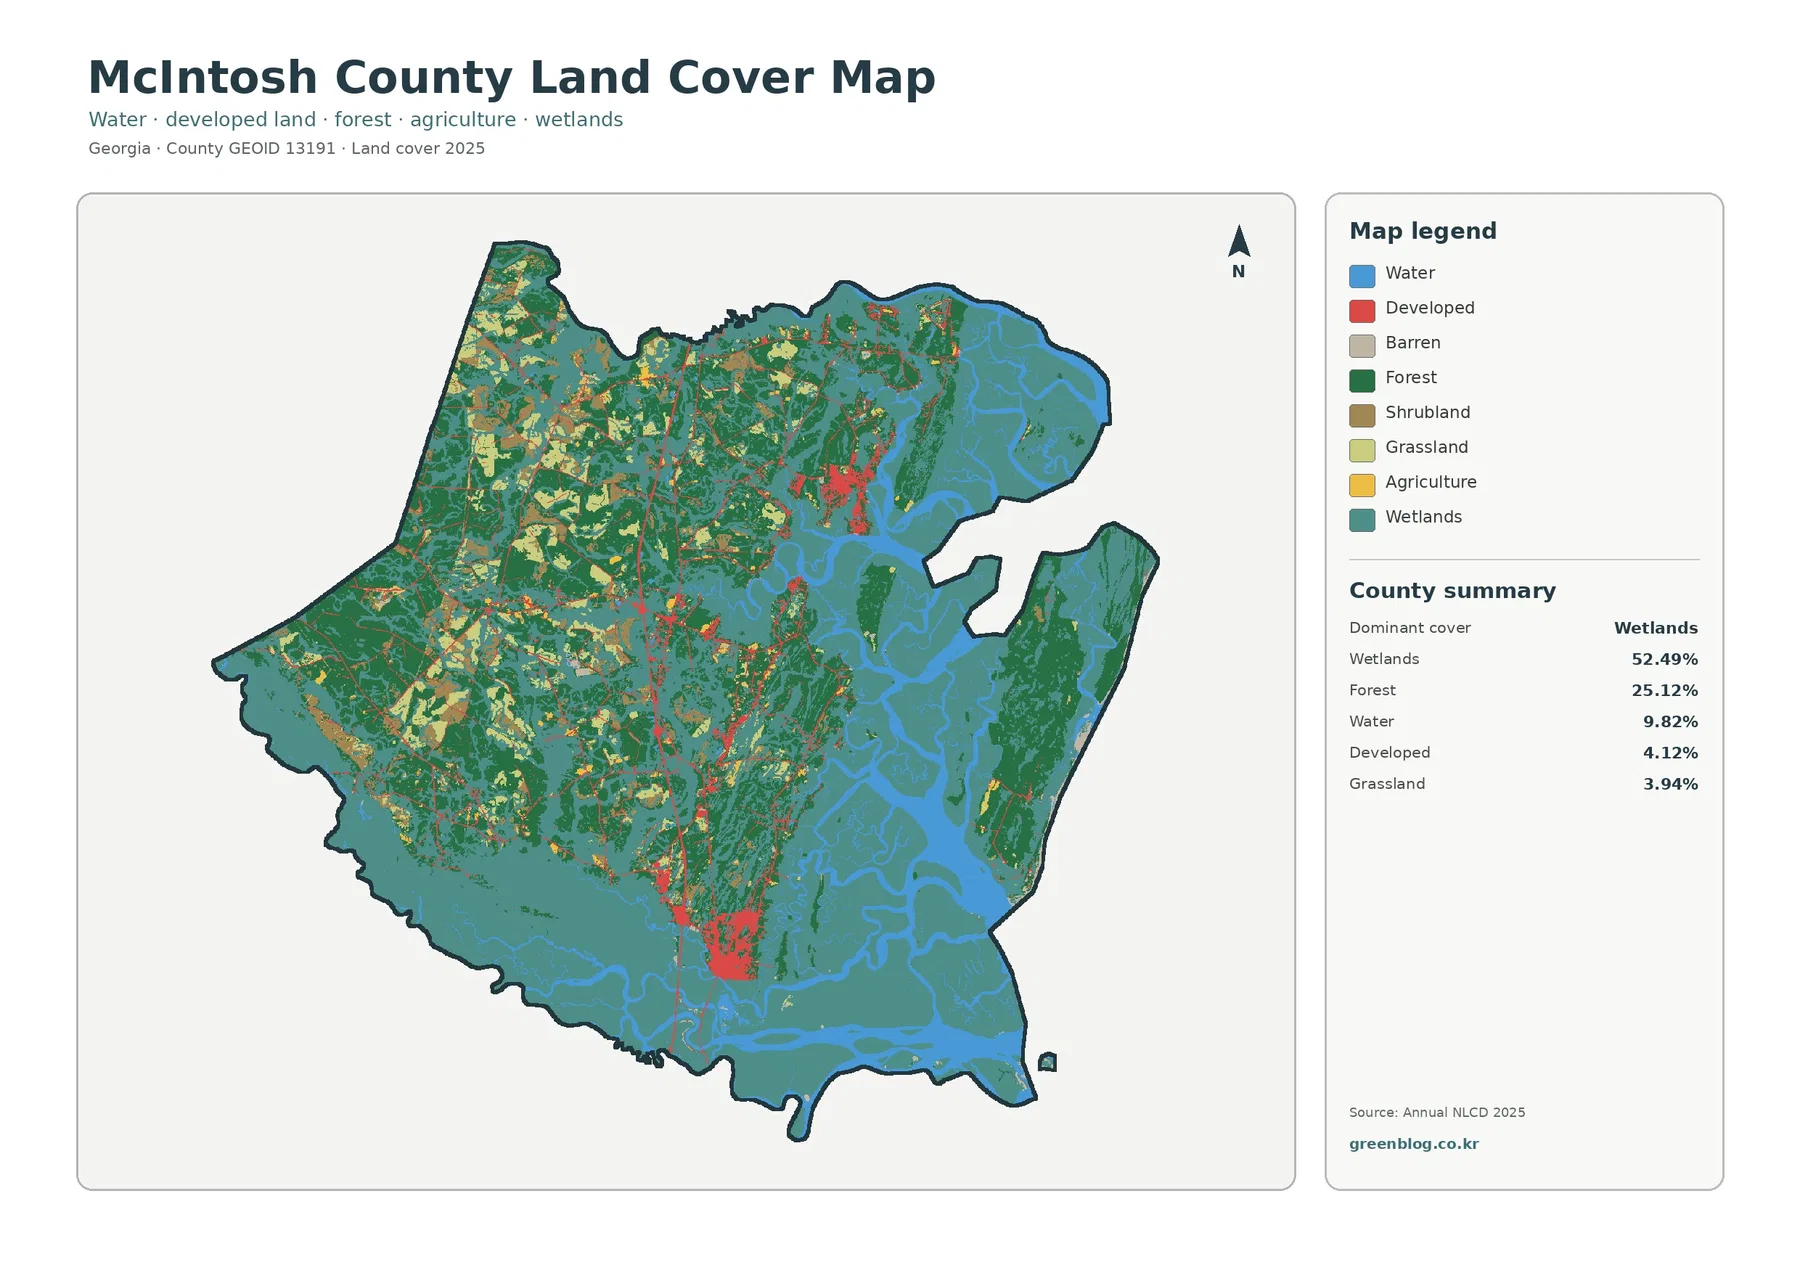
Teal wetland cover dominates the southern and eastern parts of the county and threads inland through a dense network of channels and low areas. At 52.49%, it is not a secondary class around a few rivers; it is the county’s defining surface. McIntosh County’s official website describes sweeping marsh views and winding rivers as characteristic of the area, which matches the pattern visible across the map.
Open water is 9.82%, a large share but still far below the wetland percentage. Blue areas widen toward the coast and around the island landscape, while narrow channels reach back into the marsh. The distinction matters because teal cells can represent vegetated or saturated wet ground rather than exposed water. Combining the two classes would erase one of the most useful features of the map.
Forest covers 25.12%. Large green blocks occupy much of the western and northwestern mainland and also appear within the eastern island area. Forest often meets marsh directly, producing long boundaries between wooded ground and wetland rather than a simple inland-to-coast sequence. The county is better understood as an interlocking forest-marsh-water landscape.
Sapelo Island adds a separate island landscape to the eastern side of the map
Georgia DNR places Sapelo Island on the eastern fringe of McIntosh County, bounded by the Sapelo River, Doboy Sound, the Atlantic Ocean, and the Duplin River. The large separated landmass on the eastern side of the county map sits in that coastal island context and is mostly forested and wetland-covered, with open water around it. This gives the eastern part of McIntosh County a very different visual structure from the road-connected mainland west.
Darien forms the clearest mainland settlement inside the marsh-and-river network
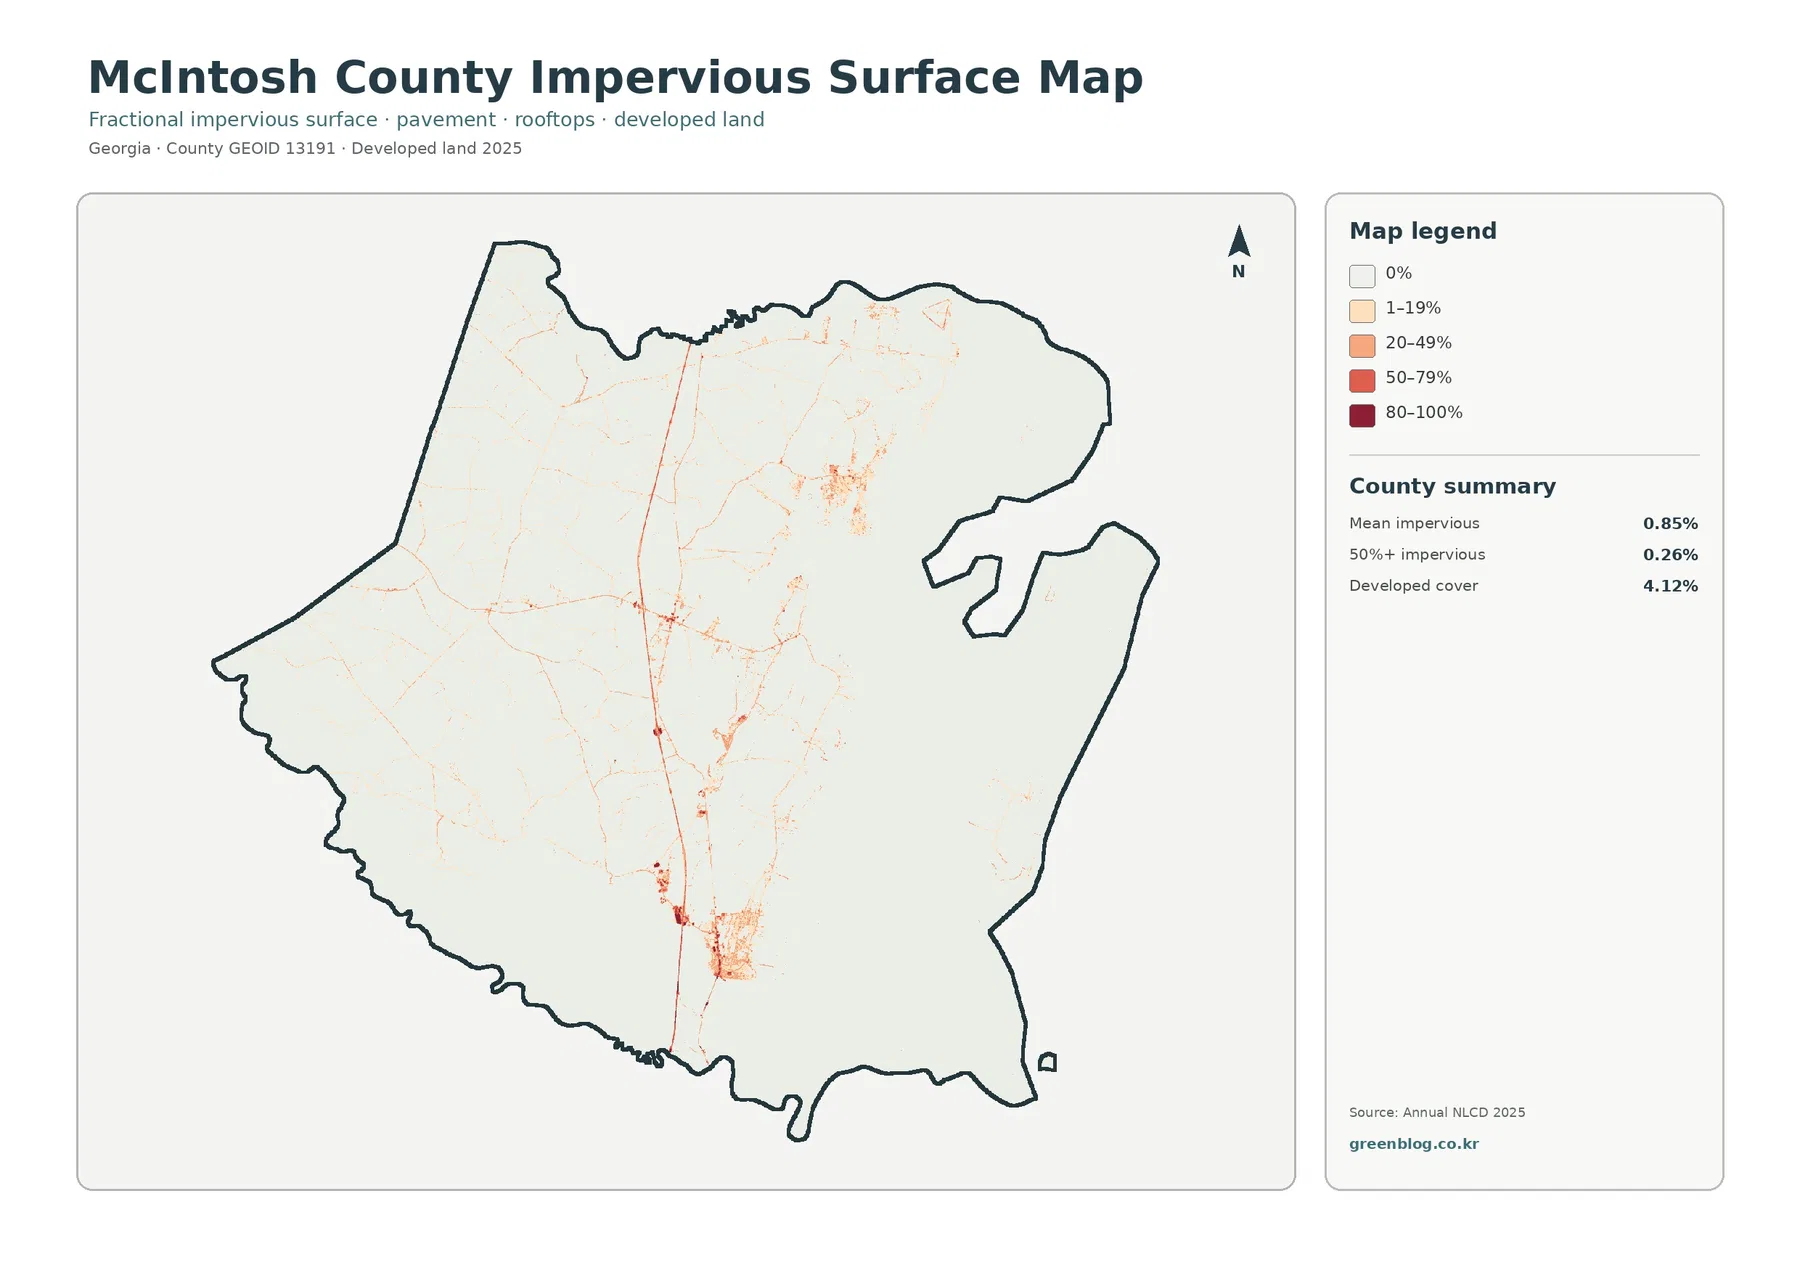
The impervious map is mostly empty of strong color. One of the clearest clusters lies in the east-central mainland, close to the wetland and water network. County historical material identifies Darien as the county seat at the mouth of the Altamaha River and describes it as the most densely populated part of this largely rural county. That makes Darien the most useful place reference for the principal coastal development cluster.
A second hard-surface group appears farther south-central, and thin low-intensity lines connect smaller places across the mainland. Those lines resemble roads, but the raster provides no route names or traffic data. They should be used to describe the orientation of built surfaces rather than to label a specific highway without a separate transportation layer.
Mean impervious cover is only 0.85%, and 0.26% of the county reaches 50% impervious surface or more. Developed land is 4.12%. The gap between the two measures is expected because developed classes can include lawns, trees, yards, and bare soil, while the impervious product isolates roofs, pavement, parking surfaces, and similar hard materials.
The vegetation view shows how little of the county is classified as agriculture
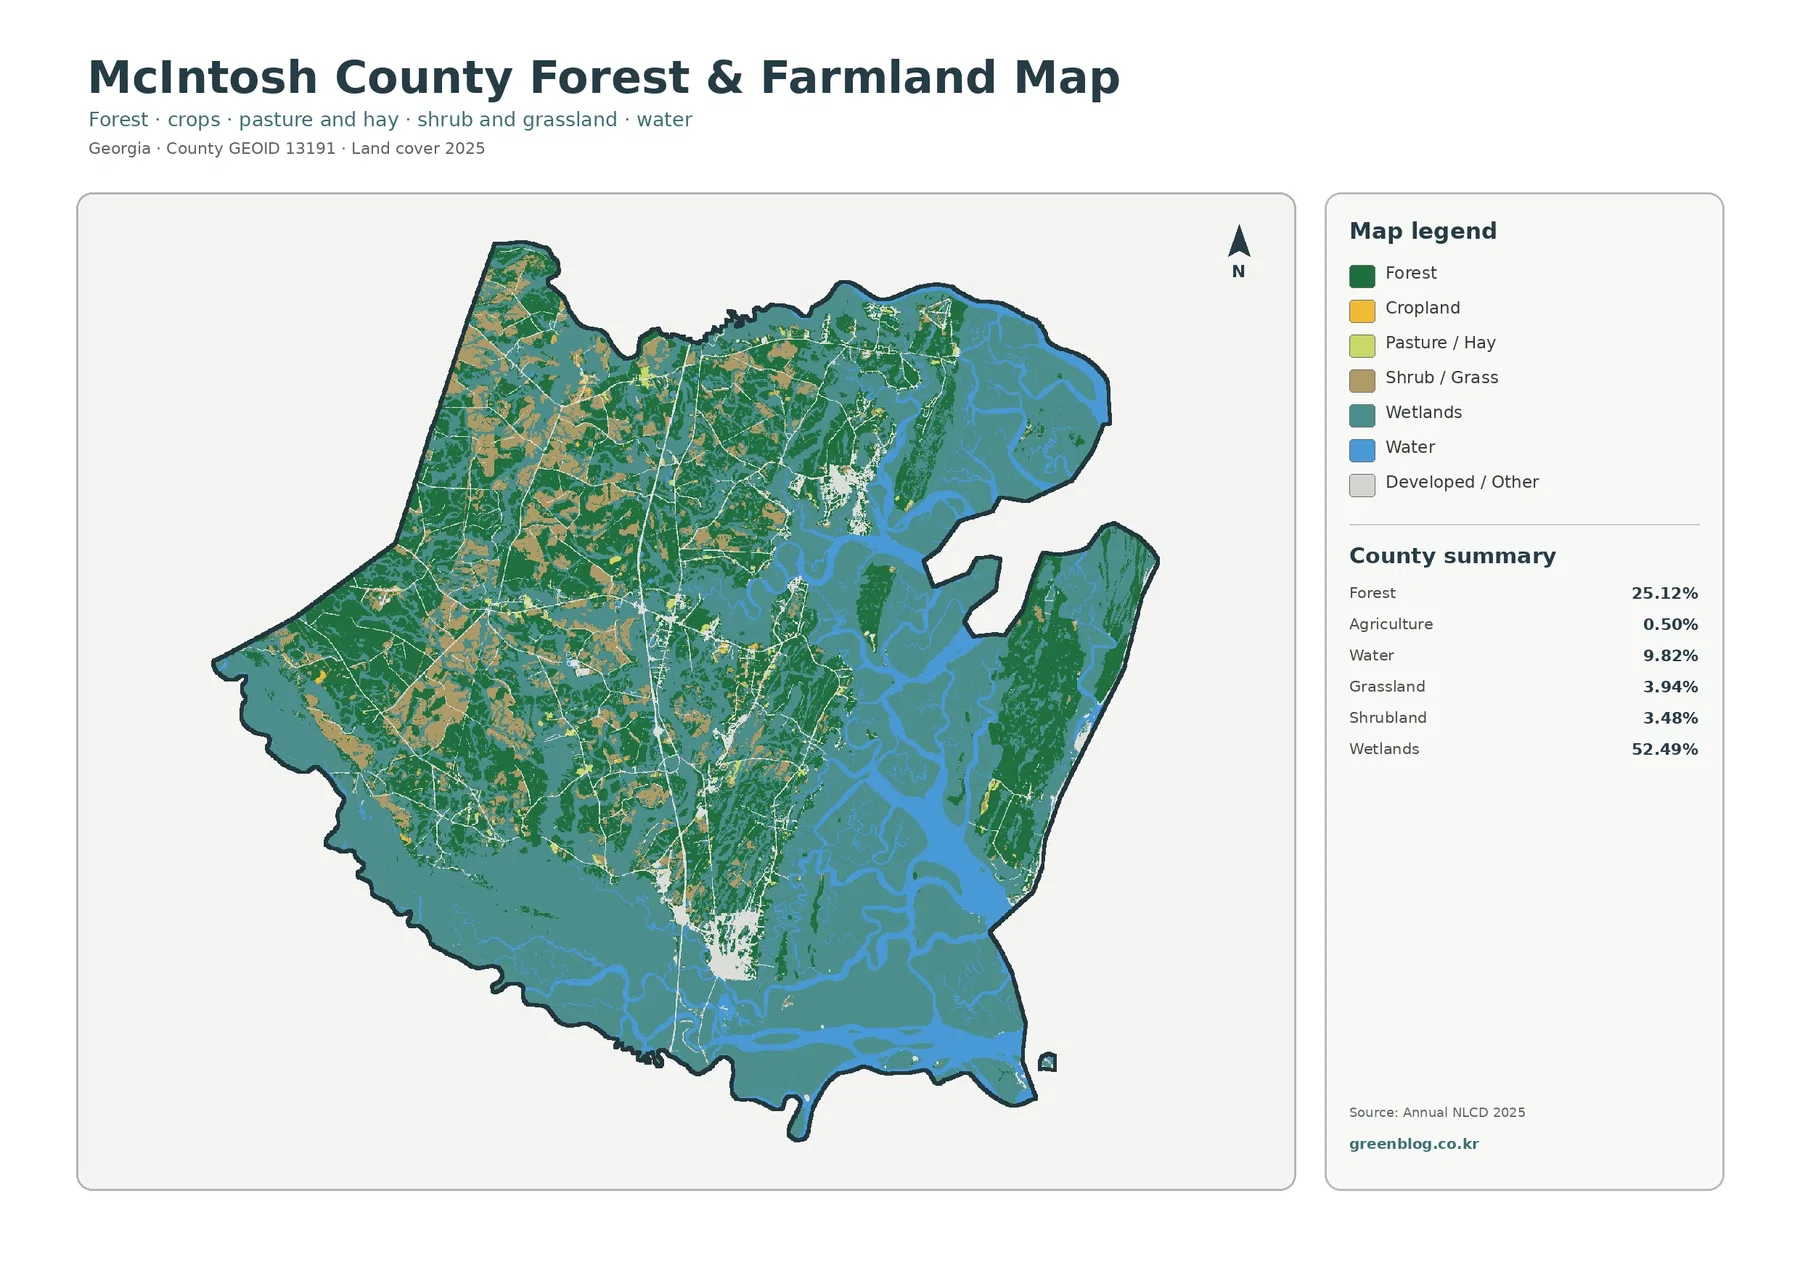
Agriculture accounts for just 0.50% in the supplied vegetation summary. Yellow agricultural cells are limited to small mainland patches, especially toward the west and northwest. They never form the broad field blocks seen across many inland counties. Grassland at 3.94% and shrubland at 3.48% occupy more space and appear around forest edges and other open mainland areas.
That small mapped agricultural share should not be confused with the economic importance of local natural-resource industries. UGA Extension’s recent county impact material lists blueberries, timber, and ecotourism among leading annual commodities and activities. The land-cover percentage measures surface area in one classification system; it does not measure farm-gate value, harvest value, or tourism importance.
The coastal setting also makes 30-meter cell boundaries especially important. Trees, marsh vegetation, narrow water, and open ground can all occur within a small area, yet a raster cell receives one predominant label. Fine shoreline and marsh-edge detail can therefore be generalized even when the countywide pattern is reliable.
The 1985–2025 difference map is relatively quiet compared with the marsh-heavy current map
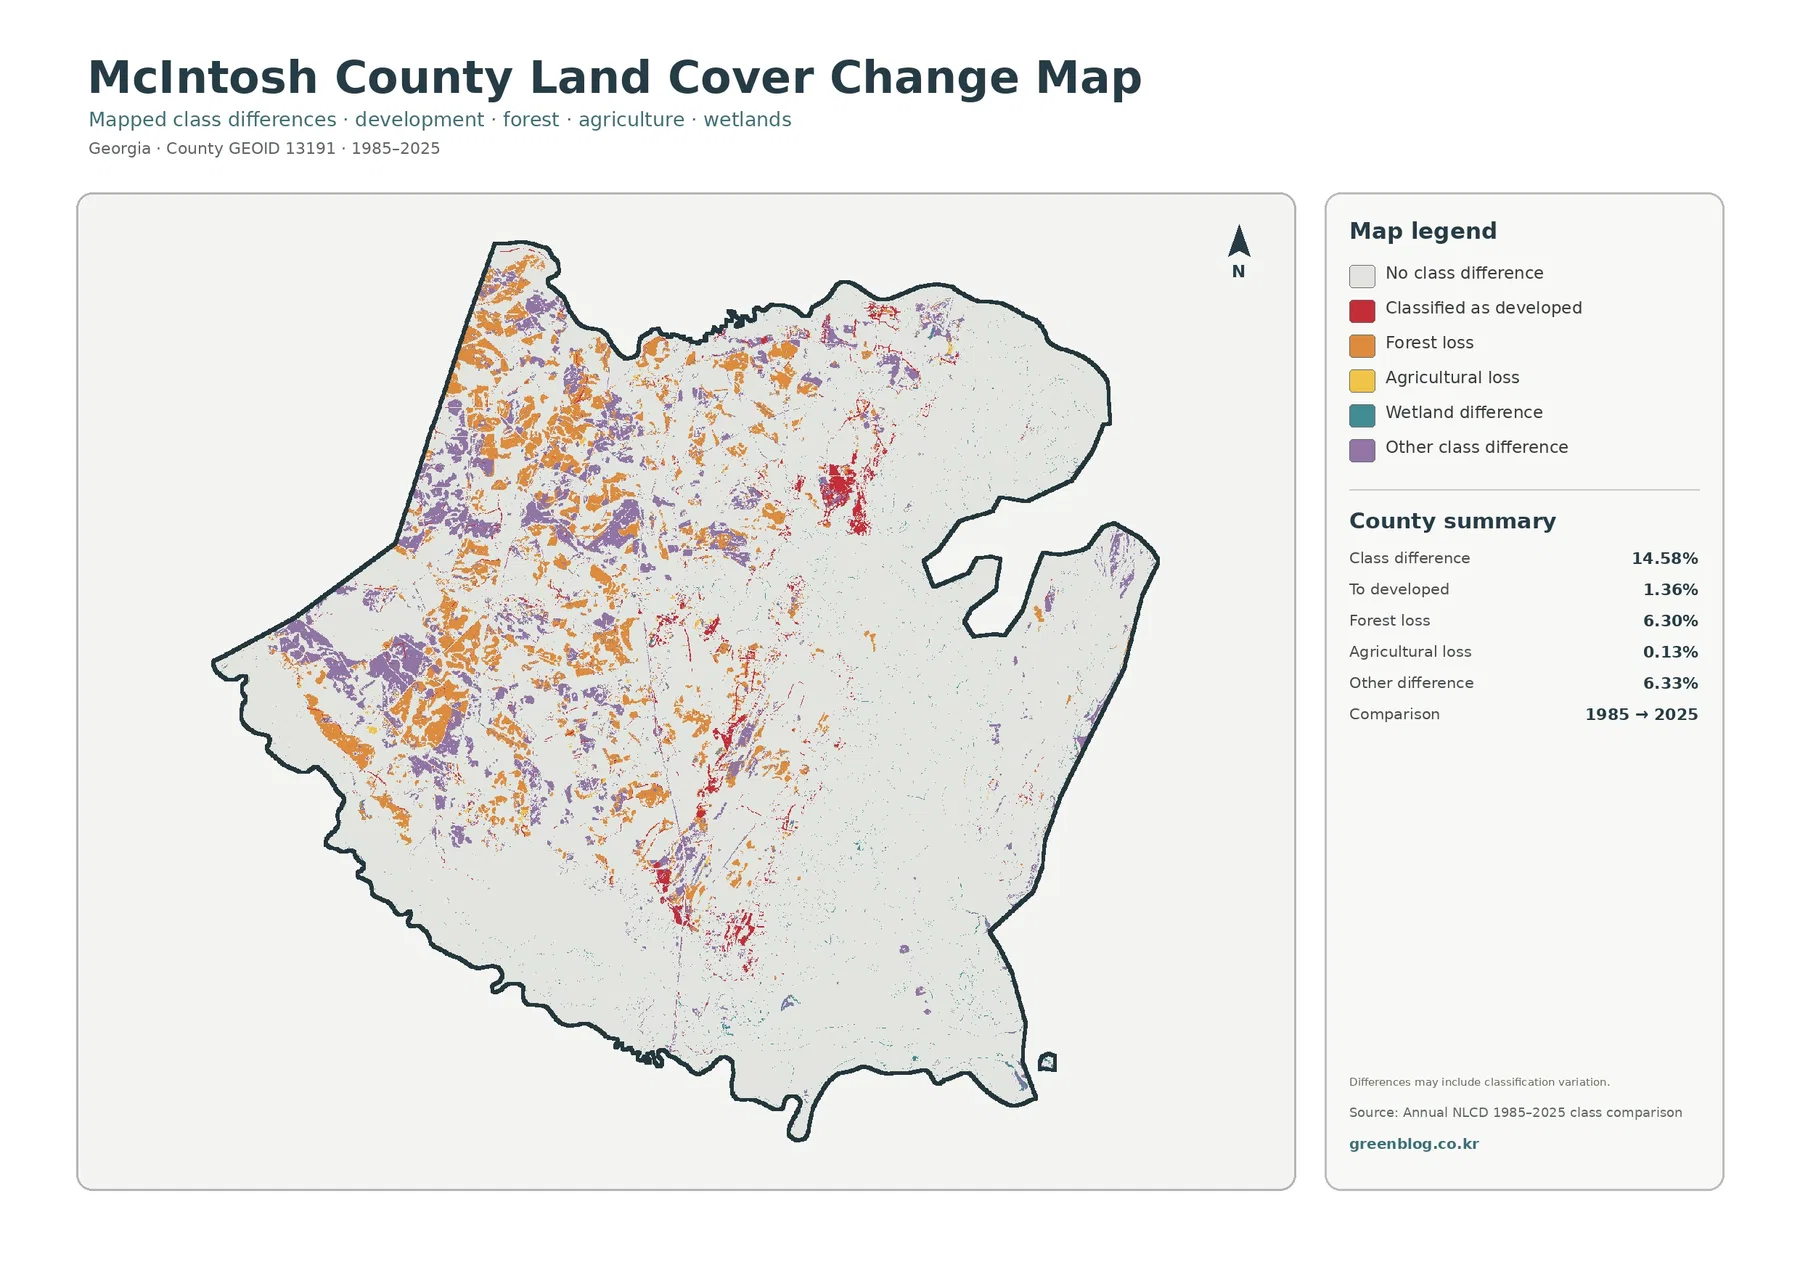
The total endpoint class difference is 14.58%. That number represents raster cells whose class label differs between 1985 and 2025; it is not a coastal-damage percentage or an urbanization rate. This distinction is particularly important in a tidal county, where image timing, water level, seasonal vegetation, mixed pixels, and classification choices can influence how some shoreline and marsh cells are labeled.
The printed summary lists 6.30% forest loss, 6.33% other difference, 1.36% classified to developed, and 0.13% agricultural loss. Developed-change red is concentrated around the same few mainland settlement areas seen on the current map. Forest-loss orange and other-difference purple cover broader parts of the western and northwestern mainland.
Wetland difference is shown in the legend without its own printed percentage. The missing rate should not be reconstructed by subtracting the listed categories from 14.58%. A forest-loss label also does not identify a cause. Timber activity, storms, vegetation transitions, development, or classification variation require intermediate imagery or local records before they can be separated.
Land cover is not a tidal-wetland permit map, flood map, or property map
Annual NLCD classifies the predominant surface within 30-meter raster cells. It does not establish regulatory wetland jurisdiction, a FEMA flood zone, a parcel boundary, a conservation easement, or a municipal limit. That difference is crucial in McIntosh County because so much of the visible landscape is marsh, channel, island, and shoreline.
Using the four JPG maps for coastal context
Use the 2025 countywide map first when the goal is to explain why wetlands, open water, and forest dominate McIntosh County. The vegetation view is better for showing how little agricultural cover exists compared with marsh and woods. The impervious map isolates Darien-area and other mainland hard surfaces, while the endpoint map should be reserved for a separate discussion of classification differences through time.
Frequently Asked Questions
Why are wetlands the dominant land-cover class in McIntosh County?
The supplied 2025 summary maps 52.49% of the county as wetlands. Broad marshes, tidal channels, river corridors, and island-edge wet areas occupy much of the coastal landscape, while open water is counted separately at 9.82%.
Why is agriculture only 0.50% even though the county has agricultural and natural-resource industries?
The 0.50% figure measures land area assigned an agricultural cover class. Economic measures are different: UGA Extension reports blueberries, timber, and ecotourism among important local commodities and activities, none of which can be reduced to the cropland percentage alone.
Does the 14.58% endpoint difference measure coastal damage?
No. It counts cells with different class labels in 1985 and 2025. The summary separately lists 6.30% forest loss, 6.33% other difference, 1.36% classified to developed, and 0.13% agricultural loss.
Sources and Reference Data
- MRLC Annual NLCD Data – official access to annual land-cover and comparison products
- USGS Annual NLCD Land Cover Classification – definitions for wetlands, forest, water, developed land, and related classes
- U.S. Census Bureau TIGER/Line Shapefiles – authoritative county, place, and transportation layers for comparison
- McIntosh County Official Website – official county context on Darien’s working waterfront, marsh vistas, rivers, and coastal environment
- Georgia DNR – Sapelo Island WMA – official geographic context for Sapelo Island on the eastern fringe of McIntosh County
- UGA Extension – McIntosh County Impact – recent county context for blueberries, timber, ecotourism, agriculture, and natural-resource programs
Map File Information
The ZIP contains four original JPG maps for comparing McIntosh County's 52.49% wetland cover, forest, open water, Darien-area development, impervious surfaces, and 1985–2025 class differences.
- Included Files: Four original JPG land-cover maps
- File Type: JPG files in one ZIP archive
- Intended Use: Printing, education, presentations, and map-based projects
Related Maps
- Appling County Georgia Land Cover Map
- Atkinson County Georgia Land Cover Map
- Bacon County Georgia Land Cover Map
Green Map creates custom-edited map images using open geographic data sources such as geoBoundaries, Natural Earth, OpenStreetMap, and government open data. These maps are edited visual materials, not raw data files, and are provided for education, documents, presentations, and graphic reference.