A Delaware map turns the state’s famously compact outline into a clear north-to-south story. Pennsylvania meets its short northern edge, Maryland follows most of the west, and New Jersey sits across the Delaware River and Delaware Bay. Farther south, the coast opens to the Atlantic Ocean. These surrounding features matter because Delaware is narrow: its county pattern is easiest to understand when the waterways and neighboring states remain visible rather than when the state appears as an isolated shape.
This collection presents that geography in three coordinated styles: a labeled color version, a print-friendly black and white version, and an unlabeled outline. Each image uses a tall portrait layout and preserves the boundaries of New Castle, Kent, and Sussex counties. The three files can therefore serve different stages of one project, from introducing the state and checking locations to completing a worksheet or building a custom infographic.
The uploaded page images are WEBP files, while the downloadable ZIP contains JPG and PNG options. The originals measure 3505×4920 pixels and were prepared around an A3 print layout using a CMYK-based design workflow. That combination provides enough resolution for classroom handouts, reports, presentation graphics, wall displays, travel notes, and digital editing without changing the basic county arrangement from one version to another.
Delaware has just three counties, yet the map is not visually empty. The curved river edge in the north, the broad bay beside central Delaware, and the Atlantic-facing southern shore create a distinct coastal framework. Keeping those shapes readable was central to the design. The surrounding land is subdued, the water is easy to distinguish, and the state remains the visual focus even where its coastline becomes intricate.
Table of Contents
Why a Delaware map Works Well as a Regional Reference
The three-county structure creates an unusually direct regional reference. New Castle occupies the northern section, including the area closest to Pennsylvania and the upper Delaware River. Kent forms the middle of the state along Delaware Bay. Sussex fills the broad southern section and reaches the Atlantic coast. A reader can move down the page in the same order, so the administrative pattern is quick to learn and easy to recall.
That simplicity makes a Delaware map useful for comparison. Instead of sorting through dozens of small divisions, students can concentrate on position, proportion, and coastline. The northern county looks relatively compact, the central county creates a transition, and the southern county occupies a large share of the visible land. Those differences can support lessons about population, land use, transport, tourism, or coastal environments without overwhelming the page with labels.
The regional labels add another layer. Pennsylvania appears above the state, Maryland to the west, and New Jersey across the water to the east. Delaware Bay separates much of the state from New Jersey before meeting the Atlantic Ocean. This context is especially helpful in Mid-Atlantic studies, where a bare state outline would show boundaries but not explain the state’s relationship to the larger estuary and coast.
Color-Coded Delaware County Map
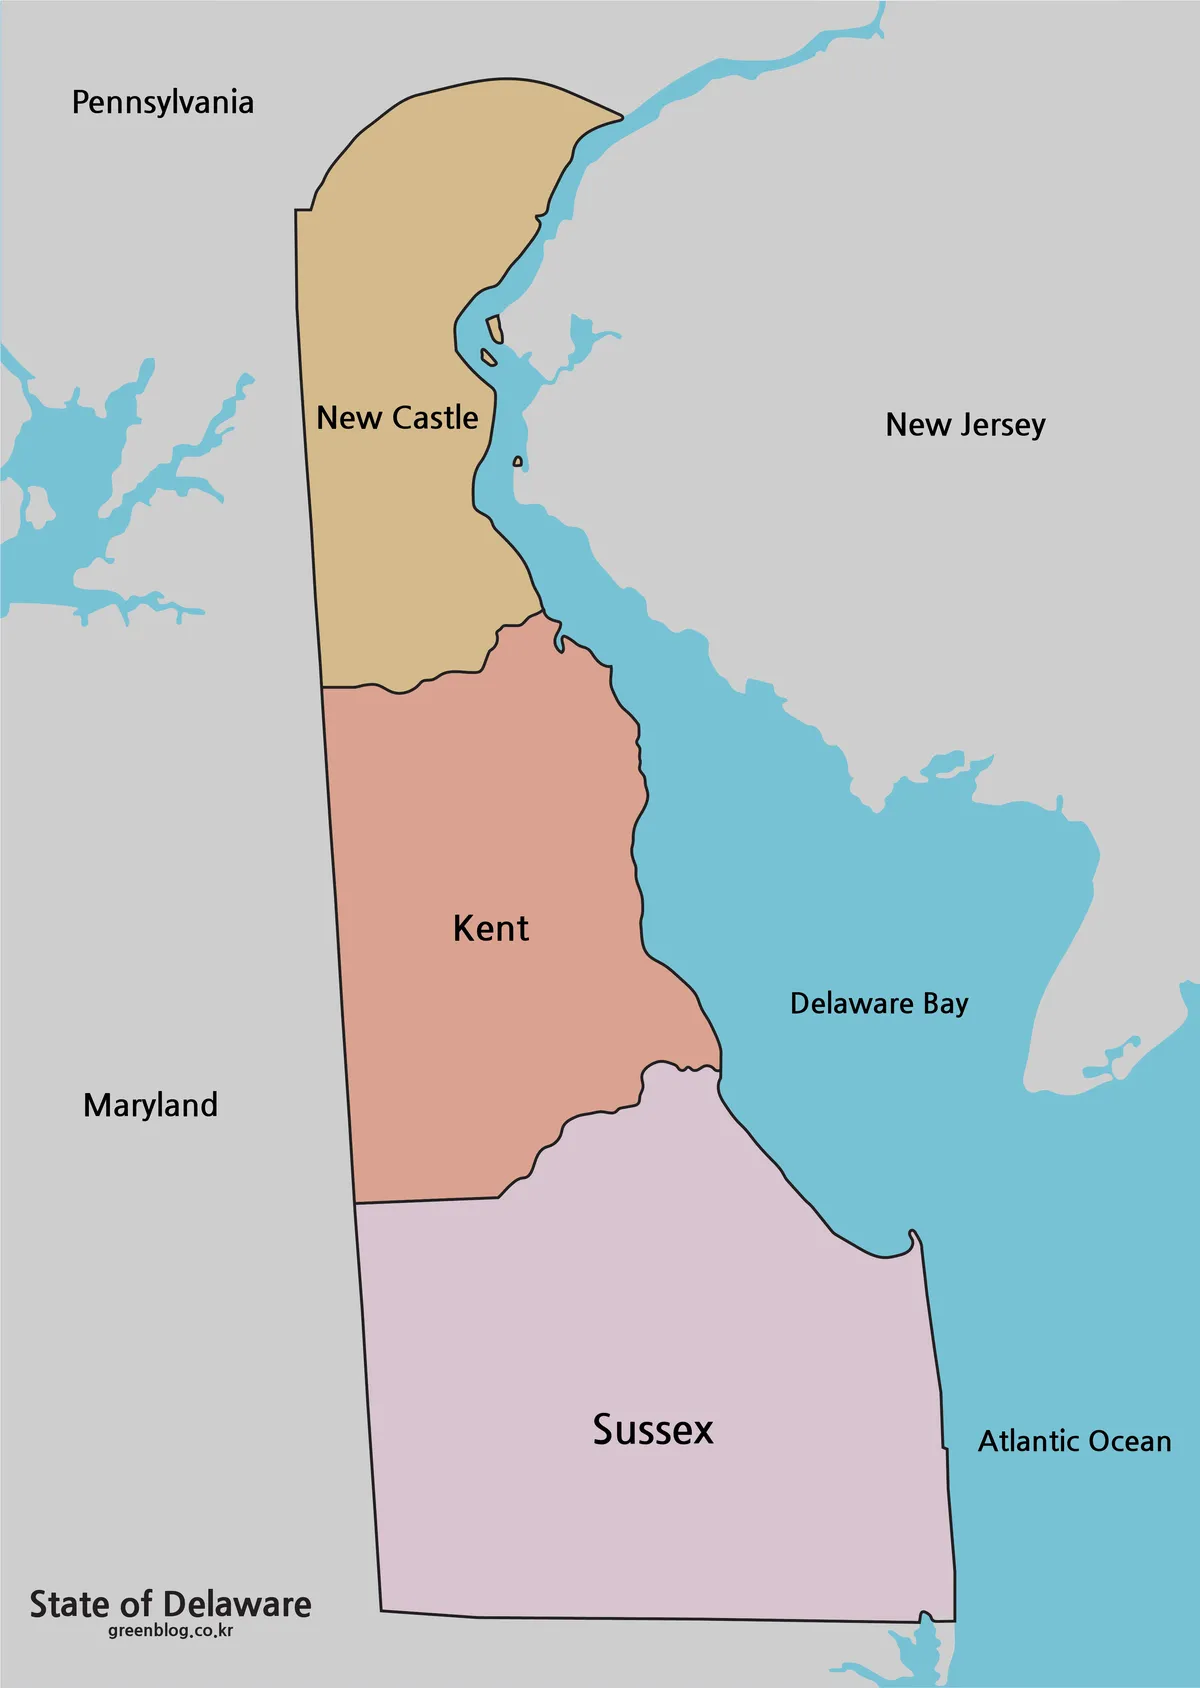
The color Delaware map assigns a soft, distinct fill to each county: tan for New Castle, muted coral for Kent, and pale lavender for Sussex. Blue identifies the river, bay, ocean, and other water areas, while gray pushes neighboring land into the background. The restrained palette separates the counties immediately without turning the surrounding geography into a competing focal point.
Labels are placed inside all three county shapes. The neighboring-state names sit outside Delaware, and Delaware Bay and the Atlantic Ocean are named within the blue water. This makes the image ready for a slide or report in which readers need orientation at a glance. It also helps a presenter explain that the state’s eastern side changes from river to bay to ocean as the eye travels south.
Use this version when color carries meaning: comparing county statistics, introducing the three divisions, building a regional overview, or showing a travel area. If additional markers are added, choose symbols that remain distinct from the three county fills. A small legend can then explain routes, cities, or data points while the base colors continue to communicate county membership.
Black and White Delaware Map for Printing
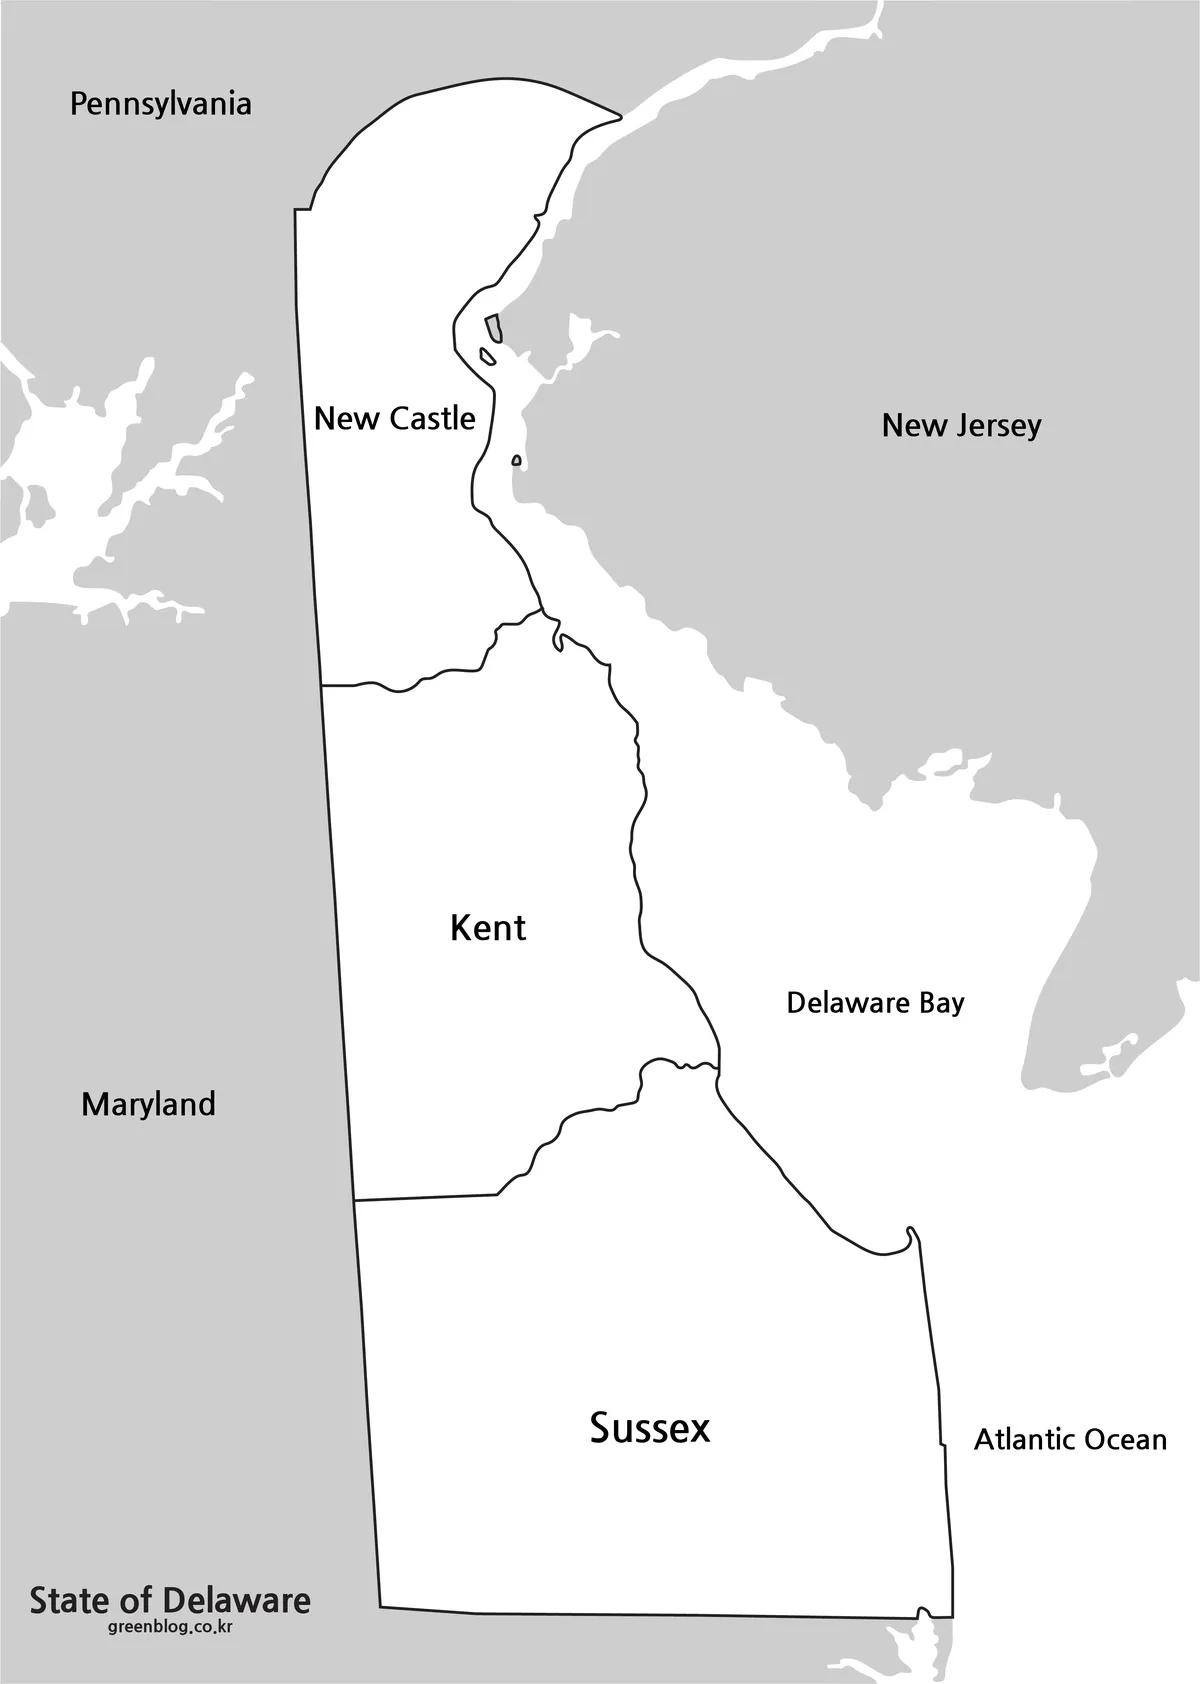
The black and white Delaware map keeps the same boundaries and words but removes the county colors. Delaware remains white against a light gray surrounding region, and dark lines define the state and county edges. The water is also white, so the shoreline and labels do the work of distinguishing Delaware Bay and the Atlantic. This treatment reproduces cleanly on ordinary monochrome printers.
Because the county names are already present, this version works well as a reference sheet, answer key, report illustration, or base for handwritten notes. Students can add Wilmington, Dover, beach communities, routes, or symbols while keeping New Castle, Kent, and Sussex visible. The limited tonal range also makes it easier to photocopy several times without relying on subtle color differences.
The portrait proportions suit document pages and classroom packets. For the clearest result, preserve the image’s aspect ratio and use a high-quality print setting when producing a large sheet. If the image must be reduced, check that the smallest labels remain legible before printing a complete set. The 3505×4920-pixel source offers flexibility, but final clarity also depends on the printer and chosen paper size.
Blank Delaware Outline Map for Custom Projects
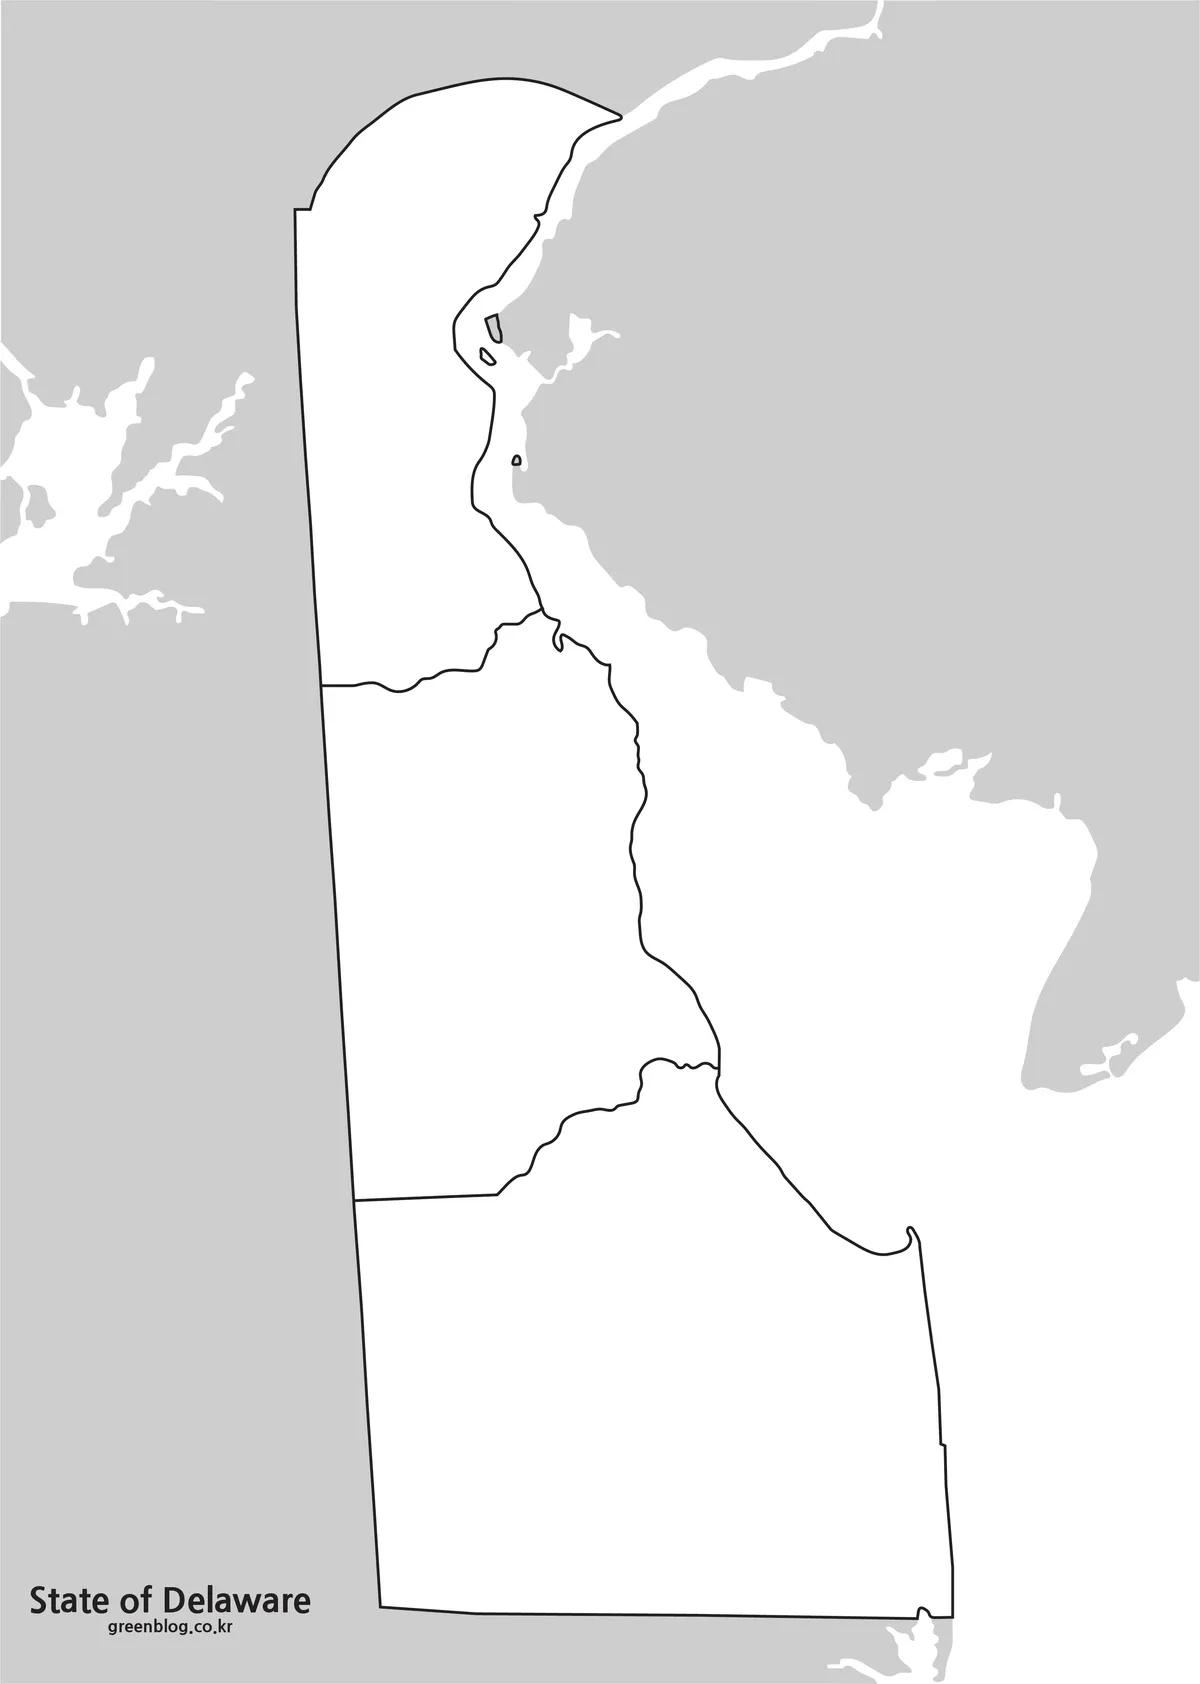
The outline Delaware map removes every geographic label and all county color while retaining the state’s outer border, the two internal county divisions, the coastline, and nearby shore shapes. It is the most flexible file in the set because it asks the user to supply the meaning. The same image can become a quiz, a coloring page, a route diagram, a service-area graphic, or a county-level data display.
Possible additions include:
- county names and a north arrow
- Wilmington, Dover, and selected coastal places
- travel routes between northern and southern Delaware
- county colors tied to a simple legend
- population, tourism, or land-use symbols
- labels for Delaware Bay and the Atlantic Ocean
For a worksheet, learners can first identify the three counties and then label the neighboring states and waters from memory. For an infographic, editors can duplicate the outline and apply one consistent color scale across multiple panels. Leaving the base uncluttered prevents old labels from conflicting with new information and makes the graphic easier to adapt for different audiences.
Choosing the Best Map Style
Choose the color Delaware map when readers must recognize county divisions quickly or when the image will appear on a screen. Choose black and white when labels are needed but printing cost, photocopying, or handwritten annotation matters. Select the outline for active learning and design work that requires new labels, colors, routes, or statistics. Since all three versions share the same geometry, they can also be paired: introduce the labeled image, complete the outline, and use the monochrome version to review the answers.
Practical Ways to Use the Collection
In a geography lesson, start with the Delaware map in color and ask learners to trace the sequence from New Castle through Kent to Sussex. Next, use the outline as a recall exercise. Adding Pennsylvania, Maryland, New Jersey, Delaware Bay, and the Atlantic Ocean encourages students to read the state as part of a coastal region rather than as three disconnected county shapes.
For planning and presentations, the outline can hold routes or selected locations while the labeled version provides a companion reference. A tourism graphic might distinguish northern city stops, central destinations, and southern beaches. A business graphic could show three county service areas. A report could place the black and white map beside a table so the geography supports the data without introducing unnecessary color.
Whichever style is selected, keep additions proportional to the small number of divisions. Three county fills, a short legend, and a limited set of markers are usually easier to read than a dense collection of callouts. The strength of this map set is its clear visual hierarchy: Delaware first, county boundaries second, and surrounding regional context third.
Frequently Asked Questions
How many counties are included in the Delaware map?
The map includes New Castle, Kent, and Sussex counties. Delaware has three counties in total.
Can the files be printed in A3 size?
Yes. The original images were prepared at 3505×4920 pixels with A3 printing in mind.
Which map works best for a school worksheet?
The black and white version is best for labeled reference sheets. The outline map is better for coloring, labeling, and annotation activities.
Can I edit the Delaware map?
The outline image provides a clean base for adding county colors, travel routes, city labels, statistics, and infographic elements.
Map File Information
This download includes printable Delaware map versions for lessons, document design, presentation graphics, and editable visual projects.
- Included Versions: Color, black and white, and outline
- Printable Size: A3 layout
Related Maps
Additional Resources
- Delaware FirstMap provides official statewide geographic data and interactive mapping resources for readers who need more detailed location information.
Green Map creates custom-edited map images using open geographic data sources such as geoBoundaries, Natural Earth, OpenStreetMap, and government open data.
These maps are edited visual materials, not raw data files, and are provided for education, documents, presentations, and graphic reference.