Macon County has a more balanced rural surface than a single label such as “farm county” or “forest county” would suggest. Agriculture covers 35.00% of the supplied 2025 map, forest 32.44%, and wetlands 17.47%. A broad wetland corridor runs through the middle of the county, while the largest built concentrations sit near the southern-central portion. This Macon County Georgia Land Cover Map shows how farms, woods, Flint River wetlands, and small city centers share the same landscape.
Four WebP views appear with the article: the current countywide classification, a forest-and-farmland version, fractional impervious surface, and the 1985–2025 endpoint comparison. The four original JPG files are bundled in one ZIP for reports, lessons, and presentations.
Table of Contents
The Flint River corridor is the feature that ties the center of the map together
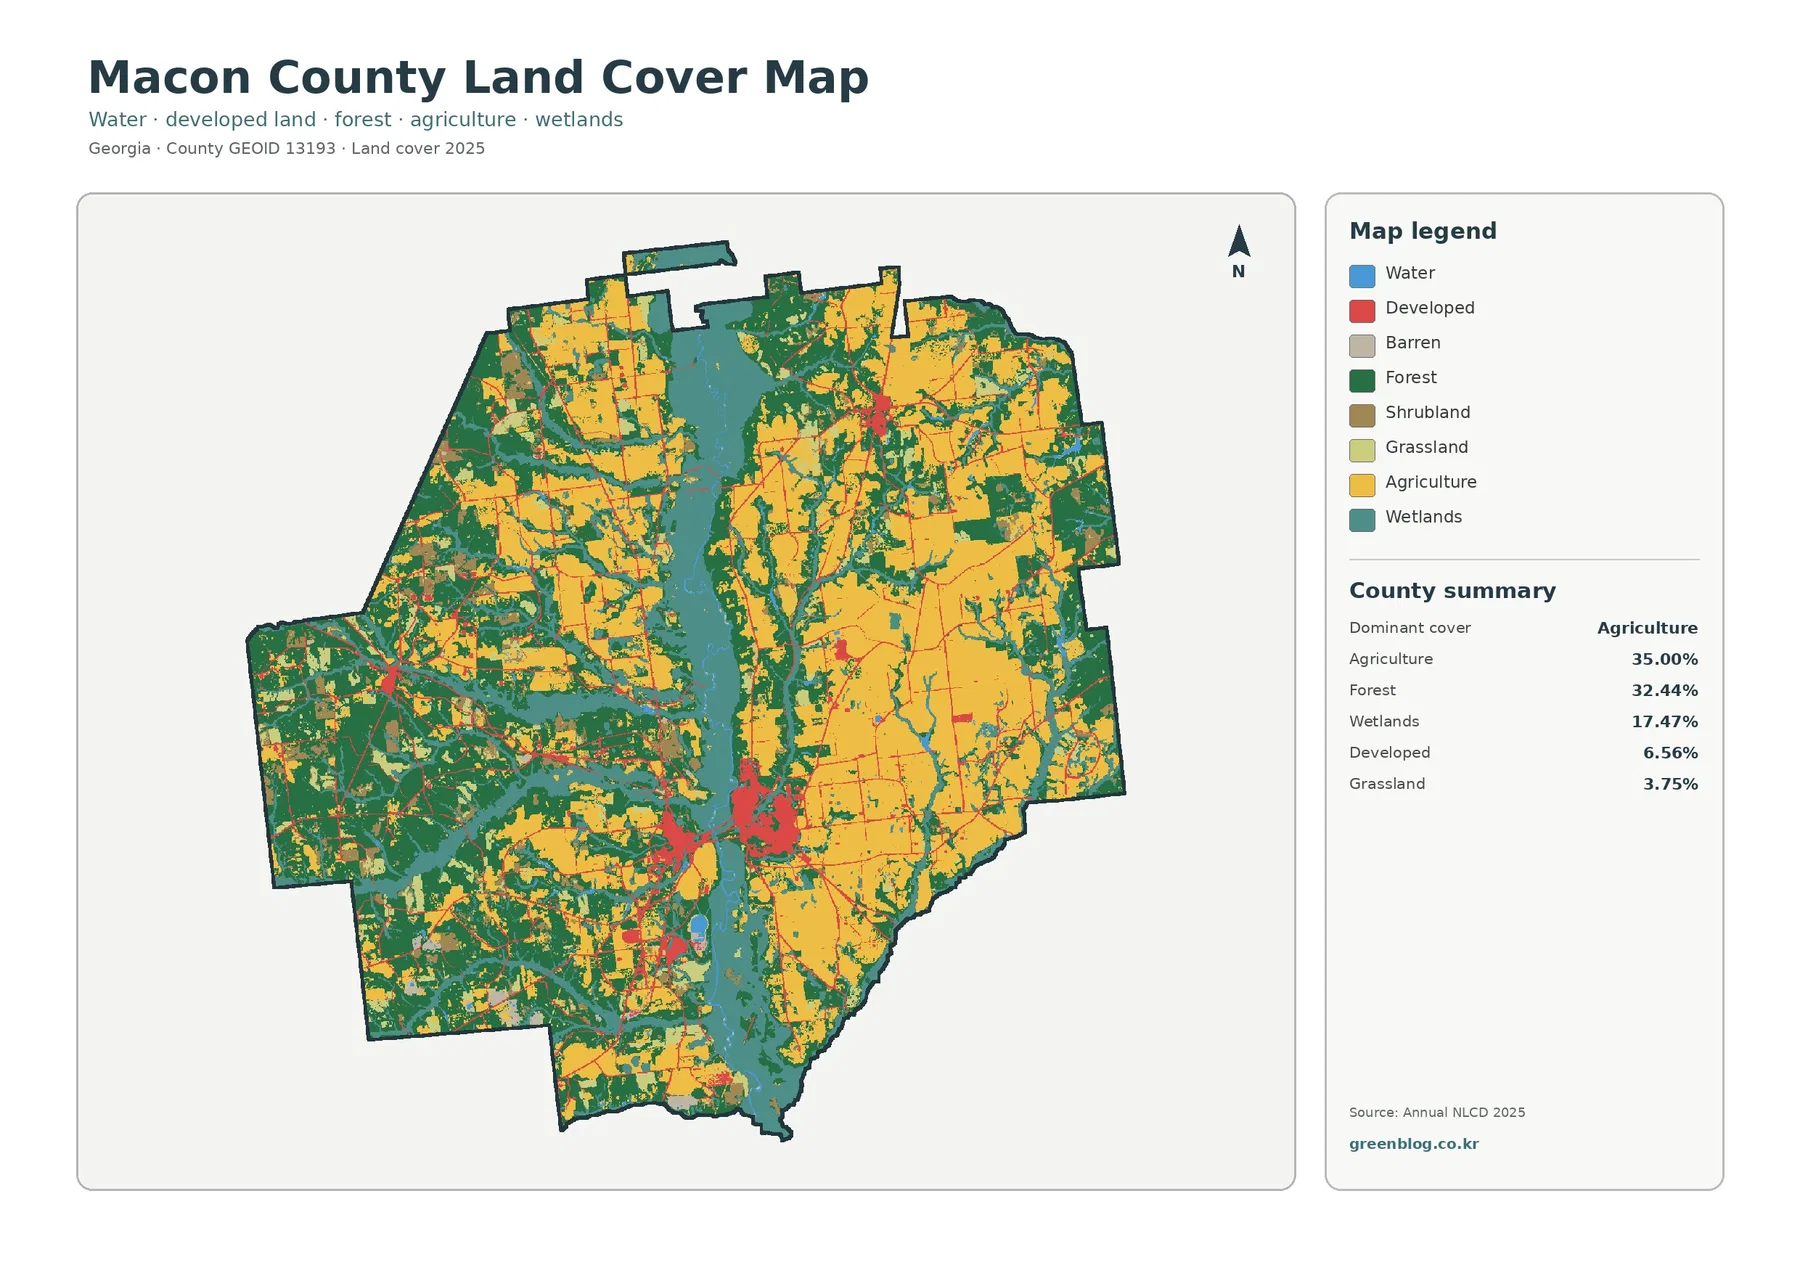
A long teal band occupies the center of the county from north to south and branches into surrounding rural areas. Wetlands account for 17.47%, making them the third-largest class after agriculture and forest. Macon County’s official Flint River page confirms that the river passes through the county and identifies public access points between Oglethorpe and Montezuma. That geography helps explain why the central wetland pattern deserves separate attention.
The teal cells should not be mistaken for open river water. Open water is only 0.77% in the focused vegetation summary, while wetland classes can include wooded or herbaceous vegetation and saturated ground. In other words, the visible Flint-related corridor is much broader than the exposed blue water surface. It is also not a legal wetland boundary or a flood-insurance map.
Developed land sits close to the wetland corridor in the southern-central county, but the raster does not identify municipal limits, levees, flood zones, or property lines.
Agriculture leads at 35.00%, yet forest remains almost as extensive
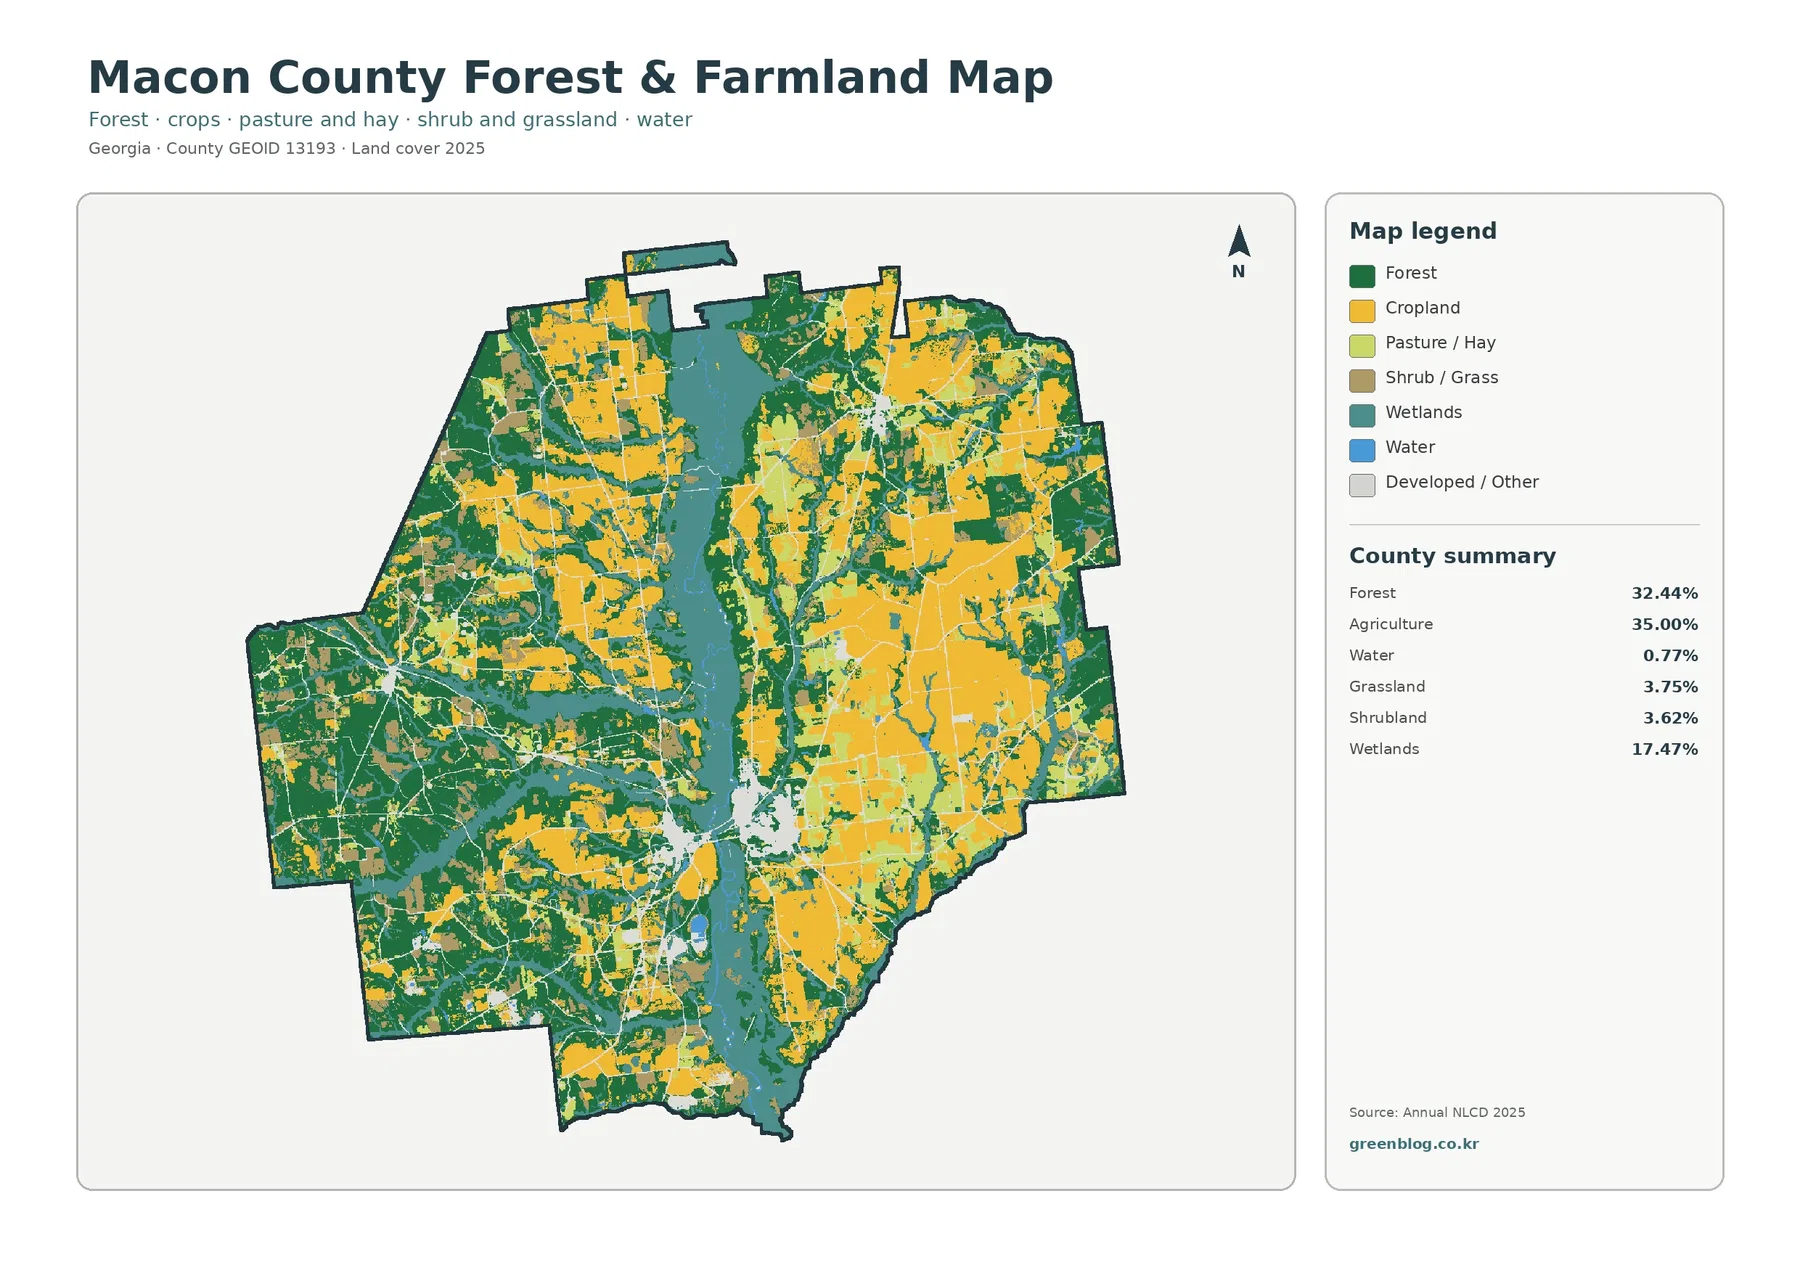
Yellow agricultural blocks are especially broad across the north and east, with additional farm areas through the center and south. They are not uninterrupted, however. Forest cuts through the agricultural pattern in large green pieces, and the wetland corridor divides many of the larger field groups. The map therefore shows an agricultural county whose farms are closely interwoven with woods and river-related wetlands.
Forest covers 32.44%, only a few percentage points below agriculture. The western and southwestern portions contain some of the largest continuous wooded blocks, while green corridors and patches also reach into the north and east. This distribution matters because it prevents the county from reading as one broad open plain. Even where fields dominate locally, wooded land is usually nearby.
Macon County describes diverse agriculture and agriculture-related businesses as the backbone of its economy, and the county Extension office provides agricultural and natural-resource support from Oglethorpe. Those sources match the map’s large agricultural share. They do not justify labeling a yellow pixel as a specific crop, dairy field, or poultry operation; the land-cover class is broader than a commodity inventory.
Oglethorpe and Montezuma give names to the main southern-central settlement pattern
Macon County officially lists four municipalities: Oglethorpe, Montezuma, Marshallville, and Ideal. Oglethorpe is the county seat, and its official county page places the city on the banks of the Flint River. Montezuma is also described as lying on the river’s east bank. These facts give useful place context to the developed groups near the southern-central part of the map.
The largest built group is not a single uniform patch. Several red concentrations sit close together, separated by wetland, open land, and road-like corridors. That pattern fits a pair of nearby settlement areas better than a single continuous city surface. Still, the land-cover image contains no city-limit lines, so the exact boundary between Oglethorpe, Montezuma, and unincorporated land must come from a verified political map.
Only a small fraction of the developed class is heavily impervious
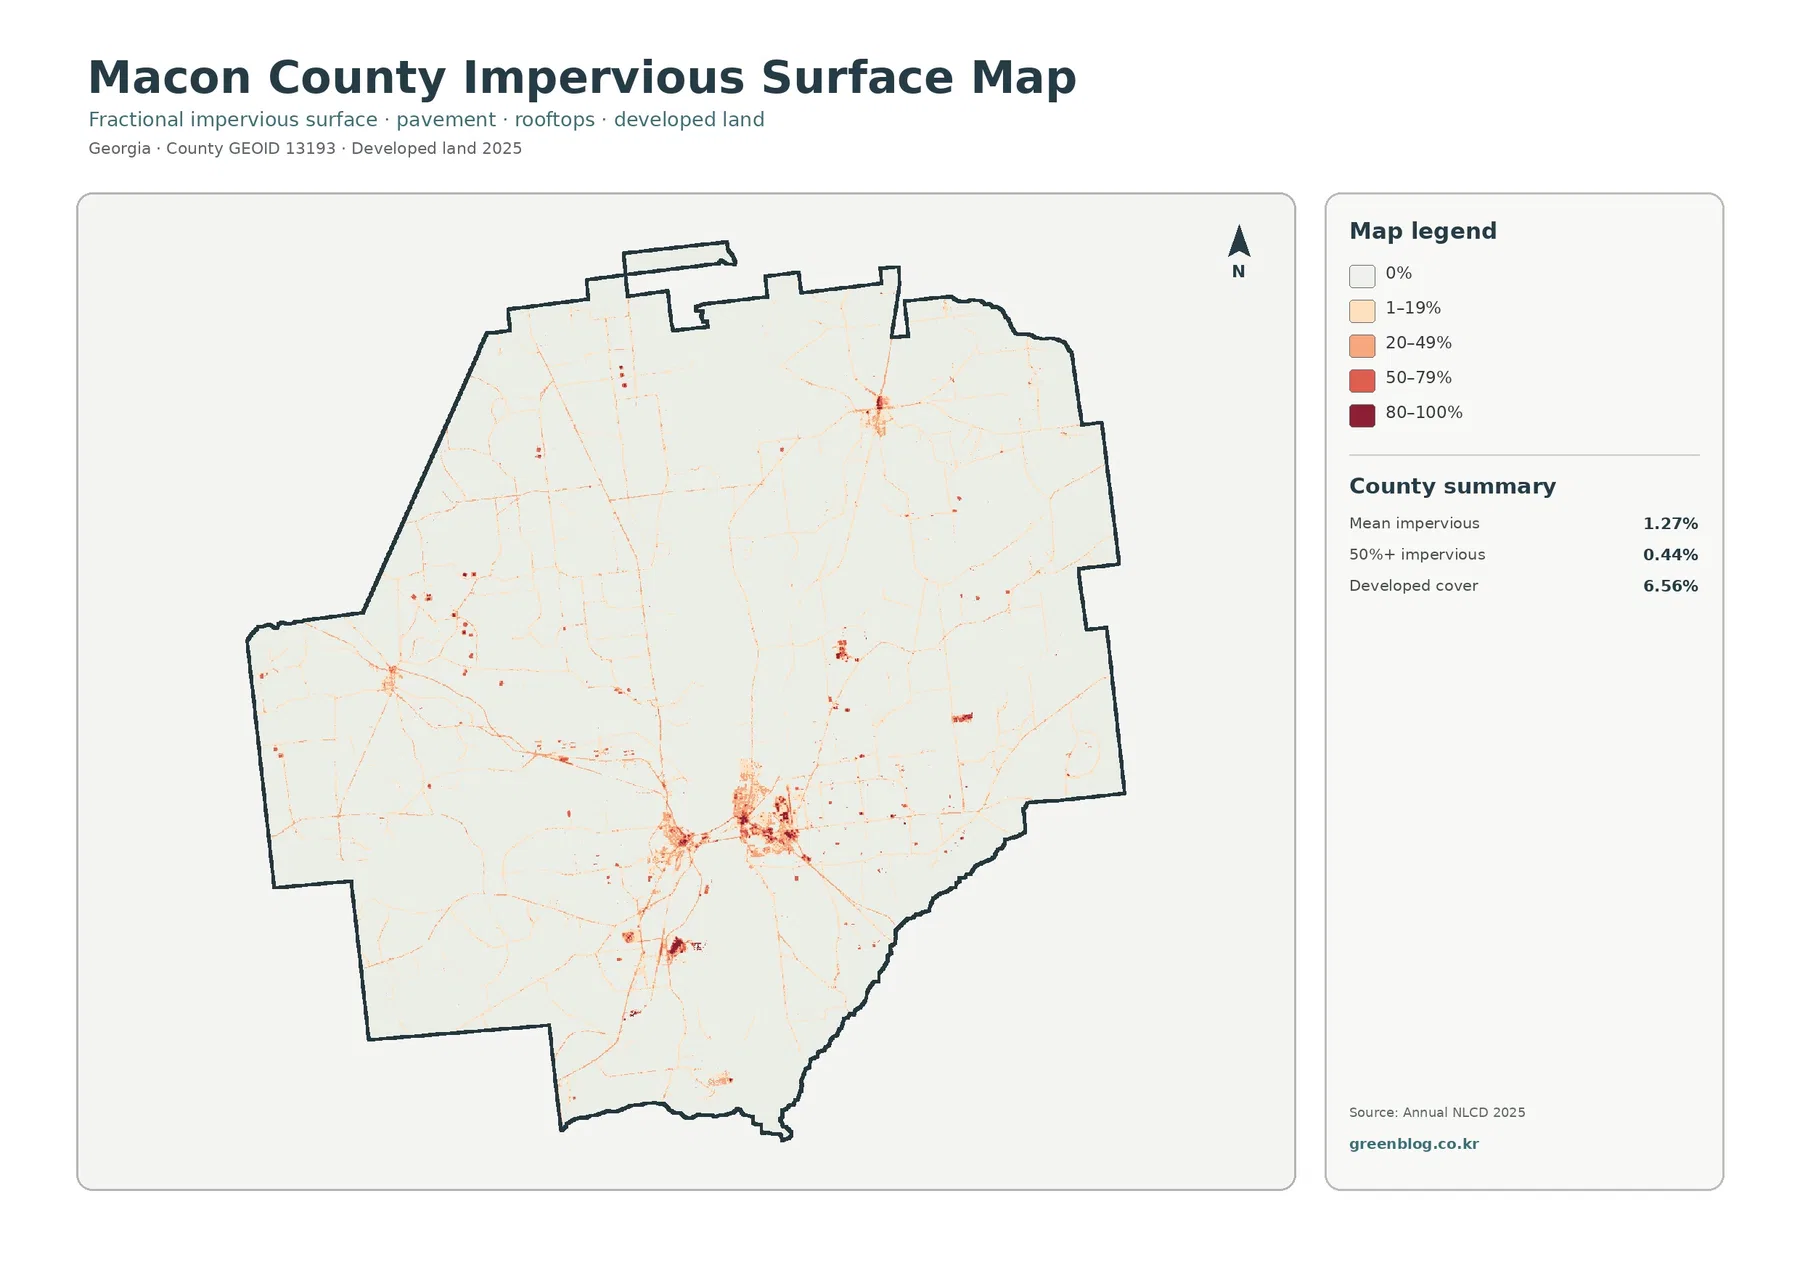
The hard-surface map turns the southern-central settlement area into a compact network of darker spots and thin connecting lines. A few smaller high-value groups appear to the northwest and northeast, while most farms, forest blocks, and wetlands remain white or nearly white. The result is a county with visible settlement nodes but relatively little continuous pavement outside them.
The mean impervious value is 1.27%, and 0.44% of the county is mapped at 50% impervious surface or higher. Developed land covers 6.56%, so the two numbers are measuring different things. Developed classes can include lawns, trees, yards, and bare soil, while the impervious product focuses on roofs, streets, parking areas, and other hard surfaces.
The 1985–2025 difference pattern is widespread even though developed change is limited
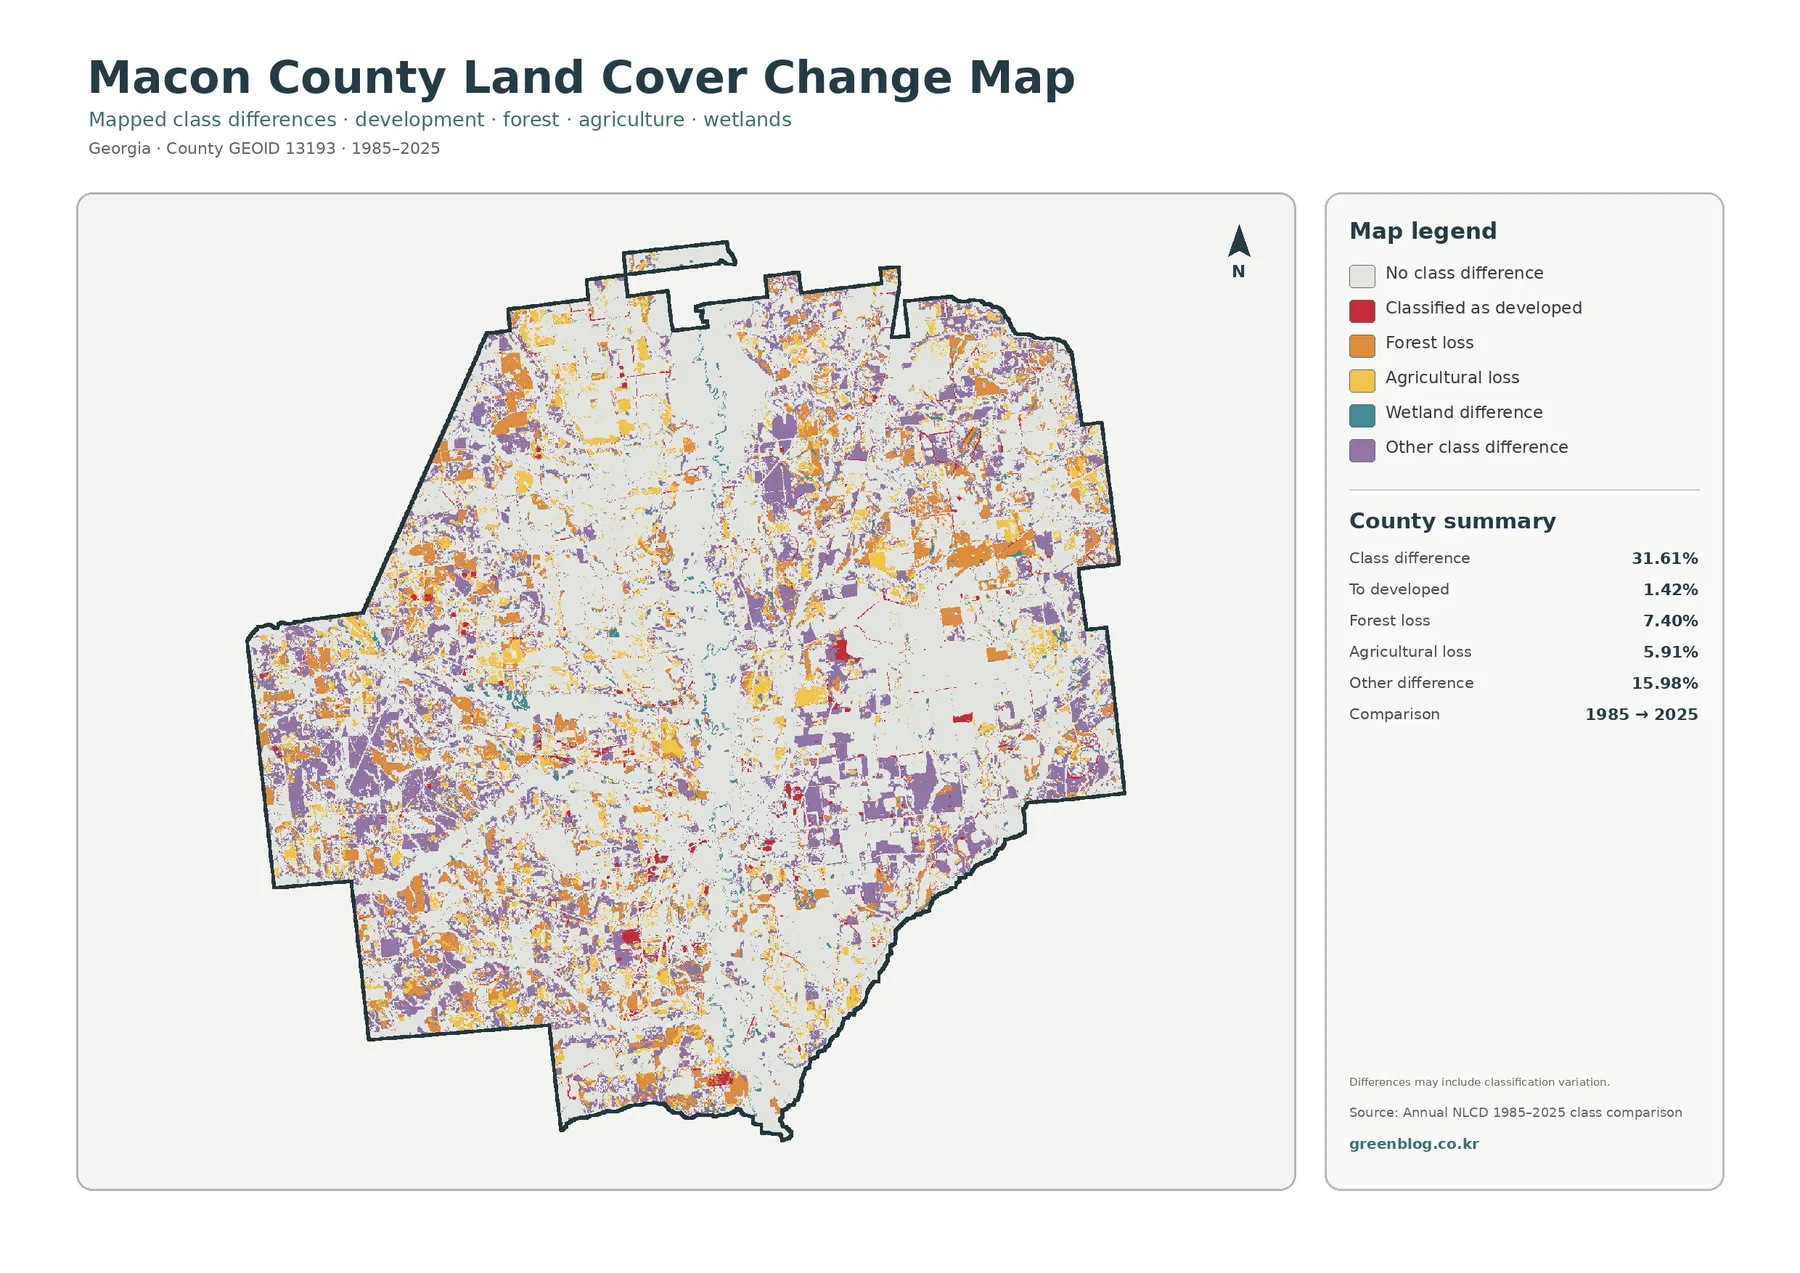
The total class difference between the 1985 and 2025 endpoints is 31.61%. That percentage describes raster cells whose class label differs between the two selected years. It is not an urbanization rate and should not be read as the share of Macon County that was damaged or permanently converted. The map notes that classification variation may be included.
The printed summary lists 1.42% classified to developed, 7.40% forest loss, 5.91% agricultural loss, and 15.98% other difference. Developed-change red is concentrated around the southern-central settlements and a handful of smaller sites. Forest-loss orange, agricultural-loss yellow, and other-difference purple are much more widely distributed across the county.
Wetland difference appears in the legend without a separately printed percentage. That missing number should not be recreated by subtracting the listed categories from 31.61% and then presented as an official rate. The labels also do not establish cause. A forest or agricultural cell may receive another classification for many reasons, and intermediate imagery is needed before assigning a specific explanation.
Thirty-meter classification is a county-scale reference, not a parcel survey
Annual NLCD uses 30-meter raster cells, so one square can contain several real surfaces even though it receives one predominant class. A narrow creek, thin tree row, field edge, small pond, or isolated building may be generalized when viewed at county scale. That is why the maps are strong for broad patterns but weak for drawing exact site boundaries.
Land cover is also separate from ownership, zoning, legal land use, and wetland jurisdiction. A yellow cell does not define a farm parcel, a green cell does not identify a timber owner, and a teal cell does not replace a regulatory wetland determination. Property or permitting decisions require current local, state, or federal records.
Choosing one or two maps usually makes the story clearer
Use the 2025 countywide map when the goal is to explain the balance among agriculture, forest, wetlands, and settlement. Switch to the vegetation map for a closer farm-versus-forest discussion, or to the impervious view when roofs and pavement are the main subject. The endpoint map belongs in a change discussion after the current landscape has already been established.
Frequently Asked Questions
What is the largest land-cover class in Macon County?
Agriculture is the largest class in the supplied 2025 summary at 35.00%, followed closely by forest at 32.44%. Wetlands add another 17.47%, giving the county a strongly mixed rural landscape.
Why is developed land 6.56% while mean impervious cover is only 1.27%?
The developed category includes more than pavement and rooftops. Trees, lawns, yards, and bare ground can occur inside developed classes, while the impervious layer isolates the hard surfaces that resist infiltration.
Does the 31.61% endpoint difference mean nearly one-third of the county was damaged?
No. The figure counts cells whose classification differs between 1985 and 2025. The summary separately lists 1.42% classified to developed, 7.40% forest loss, 5.91% agricultural loss, and 15.98% other difference.
Sources and Reference Data
- MRLC Annual NLCD Data – official access to annual land-cover and comparison products
- USGS Annual NLCD Land Cover Classification – definitions for agriculture, forest, wetlands, developed land, and related classes
- U.S. Census Bureau TIGER/Line Shapefiles – authoritative county, place, and transportation layers for comparison
- Macon County – The Flint River – official county context for the river corridor, local access points, and the Montezuma Bluff area
- Macon County – Municipalities – official listing of Oglethorpe, Montezuma, Marshallville, and Ideal
- UGA Extension – Macon County Agriculture & Natural Resources – local agriculture and natural-resource information and support
Map File Information
The ZIP contains four original JPG maps for comparing Macon County's 35.00% agricultural cover, 32.44% forest, Flint River wetlands, Oglethorpe-Montezuma development, impervious surfaces, and 1985–2025 class differences.
- Included Files: Four original JPG land-cover maps used in this article
- File Type: JPG images packaged in a ZIP archive
- Intended Use: Printing, education, presentations, and map-based projects
Related Maps
- Appling County Georgia Land Cover Map
- Atkinson County Georgia Land Cover Map
- Bacon County Georgia Land Cover Map
Green Map creates custom-edited map images using open geographic data sources such as geoBoundaries, Natural Earth, OpenStreetMap, and government open data. These maps are edited visual materials, not raw data files, and are provided for education, documents, presentations, and graphic reference.