Lumpkin County is overwhelmingly wooded in the supplied 2025 data. Forest covers 80.89%, while developed land accounts for 9.55% and agriculture 7.82%. The main built concentration sits south of the county’s center around the Dahlonega area, with smaller settled patches and road-like traces scattered through the surrounding forest. This Lumpkin County Georgia Land Cover Map is useful for comparing that compact developed pattern with the county’s much larger wooded landscape.
The page pairs four WebP previews with the discussion: current land cover, forest and farmland, fractional impervious surface, and the 1985–2025 endpoint comparison. Four original 2480 × 1754 JPG maps are available together in one ZIP for county profiles, classroom graphics, environmental presentations, and general reference.
Table of Contents
Dahlonega stands out because hard surfaces are scarce across most of the county
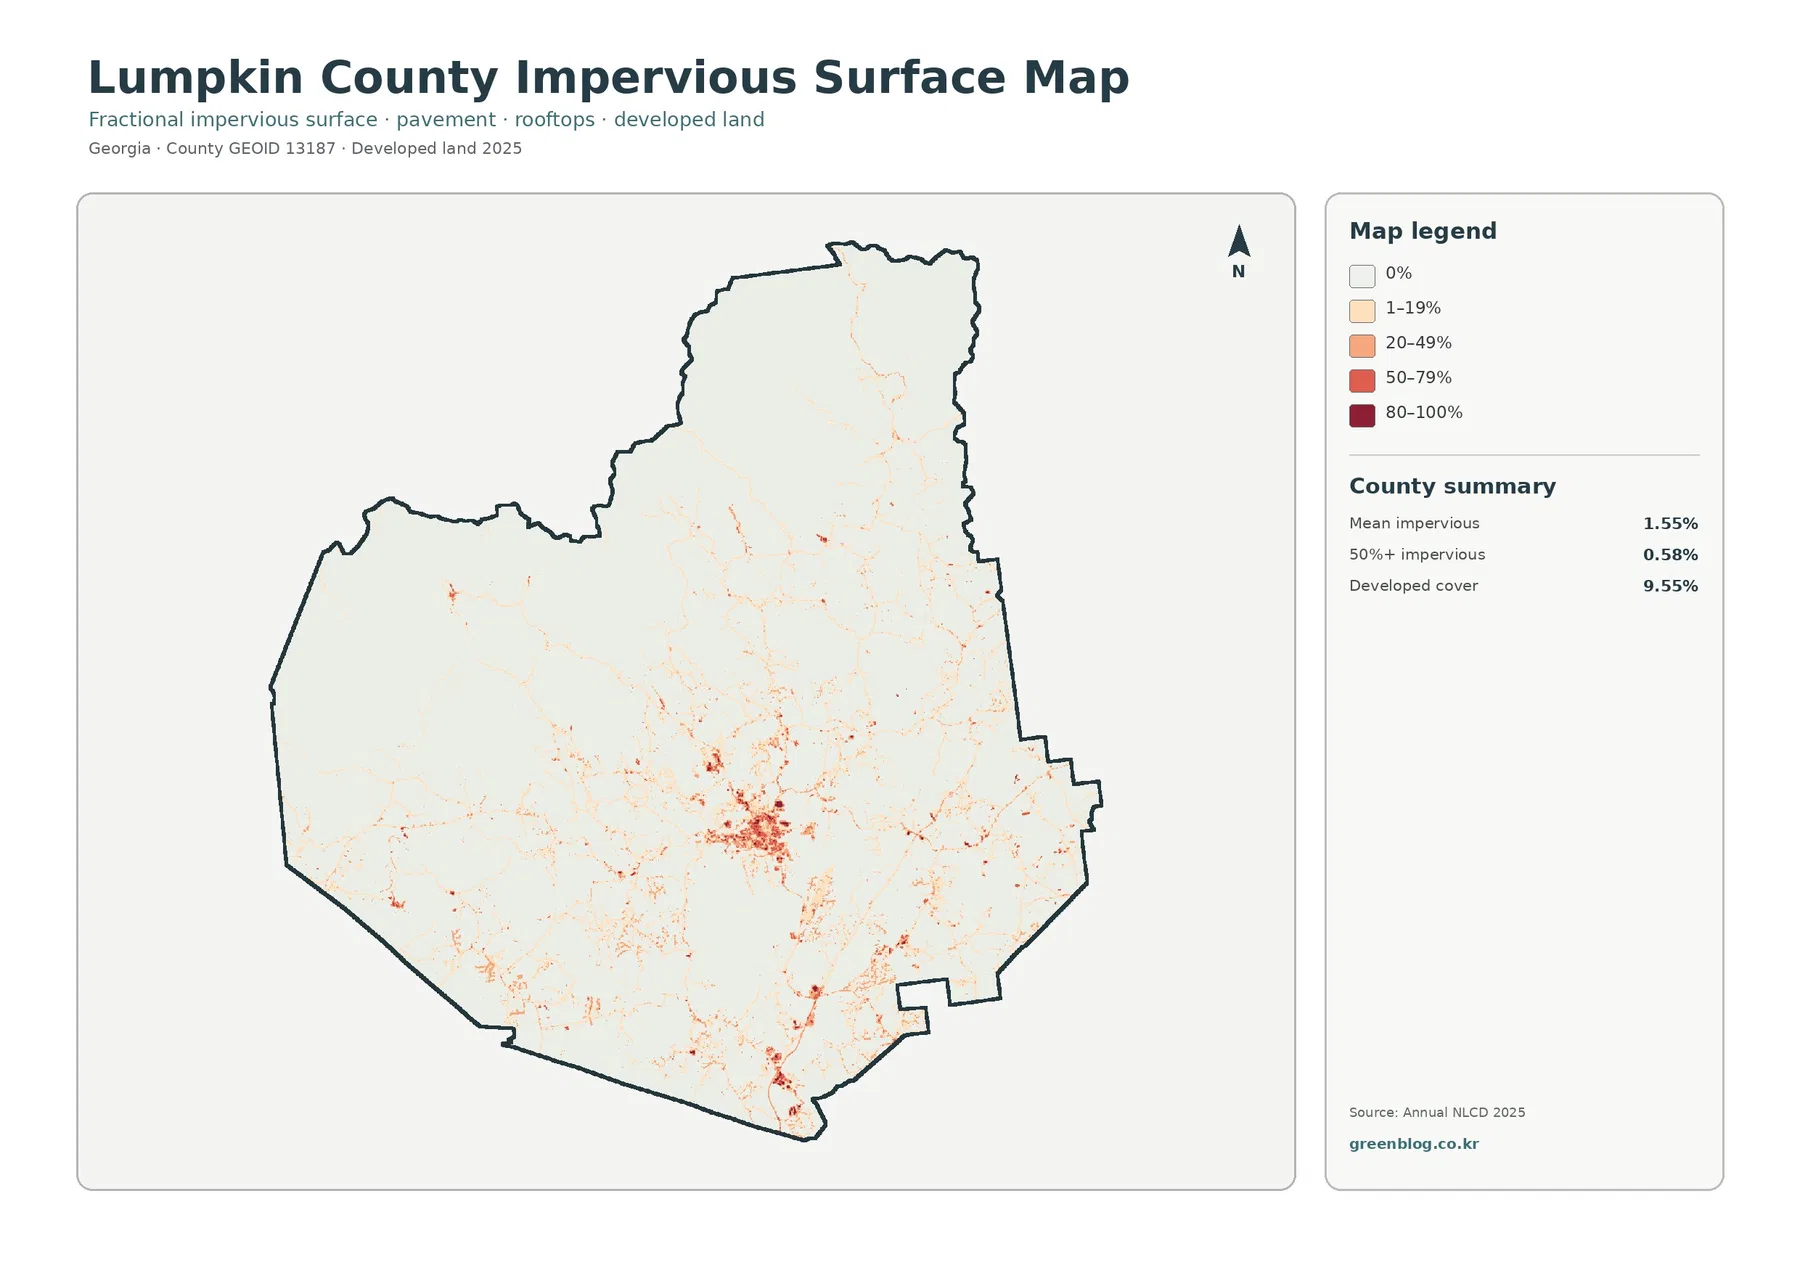
The impervious map makes the developed center easy to locate. Dark red and orange cells form a compact cluster south of the county’s midpoint, and lighter hard-surface traces extend away from it in several directions. Smaller concentrations appear near the southern edge and at scattered points east and west. The northern half is strikingly different: most cells are white or very pale because roofs and pavement occupy only a tiny share of that landscape.
Dahlonega is the county seat and lies in the foothills of the North Georgia mountains, according to the city government. That makes it a sensible geographic reference for the largest cluster, but the raster does not draw the city boundary. A dark cell should therefore be described as part of the Dahlonega-area pattern only when a separate place layer confirms the location.
The countywide mean impervious value is 1.55%, and just 0.58% of the county reaches 50% impervious cover or more. Developed land is 9.55%, a much broader category. A developed cell can still contain trees, lawns, yards, and bare soil, whereas the impervious product concentrates on roofs, pavement, parking lots, and other surfaces that shed rather than absorb water.
Lumpkin County maintains a separate GIS for roads, aerial photographs, addresses, LiDAR, and other location-based information. That distinction matters when a reader wants to identify a specific route or property. The hard-surface image is best for comparing intensity, not for assigning road names, parcel ownership, or municipal jurisdiction.
Forest is not just the largest class; it remains continuous across whole sections of the county
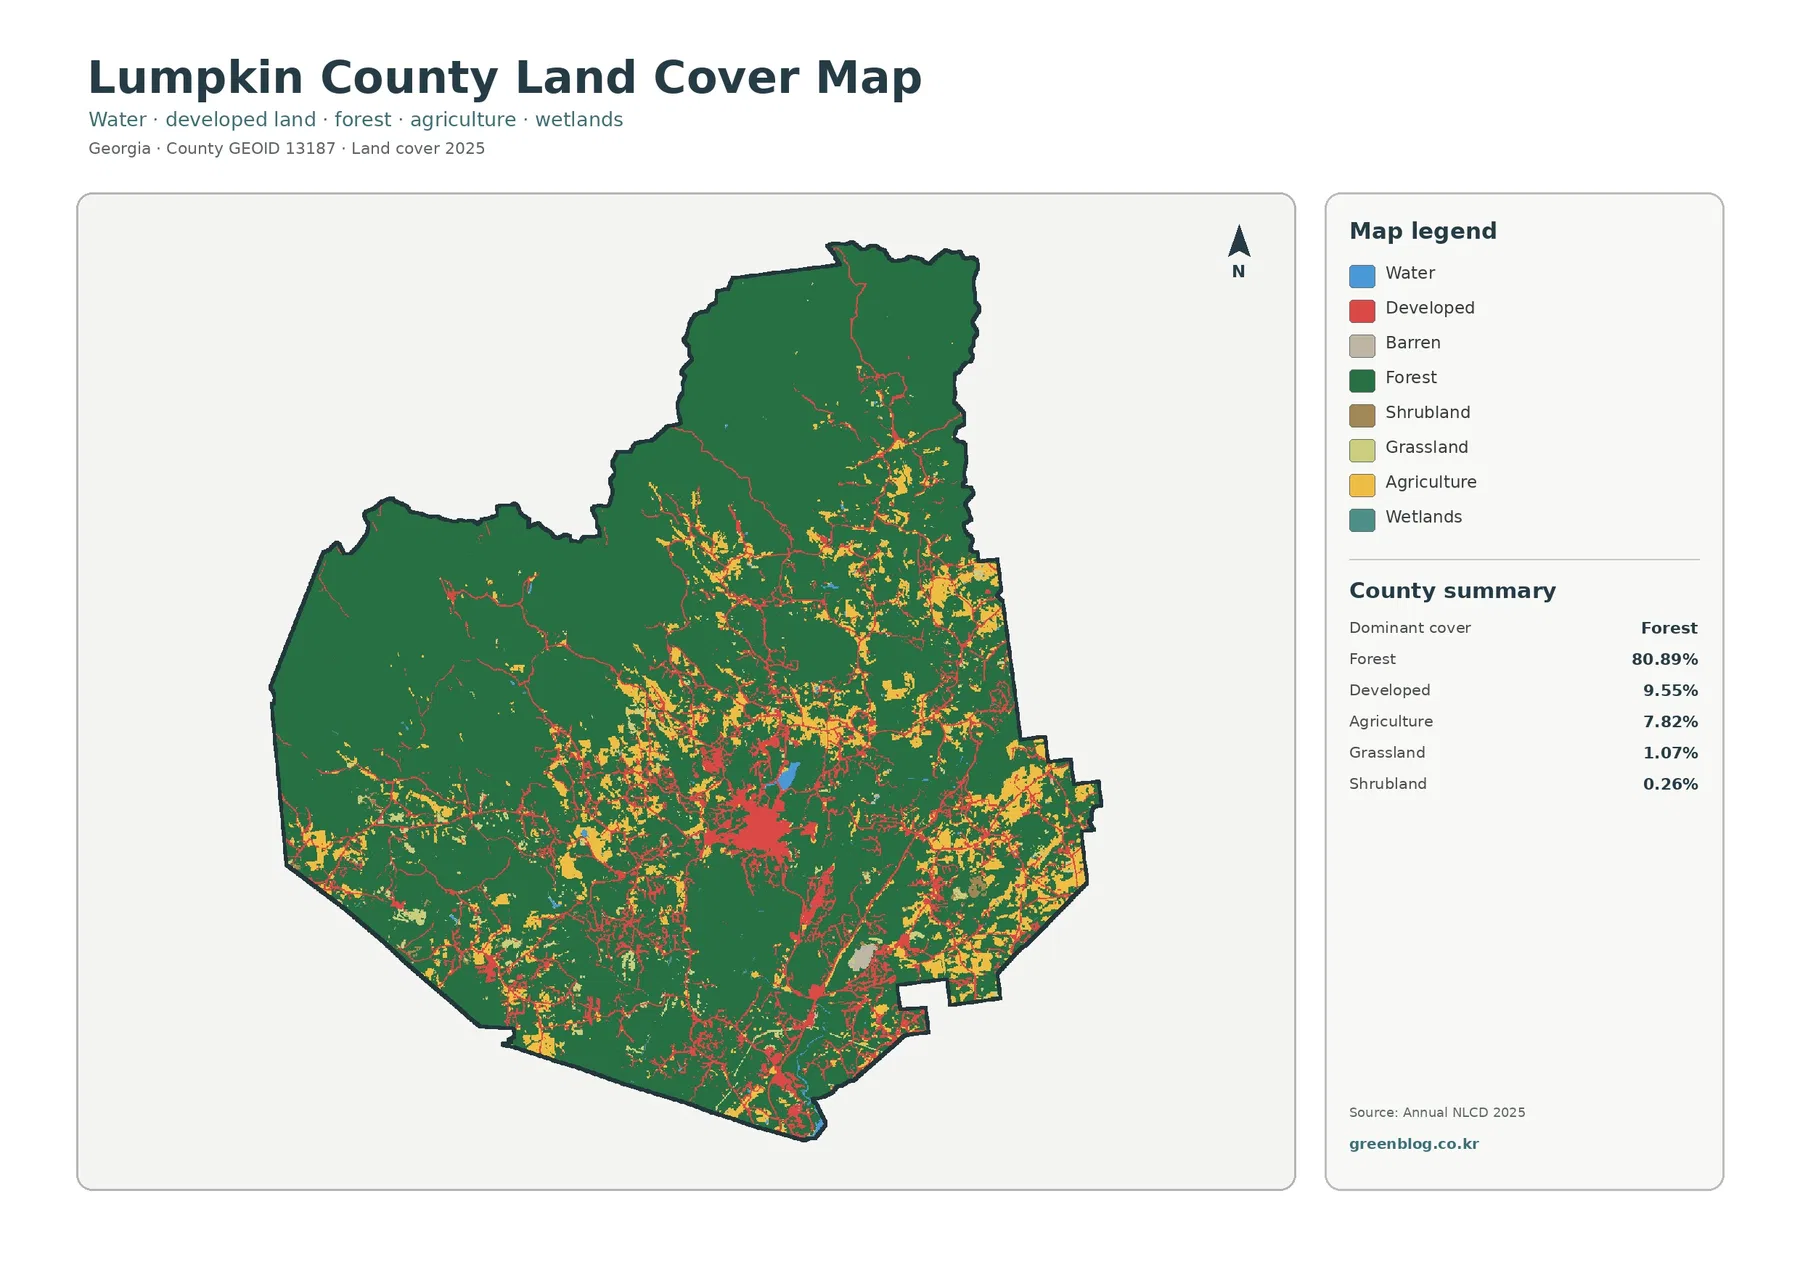
Forest covers 80.89%, and the map looks the part. The north is almost solid dark green, with another broad wooded mass across the west and southwest. Even in the more mixed center and east, green remains the background between agricultural openings and developed corridors. Development and farming therefore appear as interruptions within forest rather than as two large regions that divide the county.
Developed land at 9.55% is concentrated near the main center and along many narrow extensions. Agriculture covers 7.82% and is more common through the central, eastern, and southeastern portions. Grassland is 1.07% and shrubland 0.26%. Water at 0.25% and wetlands at 0.04% are very small in the focused vegetation summary, so neither is a leading countywide class.
Agriculture appears in openings around the center and east, not as a broad farm belt
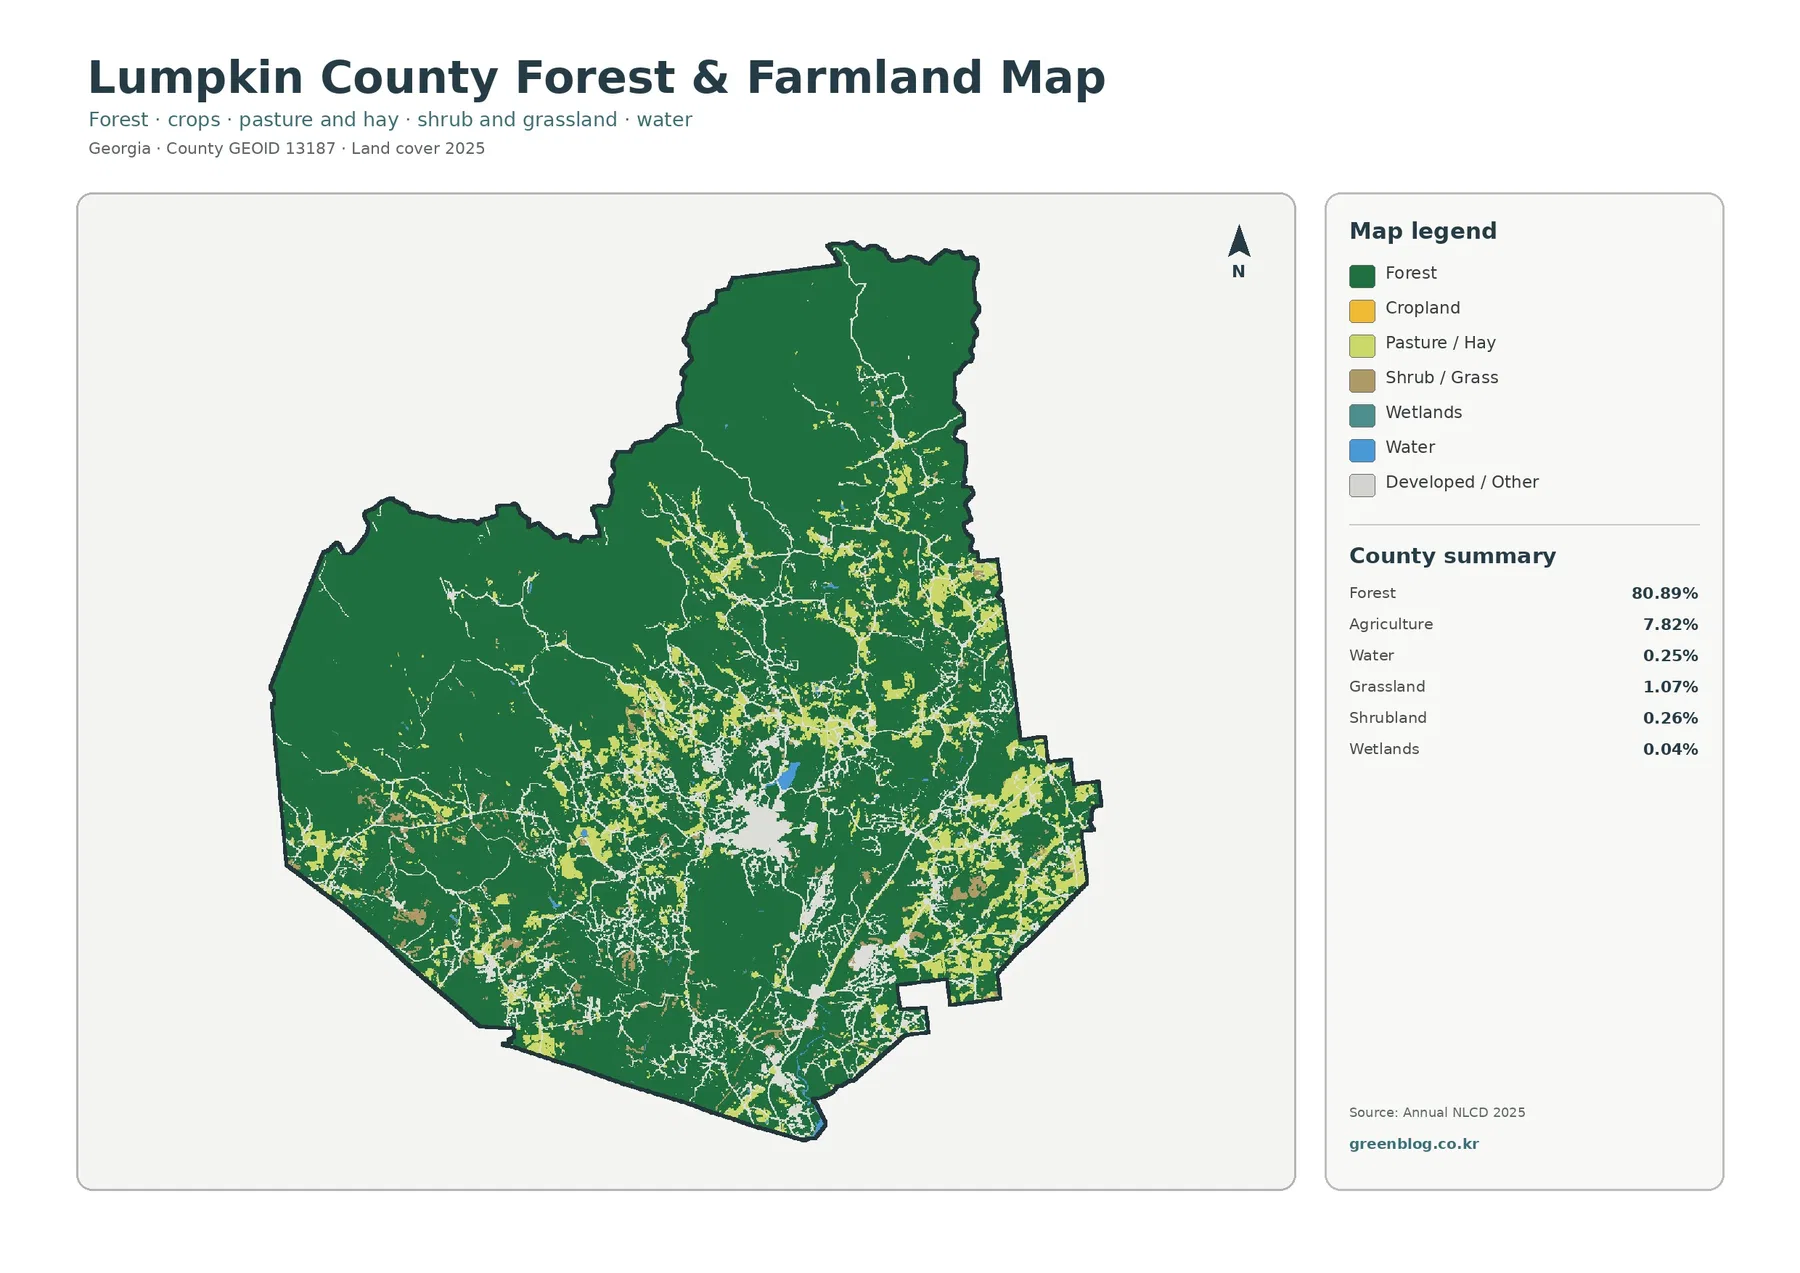
Once the red developed class is reduced, the agricultural pattern becomes much easier to see. Yellow areas form clusters east and northeast of the main developed center, continue into the southeast, and occur in smaller openings farther west. They are repeatedly separated by forest. The northern county has very little agricultural color by comparison, reinforcing the strong wooded divide between the upper part of the map and the more mixed center and south.
UGA Extension’s Lumpkin County office works with soil and water testing, small-farm startups, crop and pasture management, gardening, and other agricultural topics. Its local impact information also notes research involving wine grapes across North Georgia. Those sources establish that agriculture is part of the local economy and land management, but the 7.82% agriculture class cannot identify a particular vineyard, pasture, orchard, or crop from color alone.
The 1985–2025 endpoint map records 17.32% class difference, with most of it outside the developed category
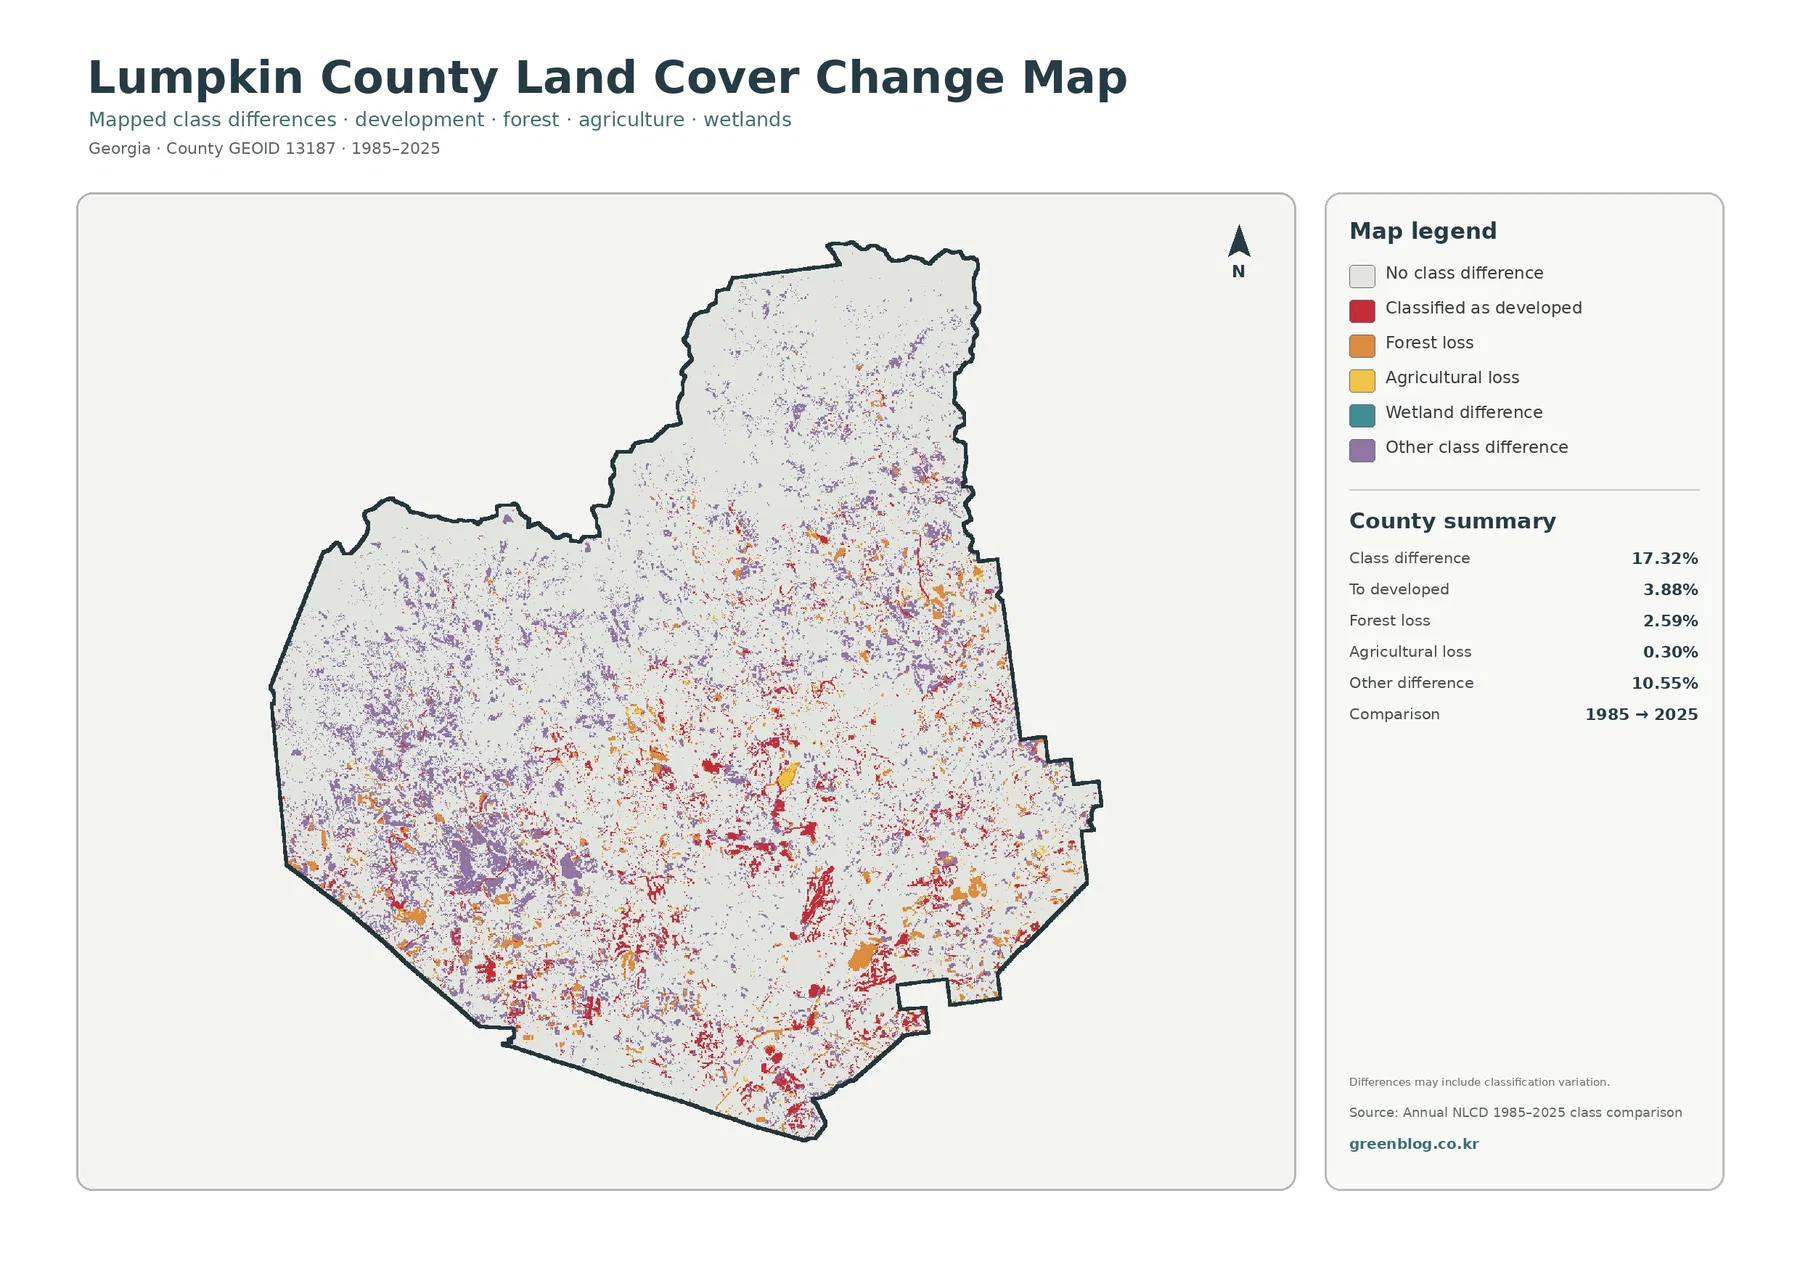
The map reports a total class difference of 17.32% between the 1985 and 2025 endpoints. That value describes raster cells whose category changed between the two selected years. It is not a statement that 17.32% of Lumpkin County was damaged, cleared, or built over. Differences in image timing, seasonal appearance, mixed land cover within a cell, and classification decisions can contribute to the endpoint result.
The printed summary assigns 3.88% to developed, 2.59% to forest loss, 0.30% to agricultural loss, and 10.55% to other difference. Red developed-change cells are most visible around the main Dahlonega-area cluster and along several south-central extensions. Orange forest-loss cells are scattered through the center and east, while purple other-difference cells occur over a wider portion of the west, north, and central county.
A wetland-difference category appears in the legend, but the summary does not print a separate percentage for it. No missing rate should be invented from the remaining total. “Forest loss” also deserves careful wording: the class says that an earlier forest cell received another label in 2025, not why that happened. Timber activity, development, vegetation change, storm effects, or classification variation require additional evidence.
Mountain-forest context should not be confused with ownership or zoning
Lumpkin County’s official profile places the county in the foothills of the Blue Ridge Mountains and notes that a large share falls within the Chattahoochee National Forest. Those facts are useful context for the forest-heavy map, but land cover and land ownership are different layers. A dark-green cell only says forest is the predominant mapped surface; it does not identify a federal boundary, conservation status, timber plan, or private parcel.
Annual NLCD uses 30-meter raster cells, so small features are generalized. A narrow stream, isolated home, thin tree line, or small field may be represented imperfectly when several surfaces occupy the same cell. The 2025 view is also a snapshot; construction, clearing, regrowth, or agricultural changes after the observation year may not be present.
Use each map for a different question before downloading the JPG set
The countywide 2025 map works best when the goal is to introduce Lumpkin County’s forest dominance and the position of its main developed and agricultural areas. The vegetation view is better for comparing the limited farmland openings with the larger wooded blocks. The impervious image answers a narrower question about roofs and pavement, while the endpoint map should be reserved for discussing classification differences between 1985 and 2025.
Frequently Asked Questions
How much of Lumpkin County is forest in the 2025 map?
Forest is the dominant class at 80.89%. It covers nearly all of the north and large portions of the west, while development and agriculture are concentrated more heavily in the central, eastern, and southern parts of the county.
Why is developed land 9.55% but mean impervious cover only 1.55%?
The developed category can include yards, trees, lawns, and bare soil around roads and buildings. The impervious product measures the harder surfaces such as roofs, pavement, and parking areas, so the countywide average is much lower.
Does the 17.32% class difference mean that much forest was lost?
No. The 17.32% figure includes every mapped category difference between the 1985 and 2025 endpoints. The summary separately lists 3.88% classified to developed, 2.59% forest loss, 0.30% agricultural loss, and 10.55% other difference.
Sources and Reference Data
- MRLC Annual NLCD Data – official access to annual land-cover and comparison products
- USGS Annual NLCD Land Cover Classification – definitions for forest, developed land, agriculture, and related classes
- U.S. Census Bureau TIGER/Line Shapefiles – authoritative county, place, and transportation layers for comparison
- Lumpkin County – Profile of the County – official county context on the Blue Ridge foothills and the Chattahoochee National Forest share
- Lumpkin County GIS – official mapping resources for roads, aerial imagery, addresses, LiDAR, and related location data
- UGA Extension – Lumpkin County Agriculture & Natural Resources – local soil, water, small-farm, crop, pasture, and natural-resource services
Map File Information
The ZIP contains four original JPG maps for comparing Lumpkin County's 80.89% forest cover, Dahlonega-area development, agricultural openings, impervious surfaces, and 1985–2025 class differences.
- Included Files: Four original JPG maps: current land cover, forest and farmland, impervious surface, and 1985–2025 endpoint comparison
- File Type: JPG files in one ZIP archive
- Intended Use: Printing, education, presentations, and map-based projects
Related Maps
- Appling County Georgia Land Cover Map
- Atkinson County Georgia Land Cover Map
- Bacon County Georgia Land Cover Map
Green Map creates custom-edited map images using open geographic data sources such as geoBoundaries, Natural Earth, OpenStreetMap, and government open data. These maps are edited visual materials, not raw data files, and are provided for education, documents, presentations, and graphic reference.