Tift County sits in south-central Georgia, where Tifton forms the clear center of the county’s road and settlement pattern. The four supplied maps let you move from that broad orientation to more specific questions: where Omega and Ty Ty lie in relation to Tifton, how the Little River and Alapaha River systems cross the county, and where elevations rise or fall between roughly 69 and 125 meters. A ZIP containing four original A3 high-resolution JPG maps is available in the map file box below, so the page works both as an on-screen reference and as a source for larger printable files.
The county is easiest to understand when Tifton is used as the starting point. Interstate 75 passes through the central part of the county, several other numbered roads spread outward from the city, and the developed area around Tifton is much larger than the smaller places at Omega and Ty Ty. Once the water and elevation layers are added, however, the county no longer looks like a simple flat road network. Stream valleys cut through the uplands, and the lower corridors along the Little River and its tributaries stand out clearly against higher ground to the north and northeast.
Table of Contents
Tifton as the Center of the Road Network
The general county map makes Tifton’s role immediately visible. I-75 runs north-south through the central part of Tift County, while routes marked 41 and 125 approach the city from the north and south and the 82/520 corridor stretches east-west. The map also shows the 319/35 route entering from the southwest. Rather than following a single straight corridor, the main roads meet around Tifton and then fan out toward several sides of the county, which makes the city the most useful reference point for understanding local movement.
The developed footprint around Tifton is also much broader than the smaller built-up areas shown elsewhere. The map labels Tift Regional Medical Center and an agricultural institution in the city area, matching the existing county material that describes Tifton as a center for agriculture, education, medical services, and transportation. These labels are useful for orientation, but the map is not intended to show every local street, parcel line, or individual service location. It works best for county-scale relationships rather than address-level navigation.
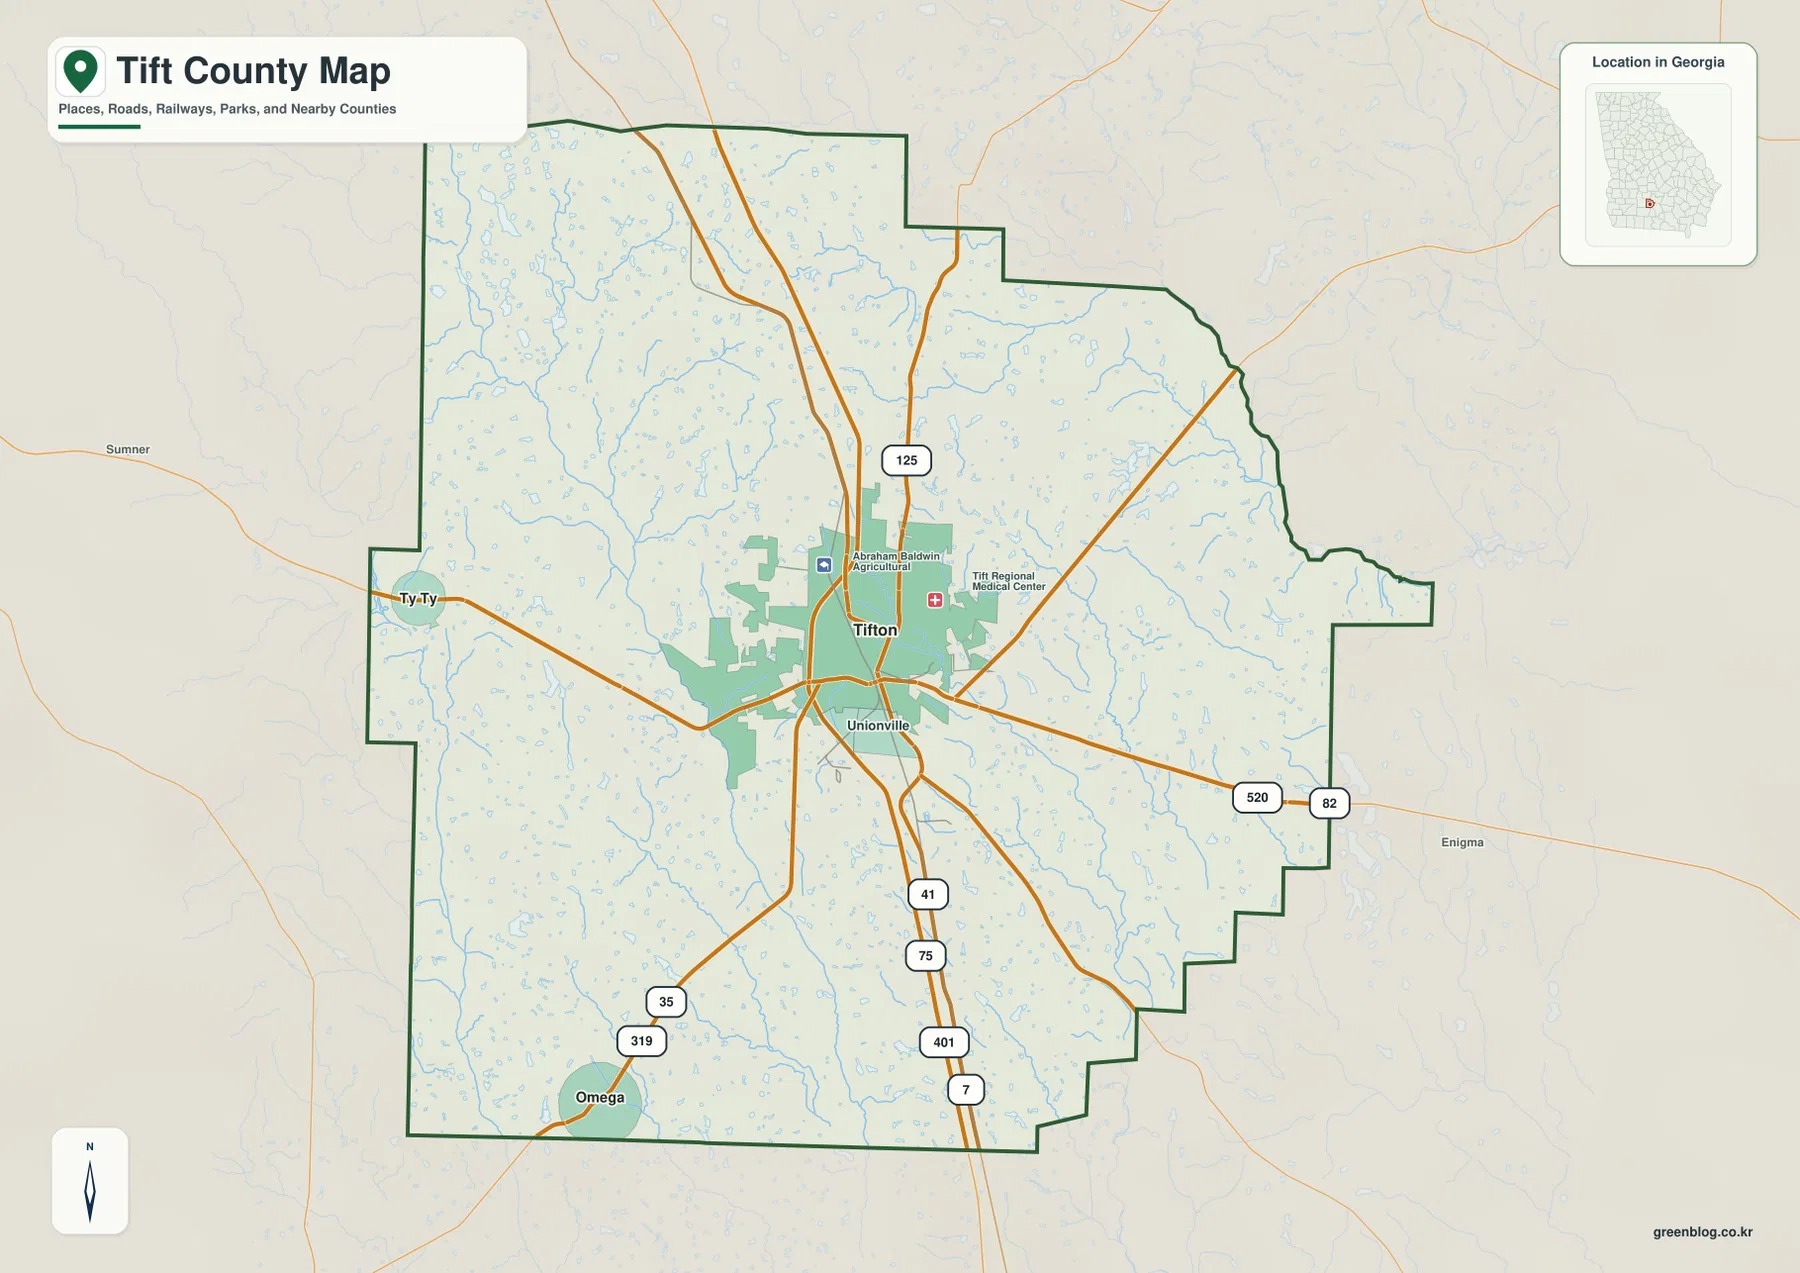
The county boundary gives additional context. Turner County is shown to the north, Worth County to the northwest, and Colquitt and Cook counties along the western and southwestern sides. Irwin County lies to the east and northeast, while Berrien County appears along the southeastern side. The eastern and southeastern edges of Tift County include several stepped boundary segments rather than one smooth line, so the outline itself is a useful visual cue when comparing Tift with its neighbors.
Omega and Ty Ty Around the Tifton Hub
The city-connection map strips away some detail and focuses on three labeled places. Tifton is marked as the hub, Ty Ty lies to the west, and Omega sits near the southwestern edge of the county. The map gives direct-distance figures of about 8 miles from Tifton to Ty Ty and about 10 miles from Tifton to Omega. Those numbers are straight-line map distances, not driving mileage, so they are best used to compare spacing rather than to estimate travel time.
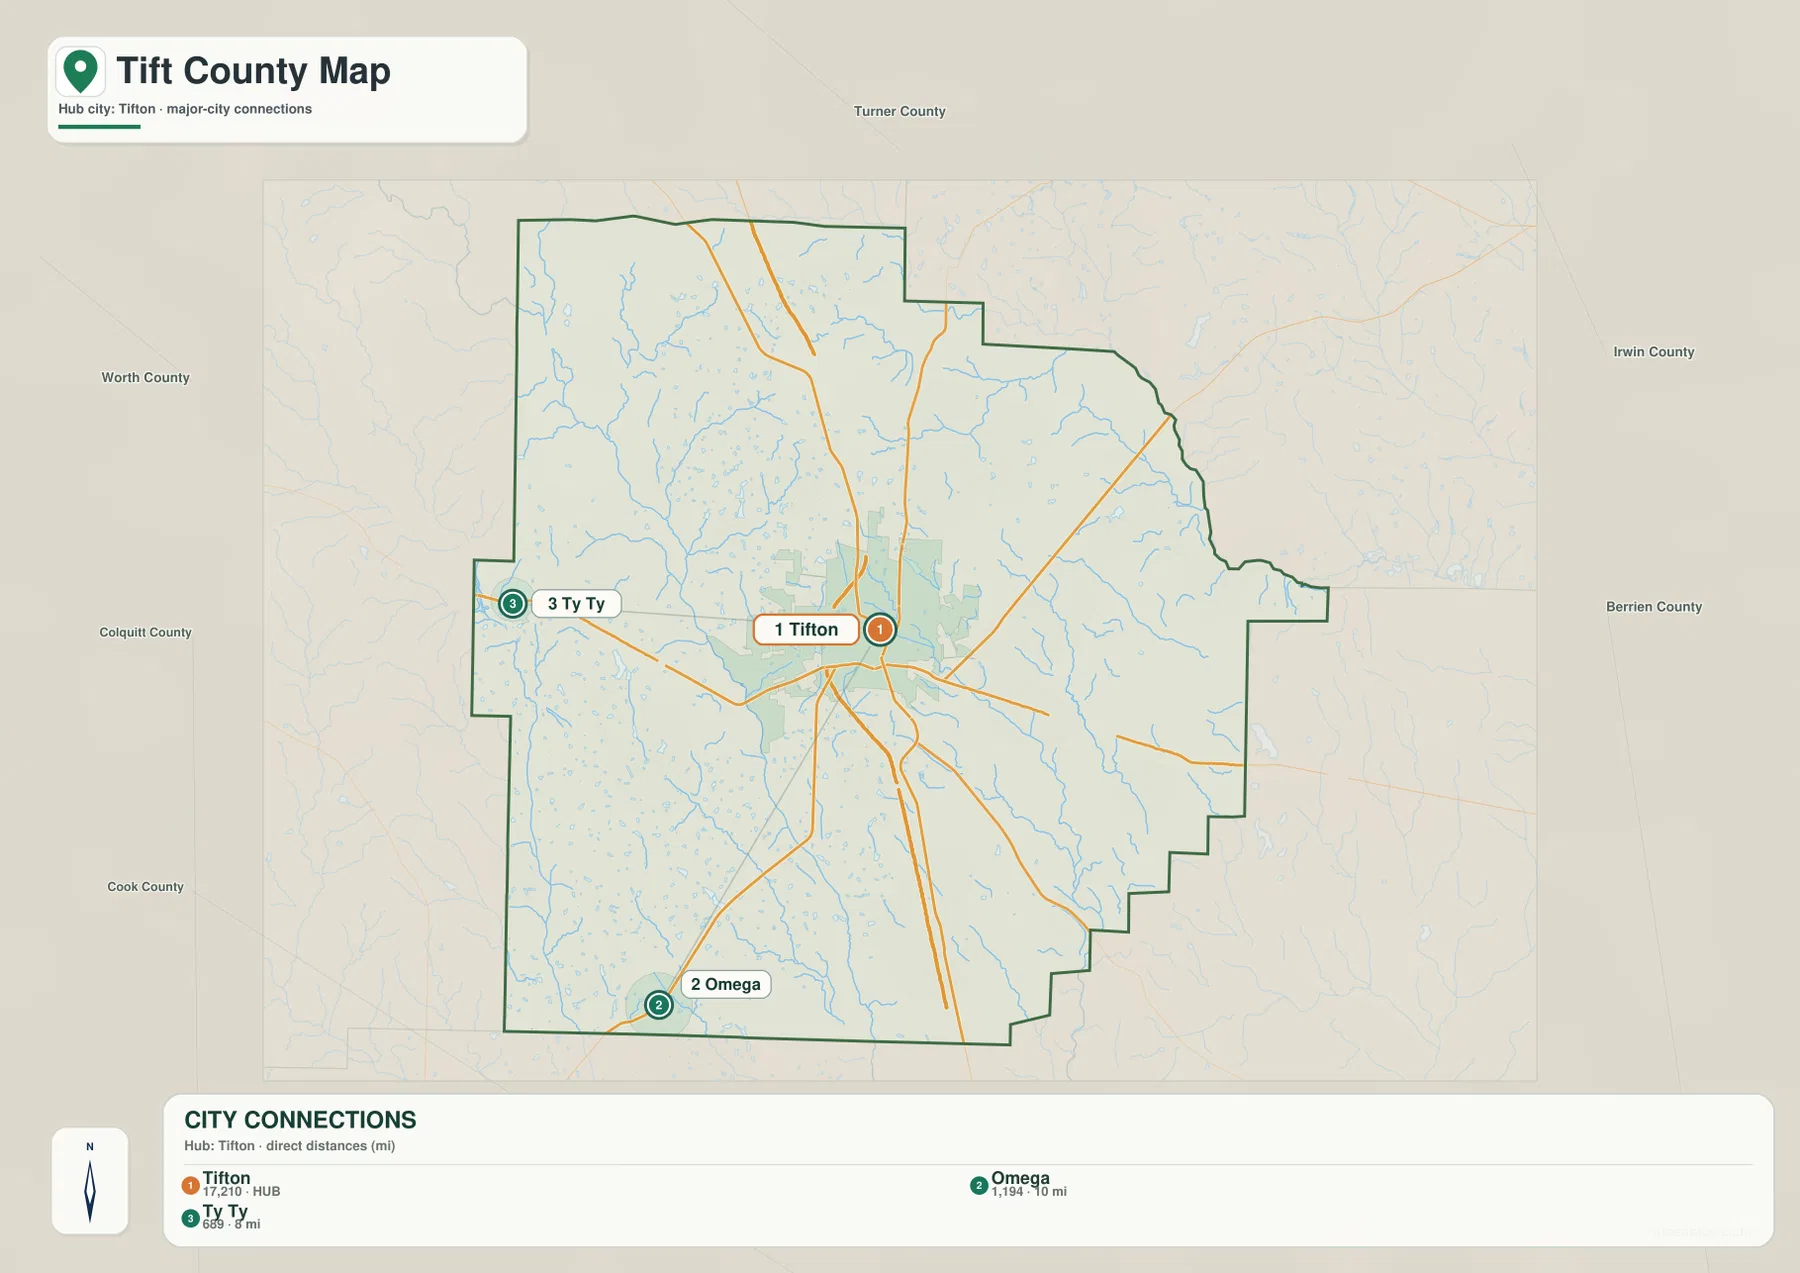
This simplified view is especially helpful when the goal is to explain settlement distribution. Ty Ty is close to the western side of the county and connects visually with the road that runs west from Tifton. Omega is farther south and west, near the county’s lower boundary. Tifton, by contrast, is surrounded by a denser network of roads and development. The pattern shows that the county is not organized around several equally sized centers; the supplied map instead presents one dominant hub with smaller incorporated places at greater distances from it.
The neighboring-county labels also help place those communities in a wider setting. Worth and Colquitt counties are on the western side of the map, Cook County lies farther southwest, and Irwin and Berrien counties are to the east. This matters when reading Omega and Ty Ty because their positions make more sense when the county is seen as part of a larger south Georgia network rather than as an isolated outline.
Little River, Alapaha River, and a Dense Web of Creeks
The water map reveals a different structure from the road map. The Little River runs through the western-central part of the county and continues southward, while the Alapaha River is labeled along the eastern side. New River appears in the southeast. Between those larger channels, the map names Middle Creek, Little Creek, Gum Creek, Arnold Creek, and Ty Ty Creek, along with many smaller unnamed tributaries. The result is a fine-grained network of drainage lines that divides the county into numerous shallow valleys.
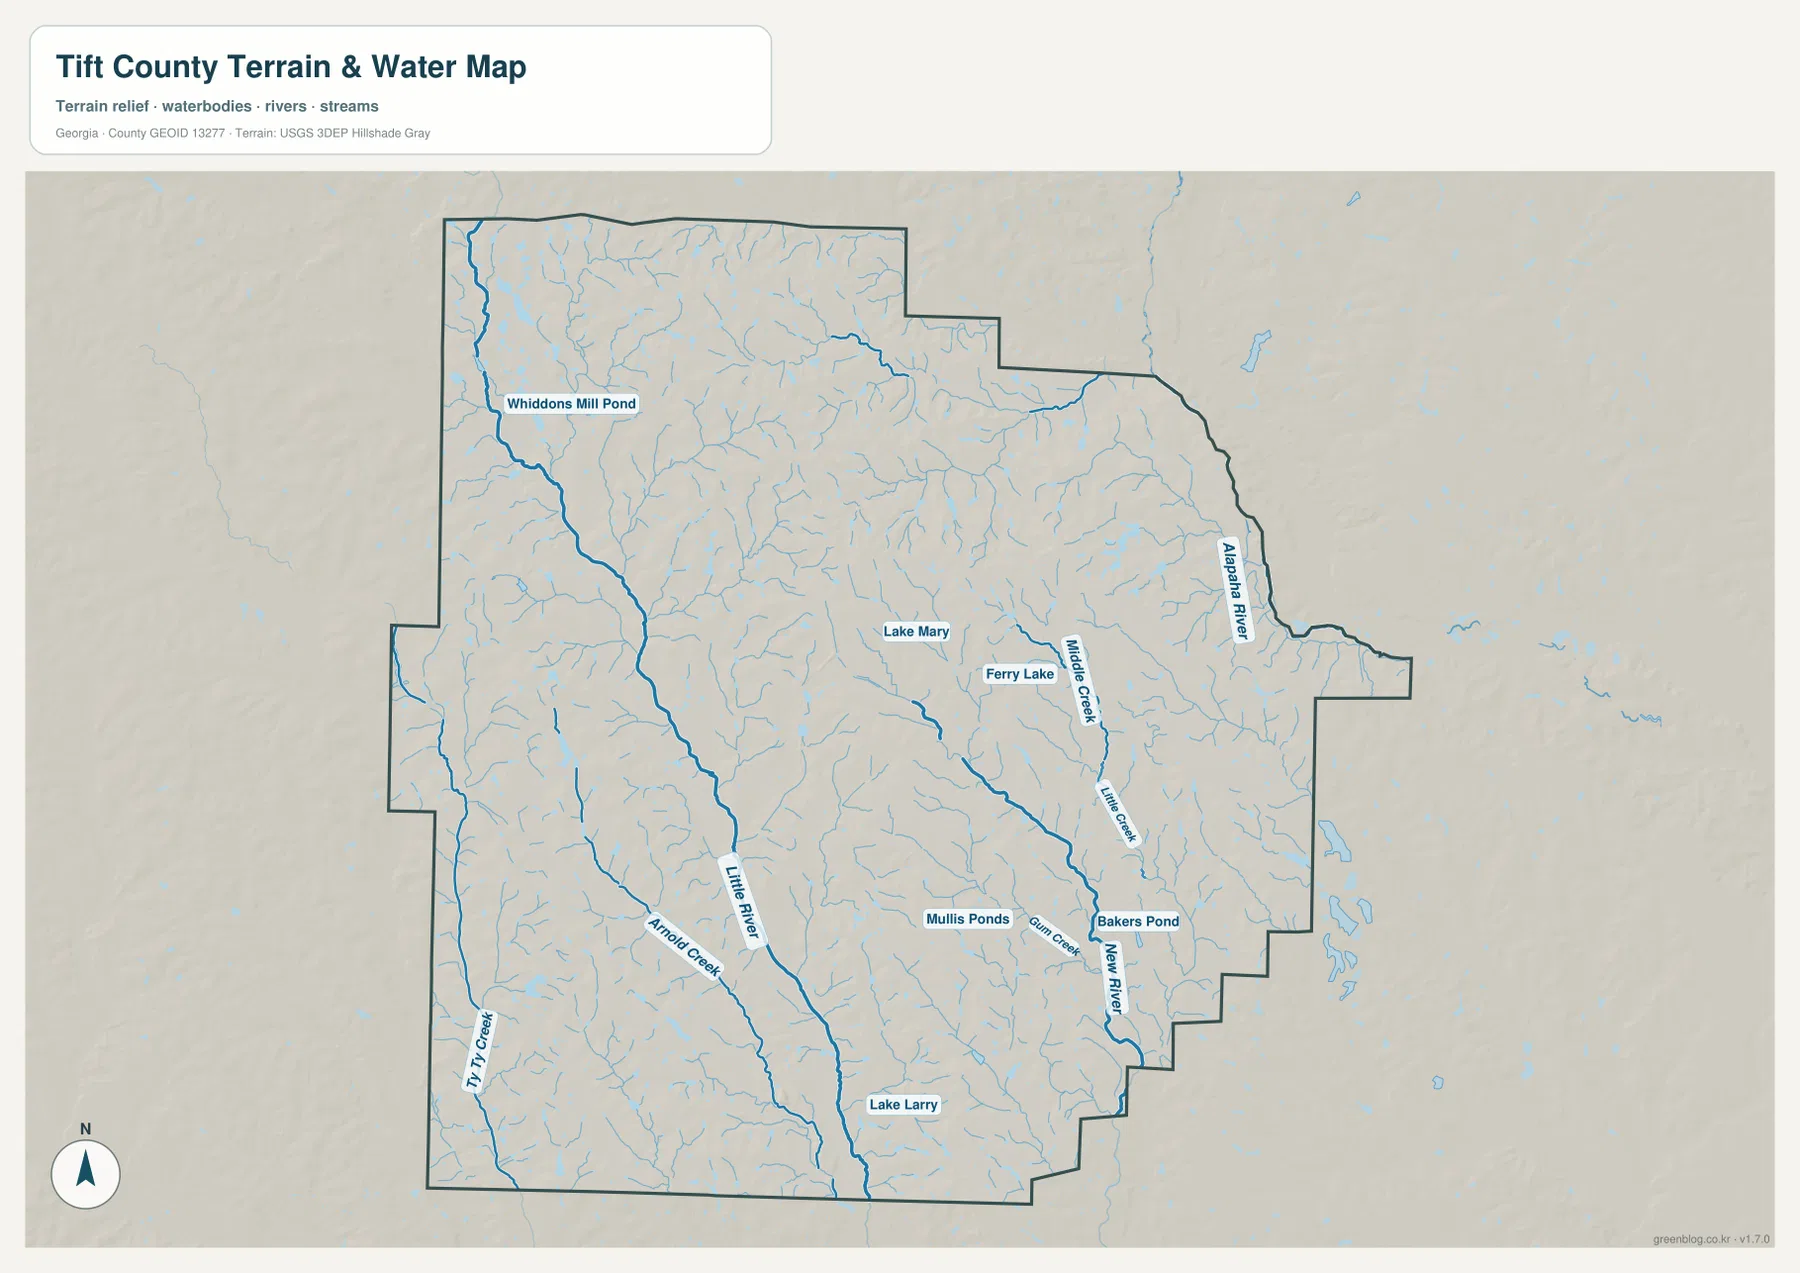
Several small water bodies are labeled as well. Whiddons Mill Pond appears in the northwest, Lake Mary and Ferry Lake are near the center, Mullis Ponds lie farther south, and Bakers Pond and Lake Larry are shown in the southern half. None of these should be read as a single dominant lake system. Their value on the map is that they show how ponds and small lakes are scattered among the creek and river corridors rather than concentrated in one reservoir.
The contrast with the general county map is useful. On the road map, the eye naturally follows I-75 and the routes converging on Tifton. On the water map, attention shifts to the north-south and branching channels that cross areas away from the main city. Looking at the two together helps explain why a county that appears compact on a transportation map still contains many small stream valleys. The water layer is a location reference, not a flood or depth map, so any site-specific hazard decision would require a dedicated official source.
A 69–125 Meter Elevation Range Shaped by Stream Valleys
The elevation map reports an actual range of about 69 to 125 meters, with a mean near 97 meters. Tift County is not shown as a mountainous landscape, yet the shaded relief makes local differences easy to see. Higher brown and tan ground is concentrated across much of the north and north-central area, while lower green corridors extend along the Little River and several tributaries. The county’s relief is therefore defined less by one major ridge than by repeated uplands separated by lower stream valleys.
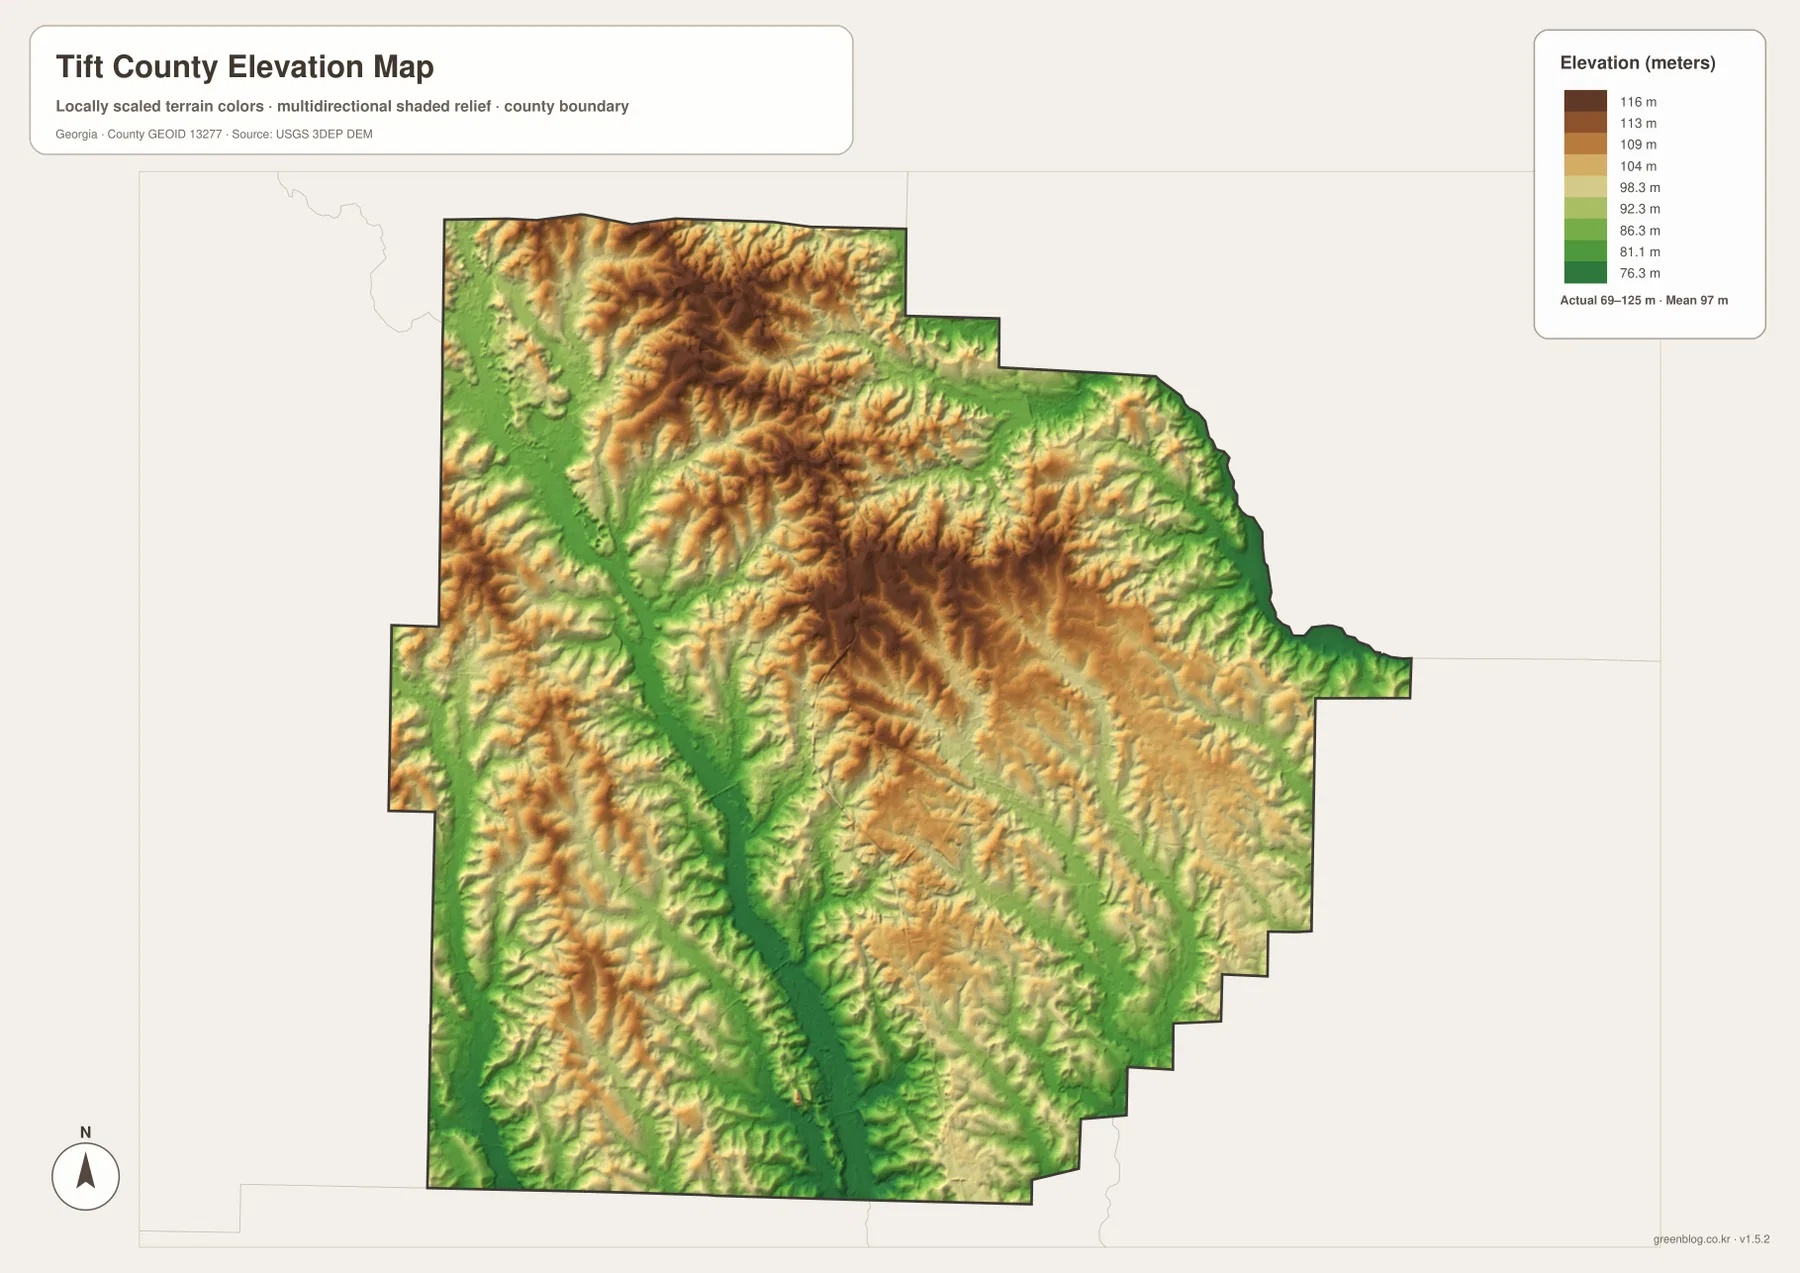
The western-central valley is particularly clear because a long green lowland follows the same general path as the Little River on the water map. Similar narrow low areas branch through the eastern half of the county, corresponding to streams such as Middle Creek, Little Creek, and New River. That relationship makes the water and elevation maps useful as a pair: the water layer supplies names and channel locations, while the elevation layer shows the lower ground those channels occupy.
The elevation values should be treated as county-scale terrain information rather than survey measurements for a specific property. They are appropriate for comparing broad highs and lows, identifying the general shape of stream valleys, and explaining why drainage lines follow certain corridors. For engineering, construction, or parcel-level elevation work, a dedicated surveyed source would be required.
Choosing the Right Tift County Map for the Question
If the task is to locate Tifton, understand the county boundary, or trace the major road pattern, start with the general county map. It combines the most useful transportation and place labels in one view. The city-connection map is better when the question is specifically about how Tifton, Ty Ty, and Omega are spaced. It removes much of the background detail and puts the hub-and-distance relationship at the center of the page.
For natural features, the water and elevation maps answer different but connected questions. The water map is the stronger choice when names such as Little River, Alapaha River, New River, Ty Ty Creek, or individual ponds matter. The elevation map is more useful when the goal is to show the difference between higher uplands and lower stream valleys. In a report or classroom presentation, using those two maps together can explain both where a waterway is and how the surrounding ground changes around it.
The printable files are also useful when a larger image is needed than the web preview provides. Each map focuses on the same county but preserves a different layer of information, so there is no need to force one crowded map to answer every question. Select the road-and-place map for orientation, the city map for relative spacing, the water map for named channels and ponds, or the elevation map for terrain comparison.
These maps are county-level references rather than parcel, engineering, or turn-by-turn navigation products. That distinction is important when printing them at large size: a larger image improves readability, but it does not add street, property, flood, or survey detail that is not part of the original map. For those specialized uses, consult the appropriate official dataset or local authority.
Frequently Asked Questions
How far are Omega and Ty Ty from Tifton on the city map?
The city-connection map shows Omega at about 10 miles and Ty Ty at about 8 miles from Tifton using direct, straight-line distance. Those figures are for comparing relative spacing and should not be treated as road mileage or estimated driving time.
What does the elevation map show about Tift County?
It shows an actual mapped range of roughly 69 to 125 meters, with a mean near 97 meters. Higher terrain is more common across the northern part of the county, while lower green corridors follow the Little River and other stream valleys.
What files are in the Tift County download?
The ZIP contains four A3 high-resolution JPG files: the general county map, city-connection map, water map, and elevation map. The WebP images in the article are lighter previews, while the JPG files are intended for larger viewing and printing.
Sources and Reference Data
The county background and place information use the sources already linked to the existing article, while the map layers rely on standard authoritative boundary, hydrography, and elevation references.
- U.S. Census Bureau QuickFacts – Tift County, Georgia
- New Georgia Encyclopedia – Tift County
- New Georgia Encyclopedia – Tifton
- U.S. Census Bureau TIGER/Line Shapefiles
- USGS National Hydrography
- USGS 3D Elevation Program
Map File Information
The ZIP contains four A3 high-resolution JPG maps for Tift County: a general county map, a city-connection map, a water map, and an elevation map. Use the larger files for printing, classroom material, presentations, or side-by-side comparison beyond the web previews.
- File Type: One ZIP containing four A3 high-resolution JPG files
Related Maps
Green Map creates custom-edited map images using open geographic data sources such as geoBoundaries, Natural Earth, OpenStreetMap, and government open data. These maps are edited visual materials, not raw data files, and are provided for education, documents, presentations, and graphic reference.