Monterey County stretches from the Monterey Bay area into a long interior of valleys, mountains, and dry uplands, and the 2025 land-cover pattern changes sharply across that distance. Shrubland and grassland occupy most of the mapped area, a bright agricultural corridor follows the Salinas Valley, and forest becomes more prominent through the western and southwestern mountains. Built surfaces remain much more concentrated, with the strongest developed clusters in the north and along the bay side of the county.
Four map views are provided here: general land cover, forest and farmland, impervious surface with developed land, and a 1985–2025 class comparison. Near the end of the page, one ZIP download contains the four original JPG maps as separate files. Seeing the same county outline in each view makes it possible to compare the farmed valley, the wooded western terrain, the broad shrub-and-grass interior, and the limited footprint of hard built surfaces without treating land cover as zoning or parcel information.
Table of Contents
Shrub and grass uplands occupy most of Monterey County
Shrubland is the dominant 2025 class at 40.22%, followed by grassland at 29.42%. Together they account for nearly seven-tenths of the county summary, which matches the broad tan and light-green areas across the eastern, southeastern, and central uplands. Forest represents 12.37%, agriculture 11.01%, and developed land 5.03%. Wetlands account for 1.52% and water 0.32%, so neither has a large countywide share even though small wet areas and water features remain visible in local parts of the map.
The percentages become more meaningful once their locations are compared. Agriculture does not form a scattered patchwork across the county; it is packed into the long Salinas Valley floor and widens considerably in the north. Forest behaves almost in the opposite way, appearing much more strongly in the western mountain belt and toward the southwest. Shrubland and grassland fill much of the terrain between and beyond those zones, while the largest developed patches stay close to the northern urban area and Monterey Bay.
The Salinas Valley forms a narrow agricultural spine through the 2025 map
Agricultural cover is the easiest linear feature to follow on the general land-cover map. Yellow pixels begin broadly in the north and continue southward through the interior, keeping a recognizable valley shape even where the band narrows. Red developed areas overlap the northern end of this agricultural zone and appear again as smaller settlements farther down the valley. West of the valley, darker green forest mixes with shrub-covered mountain slopes; east of it, open shrubland and grassland spread across much larger uninterrupted areas.
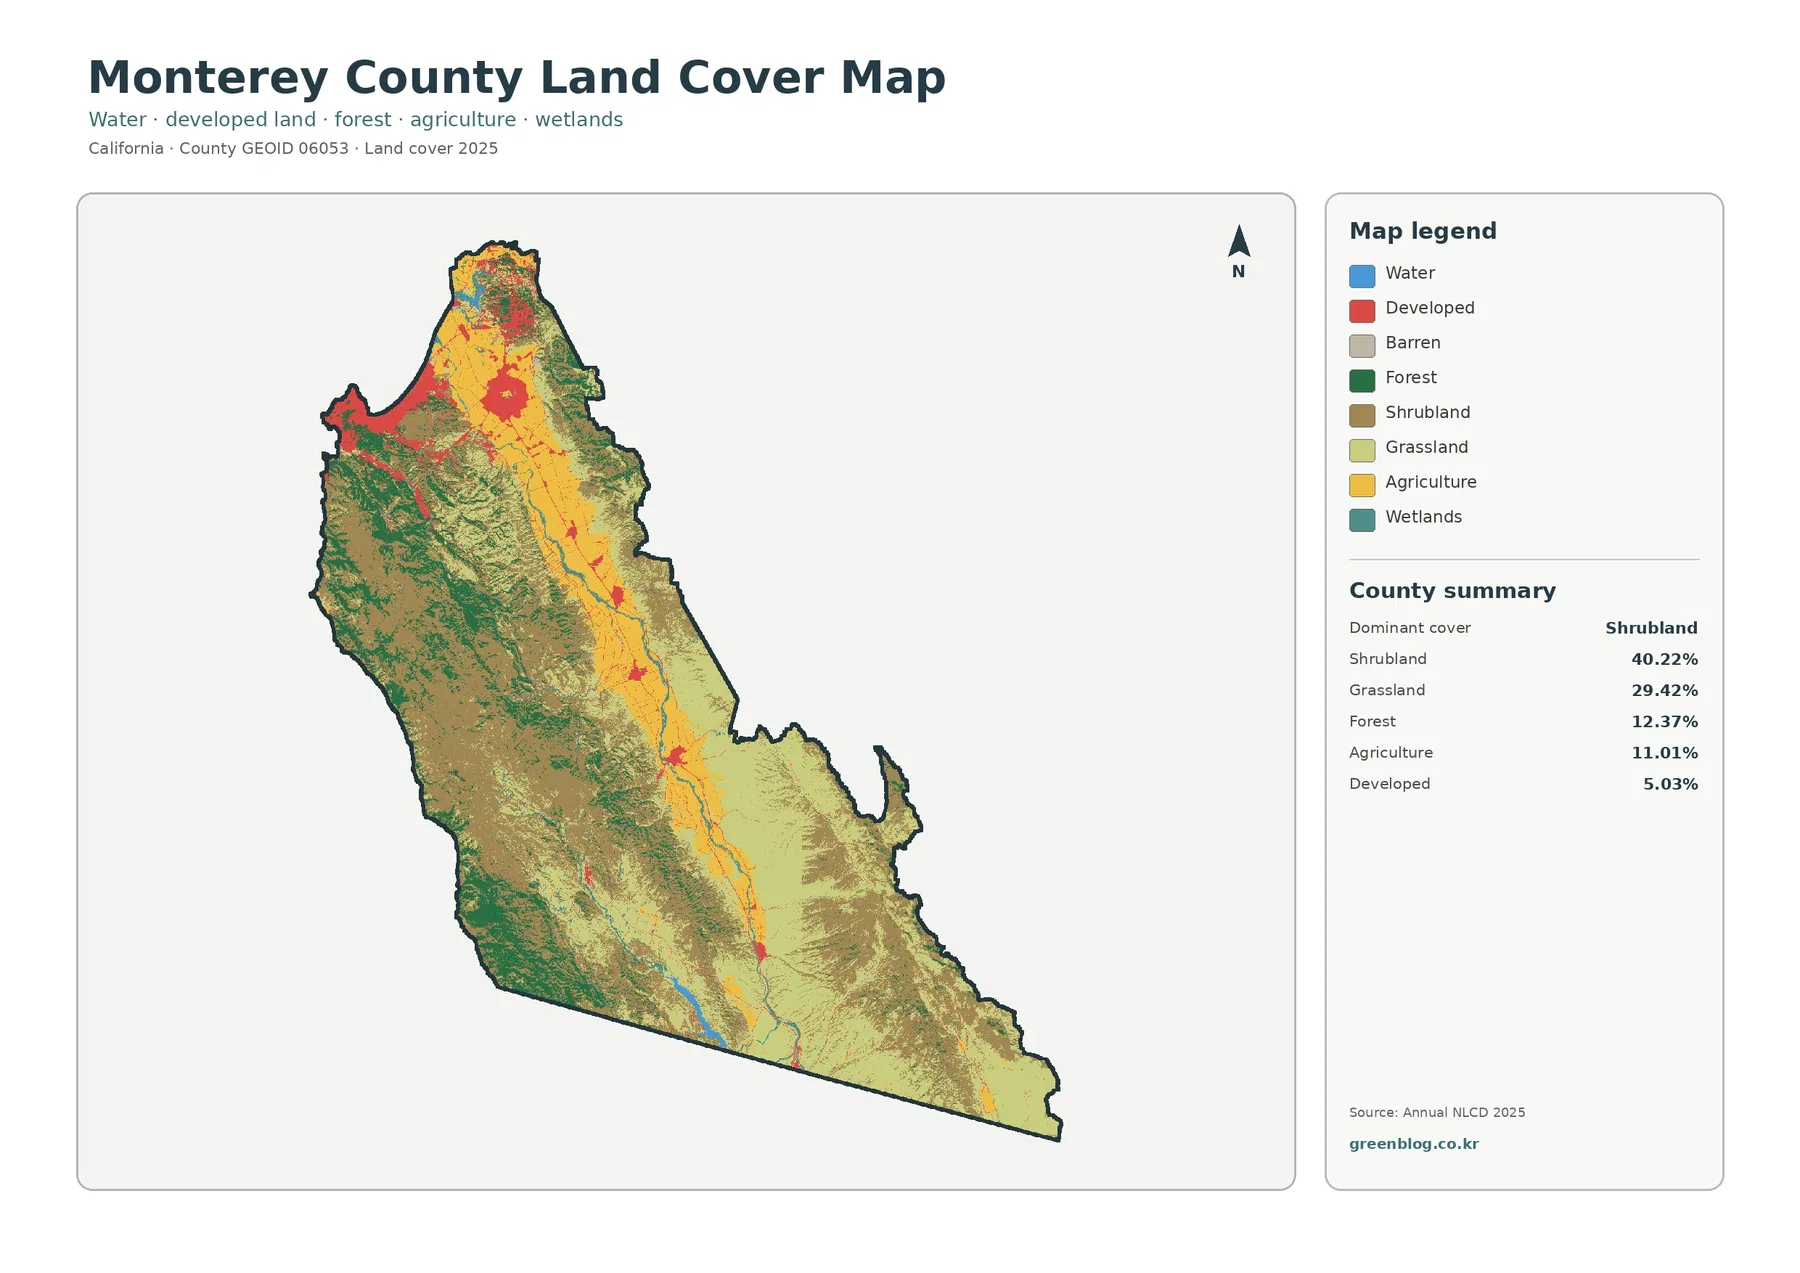
Reading the colors by location helps prevent a common mistake. A developed class is not the same as a solid block of pavement, and an agricultural class is not a statement about crop value or farm ownership. The pixels summarize the surface class assigned by the land-cover dataset. In Monterey County, that distinction matters because low-density developed surroundings, irrigated fields, wooded slopes, and dry open hills can sit close together while representing very different ground conditions.
Sharp color edges should also be treated as generalized boundaries rather than surveyed lines. A raster cell is a small grid unit, similar to a pixel in an image, and a field edge or narrow road can share a cell with neighboring vegetation. The map is therefore well suited to county-scale pattern comparison. Questions about one parcel, a precise field boundary, or a legal land-use designation need current local planning, cadastral, or aerial data instead.
Forest west of the valley contrasts with concentrated farmland on the valley floor
Removing most of the other classes makes the forest-and-farmland view especially clear in Monterey County. Cropland remains a long yellow corridor through the Salinas Valley, while forest forms larger green patches in the western mountains and the southwestern portion of the county. The eastern interior still carries extensive natural cover, but much of it belongs to shrub and grass categories rather than forest. That west-versus-interior contrast is harder to notice when every land-cover class competes for attention on the general map.
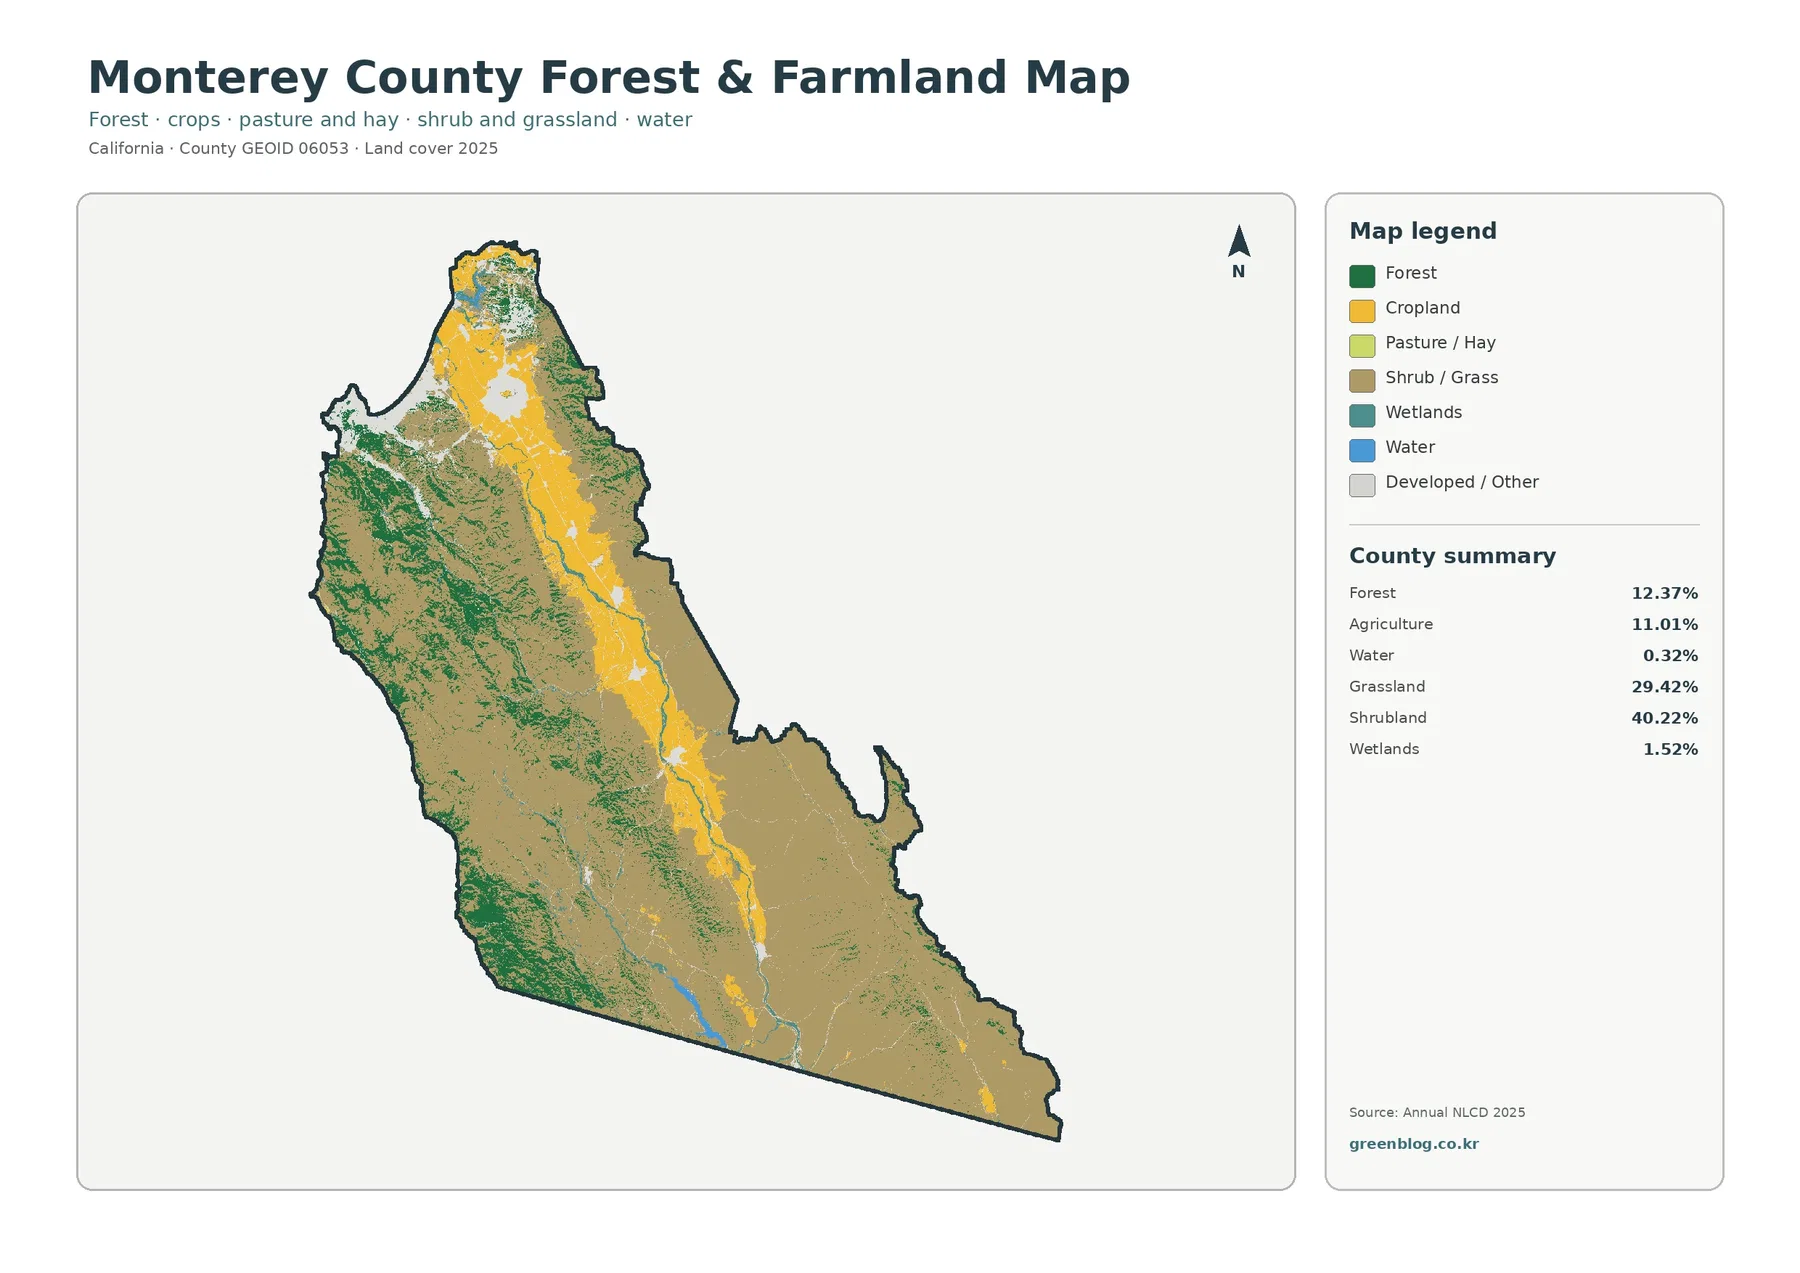
Only 11.01% of the county summary is classified as agriculture, yet the valley corridor is visually prominent because the agricultural pixels are concentrated in one long, connected setting. That spatial concentration is different from economic importance. Official county Crop & Livestock Reports document production and value, whereas the land-cover percentage describes how much of the mapped surface was assigned to an agricultural class. Keeping those measures separate avoids reading an economic conclusion into a geographic percentage.
The simplified view also shows why “undeveloped” is too broad a label for the rest of the county. Wooded slopes west of the valley, shrub-covered uplands, grass-dominated hills, wetlands, and water do not have the same vegetation or surface behavior. For a habitat discussion or a classroom comparison, separating forest from open shrub-and-grass terrain reveals more about the landscape than dividing the county only into urban and nonurban areas.
Hard surfaces cluster in the north and at smaller valley settlements
Impervious surface describes pavement, rooftops, and other hard cover that does not readily absorb water. The countywide mean is 1.56%, and 1.21% of Monterey County is mapped at 50% impervious or greater. Developed land, by comparison, accounts for 5.03%. Those numbers differ because a developed land-cover cell may still contain lawns, trees, soil, or other permeable surfaces, while the impervious layer estimates the hard-surface fraction more directly.
Dark red values are concentrated around the large northern urban cluster and the Monterey Bay side rather than spread across the county. Smaller patches appear at settlements farther south along the Salinas Valley, connected by much lighter surroundings. Most of the western mountains, eastern uplands, and broad southern interior remain pale. The pattern makes the physical footprint of hard surfaces look far smaller and more localized than the full developed-land category on the general map.
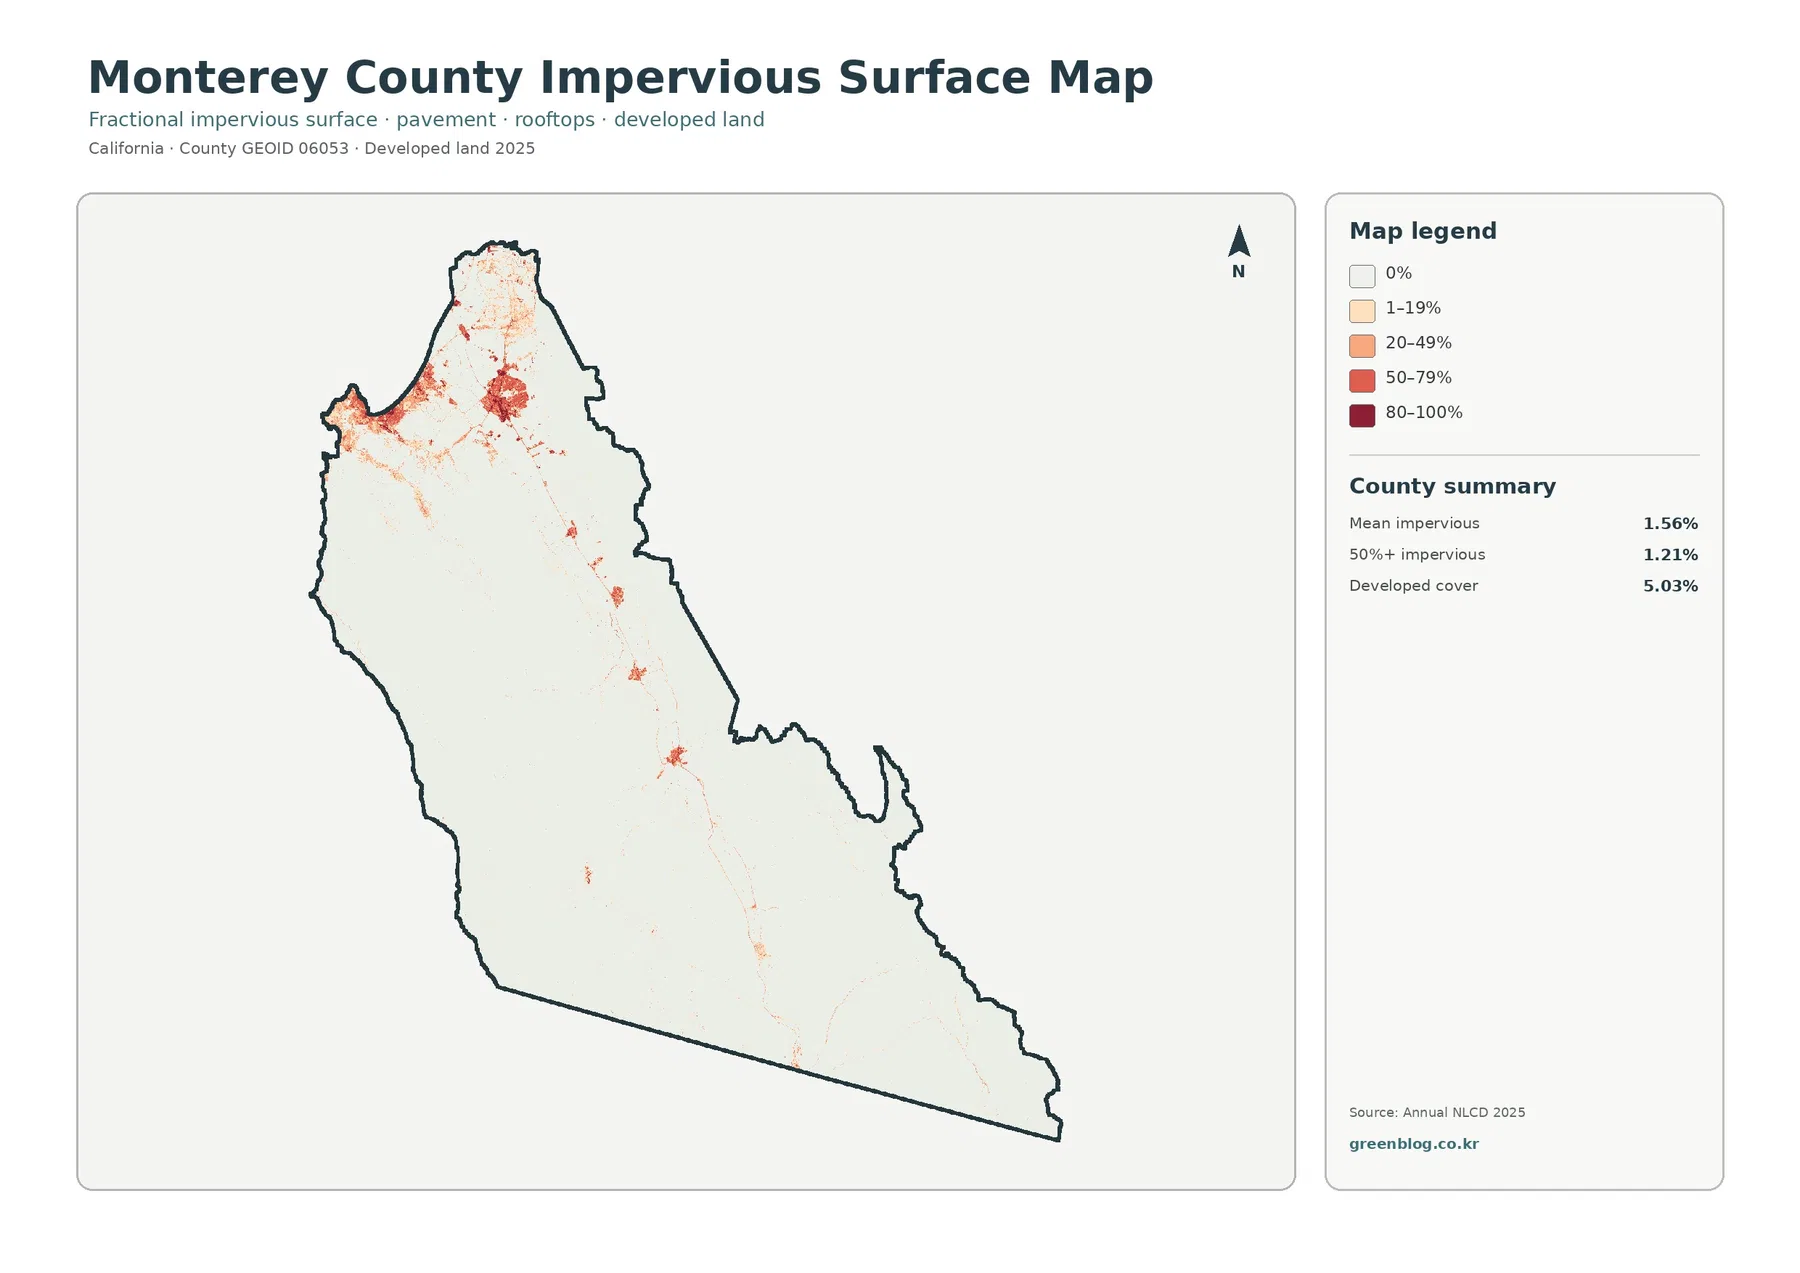
For stormwater or watershed context, the impervious layer provides a more direct view of hard surfaces than the developed class alone. Its county scale is still important to remember. Individual roofs, parking lots, narrow roads, and drainage features can be smaller than the mapped grid or mixed with neighboring surfaces. The layer is better for identifying broad concentration than for calculating the paved percentage of a specific property.
The 1985–2025 comparison records many class differences beyond development
Across the two endpoint classifications, 20.38% of the county is marked with a class difference. The supplied summary separates 1.21% as transition to developed land, 6.09% as forest loss, 1.16% as agricultural loss, and 11.66% as other class difference. That large “other” category is important: most mapped differences are not simply urban expansion, forest loss, or agricultural loss. In other words, the dataset tracks assigned class differences across a landscape with several vegetation types.
Orange and purple differences are especially noticeable through portions of the western mountain terrain and interior uplands, while red developed-transition patches stay more localized near settlements. Agricultural-loss pixels appear in smaller pieces along and near the valley corridor. These colors identify locations where the two classifications disagree; they do not state why a change occurred. Fire, vegetation recovery, clearing, crop rotation, or a classification difference may be relevant in some places, but the two-date map by itself cannot choose among those explanations.
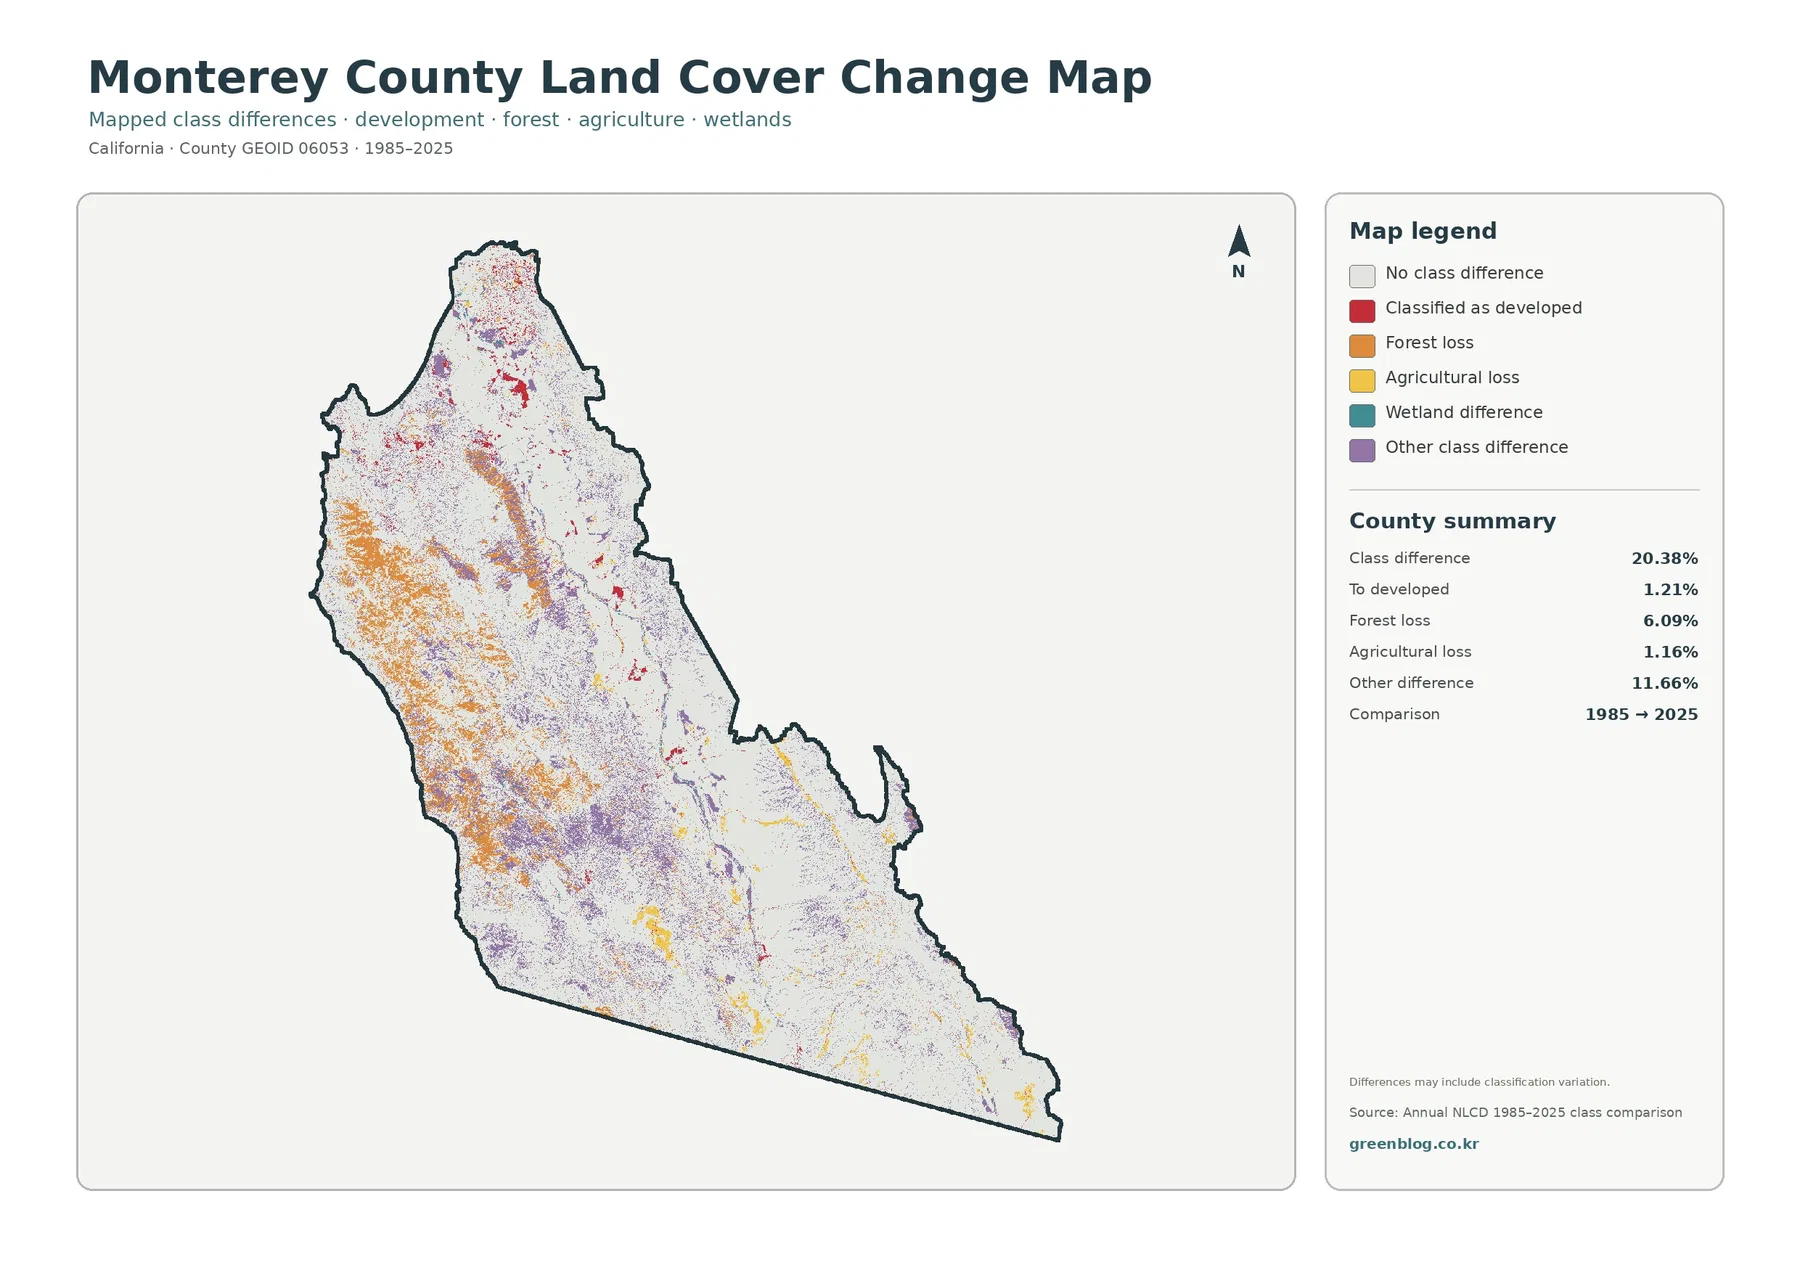
A useful follow-up starts with location rather than cause. After finding a cluster on the comparison map, check its 2025 class on the general map. A settlement-area cluster can then be compared with the impervious layer, while a mountain or valley cluster can be checked against the forest-and-farmland view. Intermediate-year land-cover products, aerial imagery, fire records, or planning documents are needed when the goal is to determine when a transition happened or what produced it.
Pair the valley, mountain, and urban patterns across the four views
For a countywide overview, begin with the 2025 general map and locate the Salinas Valley before comparing the surrounding uplands. The long agricultural band provides an easy reference line for the other views. Moving to the forest-and-farmland map then clarifies how strongly the western mountain terrain differs from the farmed valley and the more open eastern interior.
Built-area analysis works better in the opposite direction. Locate the northern developed clusters on the general map, then check how much of those areas appears as stronger impervious cover. Add the historical view last to see where class differences coincide with present-day developed clusters and where they occur far from urban surfaces. Keeping the views in this geographic sequence makes the comparison specific to Monterey County rather than reducing the maps to four separate legends.
Students, teachers, and researchers can also crop the downloaded JPGs for side-by-side figures, provided the map labels and context remain clear. A valley-focused comparison can emphasize agriculture and settlement, while a western-mountain comparison can emphasize forest and mapped class differences. For any decision tied to a property boundary, zoning designation, permit, or current site condition, these county-scale images should serve only as background before consulting the relevant local source.
Map File Information
The download keeps each view as a separate original JPG: the 2025 general land-cover map, the forest-and-farmland map, the impervious-surface and developed-land map, and the 1985–2025 land-cover comparison. Separate files are convenient when a presentation needs only one topic, while the full set preserves the common county outline needed for direct comparison.
What the classification can and cannot tell you
County-scale land-cover classification is designed to summarize the physical surface consistently across a large area. Each raster cell receives a mapped value even though the ground inside that cell may contain more than one feature. Mixed pixels are therefore expected along field edges, roads, shorelines, neighborhoods, narrow stream corridors, and transitions between forest and open vegetation. Small local features may disappear or share a class with their surroundings.
The supplied present-day views describe the 2025 classification. Construction, wildfire, vegetation recovery, changing crop cover, or other later events will not appear until a newer dataset is used. The historical comparison is also an endpoint view: it compares 1985 with 2025 rather than showing every year between them. Trend analysis needs intermediate dates instead of assuming that a colored comparison pixel followed one uninterrupted path for forty years.
Land cover should remain separate from legal land use. Agricultural cover does not identify ownership or guarantee agricultural zoning, developed cover does not establish building rights, and forest does not define a protected area. Local planning records, parcel information, and current imagery answer those questions. The maps here are strongest when used to describe broad surface patterns and to identify places that deserve closer examination.
Frequently Asked Questions
Why does agriculture stand out so strongly if it covers 11.01% of the county?
The agricultural pixels are concentrated along the Salinas Valley instead of being spread evenly across Monterey County. That creates a long, visually continuous band through the middle of the map, so agriculture is easy to recognize even though shrubland and grassland occupy much larger shares of the total county area.
Why is developed land 5.03% while mean impervious surface is 1.56%?
Developed land is a land-cover class that can contain lawns, trees, soil, and other permeable surfaces within built settings. Impervious surface focuses on hard cover such as pavement and rooftops. A neighborhood can therefore count as developed without being completely sealed by hard surfaces, which keeps the countywide impervious mean below the developed-cover share.
What should I verify after finding a forest-loss area on the 1985–2025 map?
Start by checking the current 2025 class and the location of the colored pixels. To investigate cause or timing, compare intermediate land-cover years, aerial imagery, fire history, vegetation records, or local planning information. That historical layer identifies where the classifications differ, but it cannot determine by itself whether fire, clearing, regrowth, classification variation, or another process produced that difference.
Sources and reference material
Official land-cover documentation explains the classification and county boundary data, while Monterey County sources add local agricultural and geographic context for the patterns described above.
- MRLC Annual NLCD Data — annual land-cover datasets and related products
- USGS Annual NLCD Land Cover Classification — land-cover class definitions and documentation
- U.S. Census Bureau TIGER/Line Shapefiles — county boundary reference data
- County of Monterey Crop & Livestock Reports — official agricultural production and economic reports
- County of Monterey: At a Glance — county geographic and economic context
Map File Information
The ZIP includes all four original JPG maps for Monterey County, California.
- File Type: ZIP containing four JPG files
Related Maps
- Alameda County California Land Cover Map
- Alpine County California Land Cover Map
- Amador County California Land Cover Map
Green Map creates custom-edited map images using open geographic data sources such as geoBoundaries, Natural Earth, OpenStreetMap, and government open data.
These maps are edited visual materials, not raw data files, and are provided for education, documents, presentations, and graphic reference.