Mono County’s 2025 land-cover map is dominated by shrubland, but the county is far from visually uniform. Shrubland accounts for 60.12% of the mapped area, forest for 21.37%, barren land for 8.70%, water for 2.89%, and grassland for 2.48%. A large interior lake, forested Sierra slopes, exposed high-country surfaces, and small settlement footprints interrupt the broad sage-colored basins and make the county unusually easy to read as a set of strong landscape contrasts.
The page provides four related views: general land cover, forest and farmland, impervious/developed land, and mapped class differences from 1985 to 2025. WebP versions are shown in the article, while the four original JPG maps are available together in one ZIP below. Reading them side by side is especially useful in Mono County because the dominant shrubland can otherwise hide much smaller but important water, forest, farming, and developed areas.
Table of Contents
A shrubland majority stretches between the Sierra crest and Nevada
The general map places the county’s largest class in immediate context. Tan shrubland fills much of the central and eastern interior, while substantial green forest blocks occur along the western mountain side and in several northern and southern uplands. Pale barren areas become more noticeable near the high western edge, and water punctuates the interior with one very large blue basin and a series of smaller lakes. The 60.12% shrubland figure therefore describes the majority cover, not an unbroken surface.
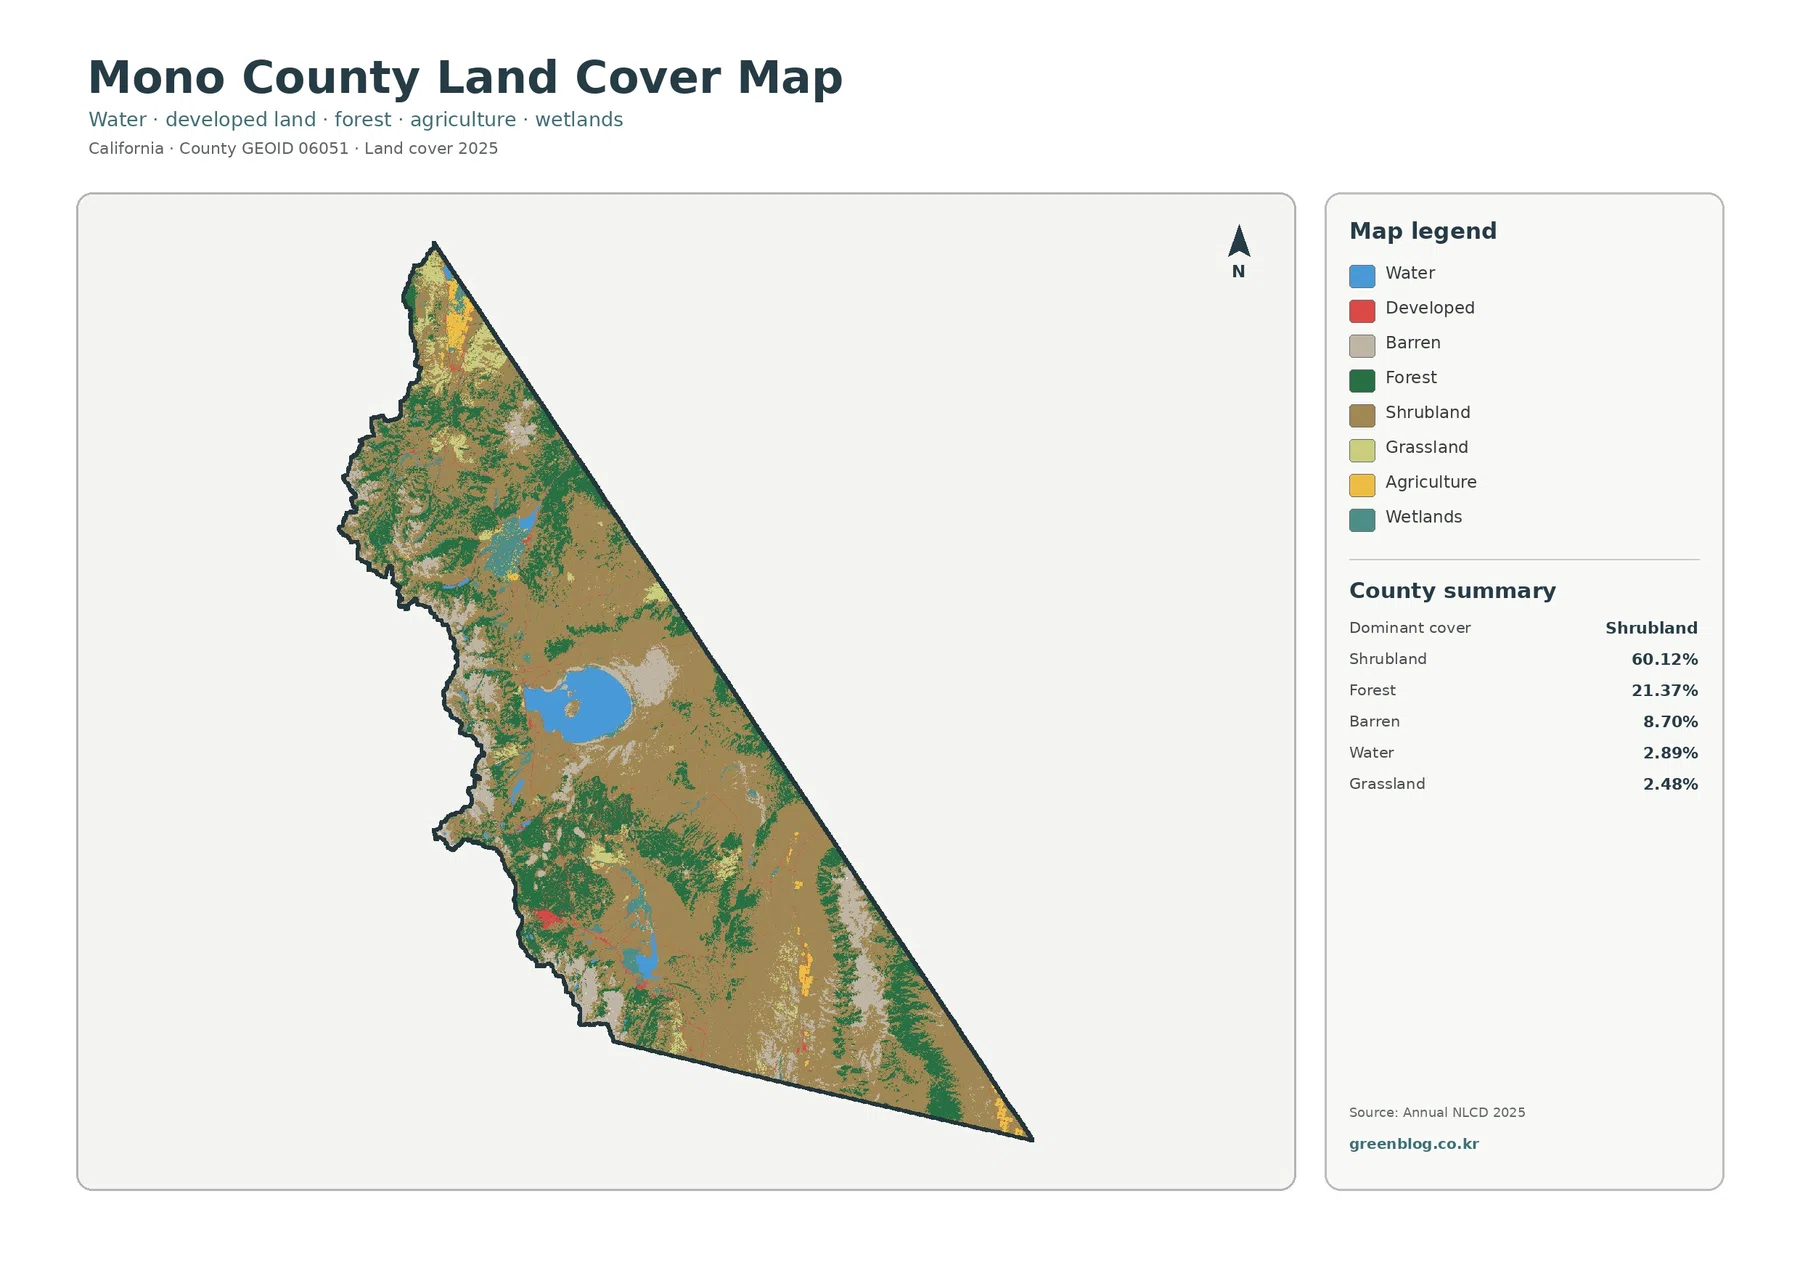
Mono County’s official overview describes the county as a long, narrow area between the crest of the Sierra Nevada and the California–Nevada border. It also lists pine and aspen forests, hundreds of lakes, alpine meadows, streams, and sage-covered high desert among the local landscapes. Those descriptions fit the broad contrasts visible here without requiring the map to identify every mountain range or vegetation community. The map classifies surface cover only; it does not mark public ownership, wilderness boundaries, or zoning.
Mono Lake makes water more important than its 2.89% share suggests
Water occupies 2.89% of the 2025 summary and wetlands 2.27%, both small percentages next to shrubland. Yet the large blue feature near the middle of the county changes how the map reads. Mono County’s own information identifies Mono Lake as a large high-desert saline lake and notes that the county takes its name from it. Smaller water bodies are scattered along the Sierra side and farther south, so the water class is not confined to one basin even though the central lake is the most visually prominent feature.
Forest and farmland tell very different stories on the eastern Sierra side
Forest covers 21.37% of Mono County and forms broad, recognizable blocks rather than a fine county-wide scatter. Green areas are strongest along the western mountains and continue through several southern and northern highlands. Agriculture is only 0.99%. Its yellow patches are much smaller and appear in a handful of flatter valley or basin settings, especially in the north and south-central part of the county. The difference in scale between those two classes is one of the clearest features of the forest-and-farmland view.
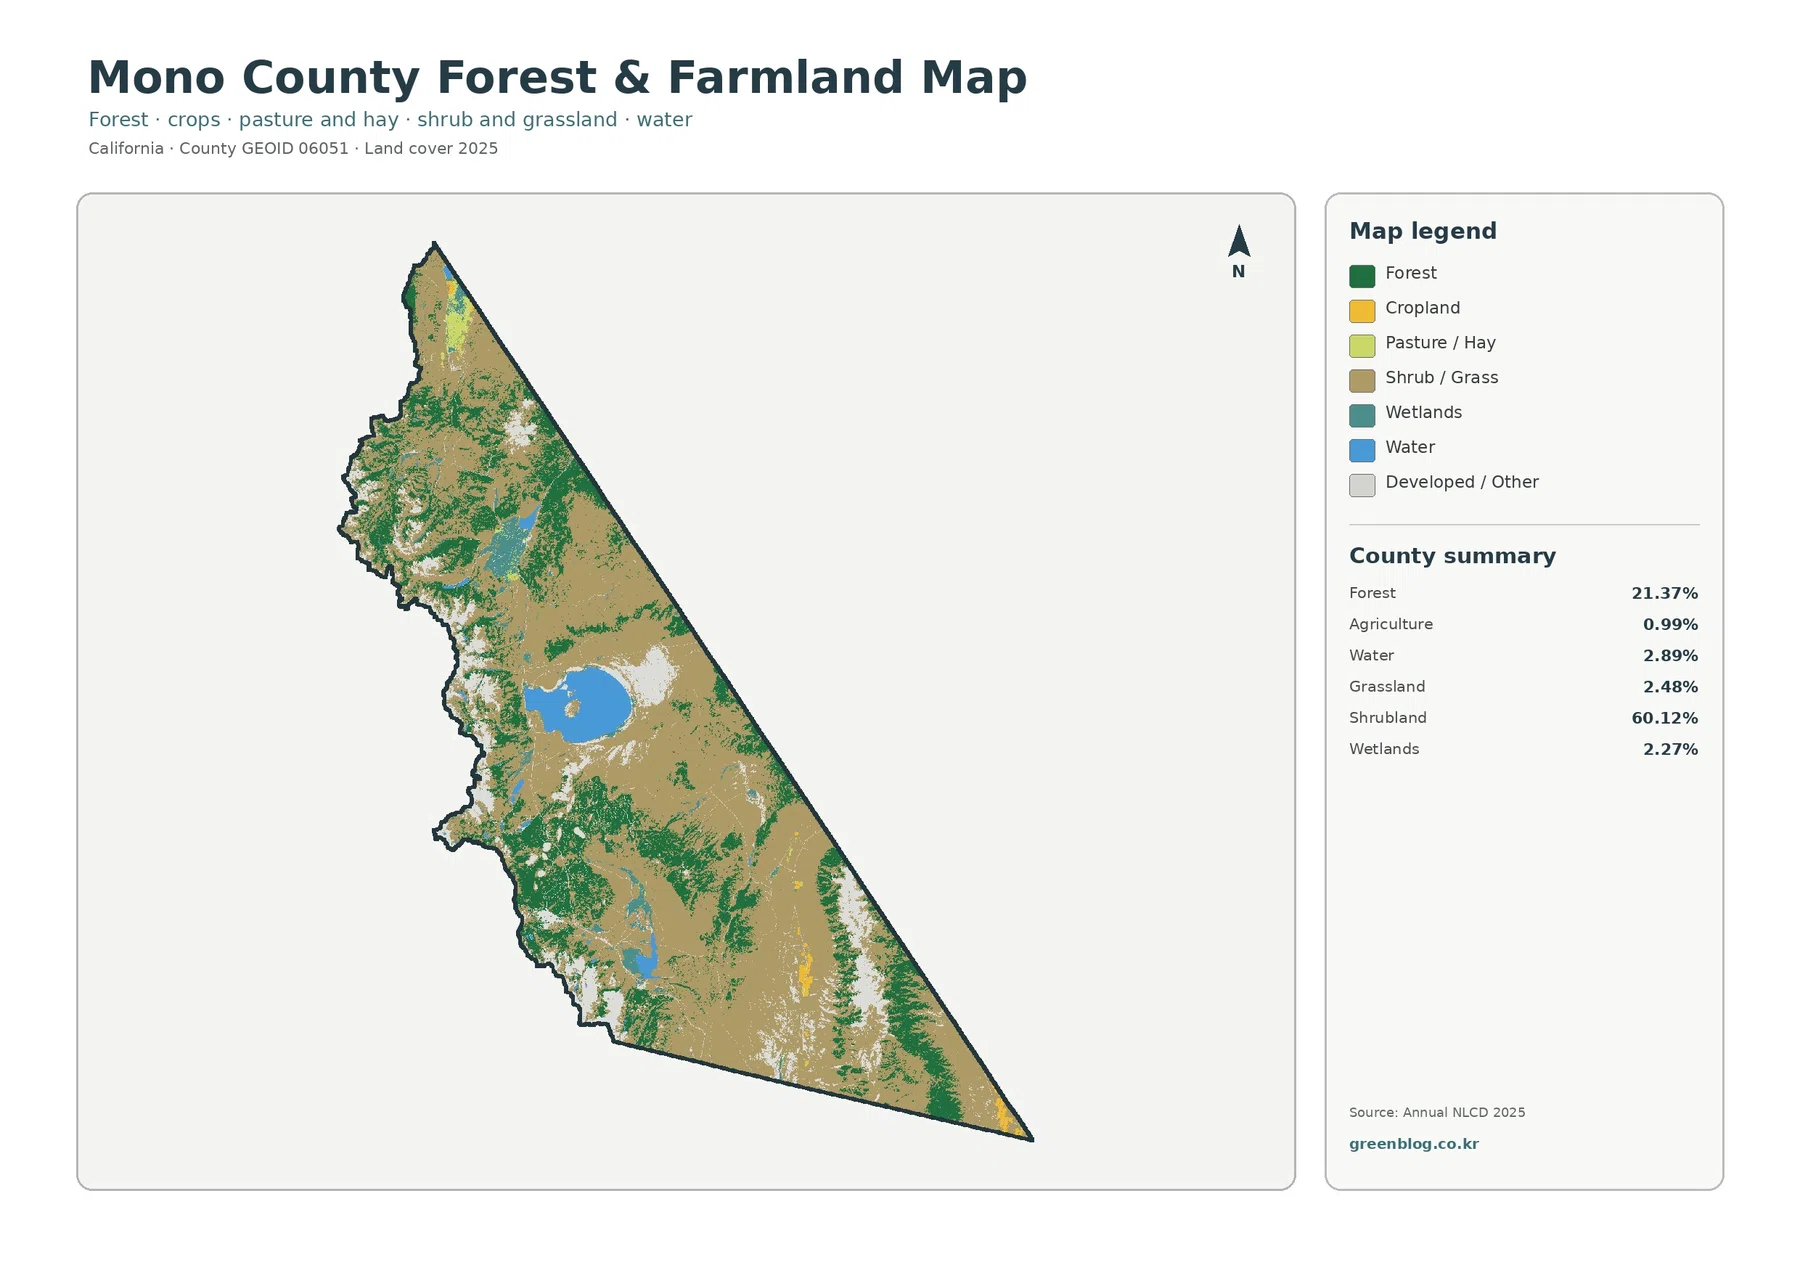
This map is useful for regional comparison, but it should not be treated as an agricultural parcel map. The agriculture class represents mapped surface cover, not a legal agricultural designation, parcel ownership, or a guarantee that a field has the same use today. Mono County’s General Plan separately establishes planning policies and land-use designations. Keeping those two concepts separate is particularly important in a county where official sources say most land is publicly or quasi-publicly owned.
Mammoth Lakes stands out in a county with only 0.36% mean impervious surface
Impervious surface measures roofs, pavement, and similar hard surfaces that shed water rather than allowing it to soak into the ground. Mono County’s mean impervious value is 0.36%, and just 0.16% of the county falls in the 50%-or-higher impervious group. Developed land cover is 1.13%. Those numbers are consistent with a map where nearly the entire county remains very light and only a few concentrated orange or red patches appear.
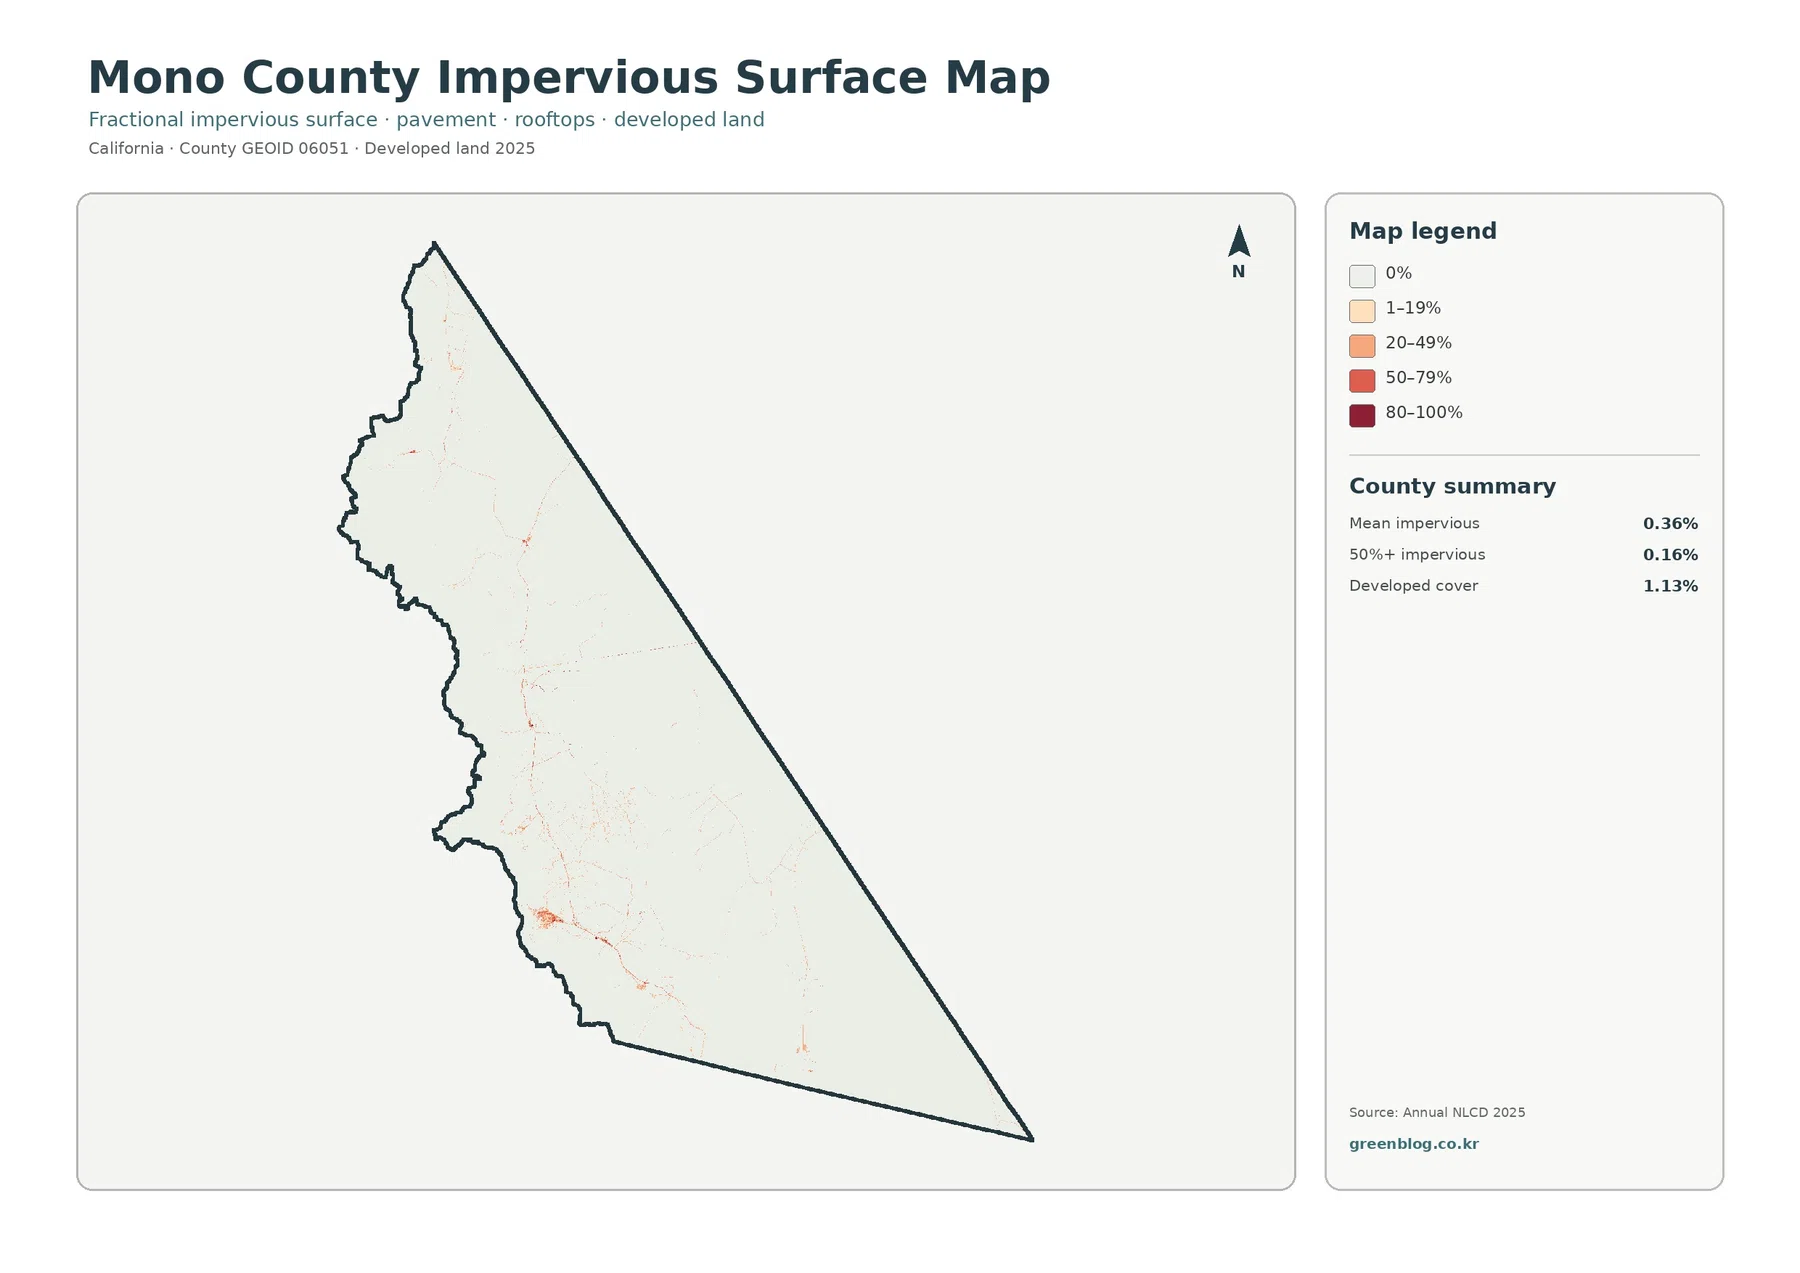
County planning information identifies Mammoth Lakes as Mono County’s only incorporated town and its major population center. It also notes that many smaller communities lie along or near U.S. 395, with additional communities along U.S. 6. The strongest impervious cluster on the supplied map lies in the same general south-central/western part of the county as Mammoth Lakes, while smaller linear and point signals occur elsewhere. Because the map has no road or town labels, it should not be used to identify a particular street, building, or facility.
The 1985–2025 map reports 9.34% class difference, mostly outside urban conversion
The comparison map reports a different mapped class in 9.34% of the county between 1985 and 2025. “Other class difference” is the largest listed component at 6.80%. Forest loss accounts for 1.89%, areas classified as developed for 0.21%, and agricultural loss for 0.21%; wetland difference is also shown as a separate legend category. The relatively small developed share is an important reminder that the total 9.34% should not be described as urban growth.
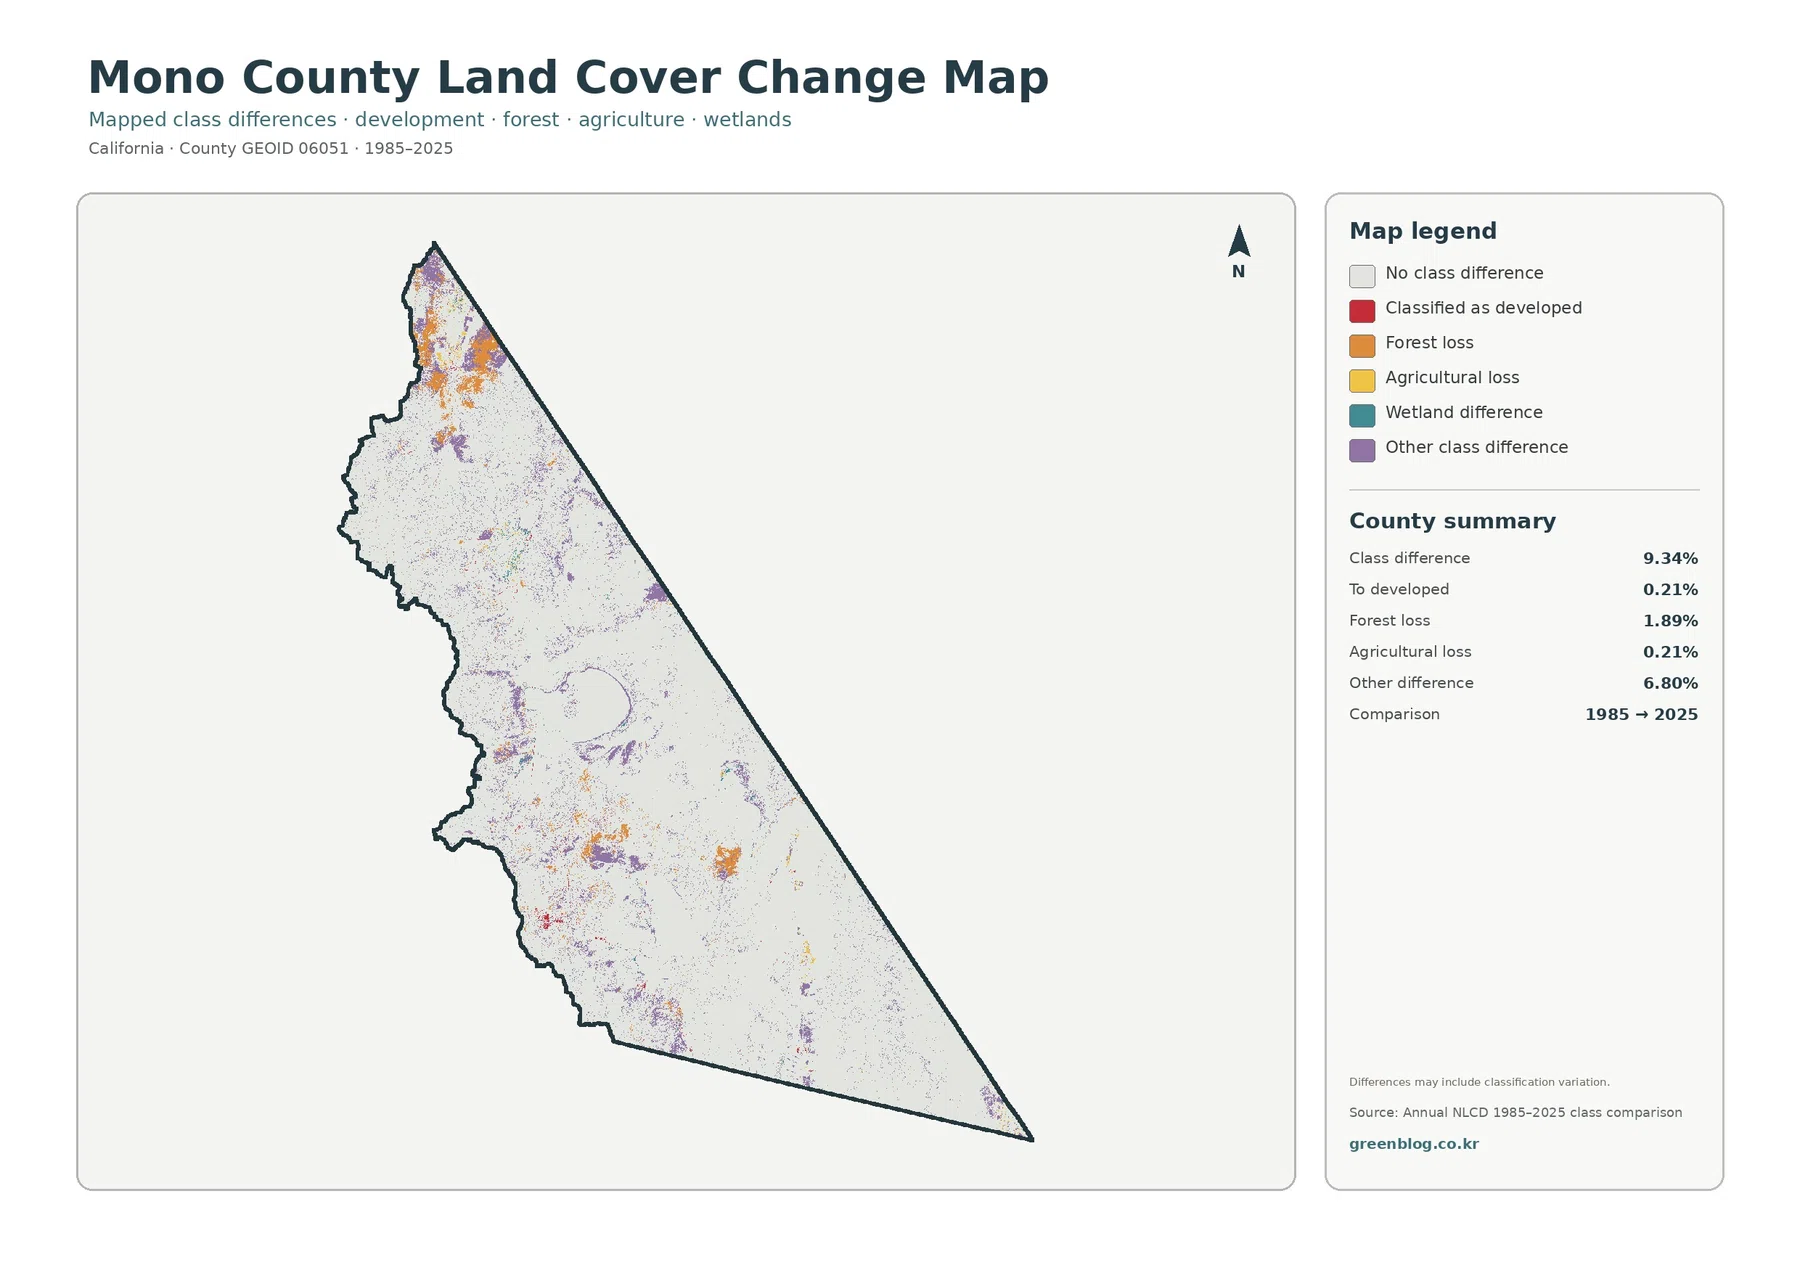
The map also warns that class differences may include classification variation. A real change in vegetation, water level, development, or exposed ground can create a different class, but so can seasonal conditions, image characteristics, mixed 30-meter cells, or differences in classification. This caution is especially relevant in high mountain areas, wetland edges, and dry lake or shrub transitions where a modest shift in observed conditions can change the assigned class. A site-specific explanation requires intermediate imagery and supporting fire, vegetation, water, or planning records.
Map file information and actual JPG dimensions
The downloadable archive contains the four original JPG maps rather than the WebP display copies used in the article. Each JPG is 2480×1754 pixels according to the supplied asset manifest. That size works well for screen reference, documents, and smaller prints, but it is below the 4961×3508 pixels associated with an A3 image at 300 dpi. Check legends and fine county edges at the intended print size before using the maps in a large-format layout.
Reading a 30-meter raster without treating it as a parcel survey
Annual NLCD is a raster dataset: the landscape is divided into grid cells and each cell receives a representative class or value. Standard land-cover mapping is provided at 30-meter resolution. A cell can contain several real surfaces at once, such as sagebrush, bare soil, a narrow road, and a wet edge. Small features may therefore disappear into the dominant class or be generalized into a neighboring pattern.
Frequently Asked Questions
Why is shrubland so dominant in the Mono County summary?
The 2025 summary assigns 60.12% of the county to shrubland, and the map shows that class covering much of the central and eastern interior. Mono County’s official description also emphasizes sage-covered high desert east of the Sierra. The map can confirm the mapped distribution, but explaining the ecological cause at a specific location would require climate, elevation, soils, fire history, and vegetation information beyond this land-cover layer.
Is the large central water body on the map Mono Lake?
Mono County officially identifies Mono Lake as a large high-desert saline lake within the county, and the prominent central water body provides the expected geographic context for the Mono Basin. The supplied land-cover image does not label the lake by name, so use a labeled official map if exact identification, shoreline detail, or access information is required.
Map File Information
Download the four original JPG land-cover maps for Mono County in one ZIP file.
- Included Files: Use only the versions confirmed in the article and supplied images
- File Type: Use the confirmed download contents
- Intended Use: Printing, education, presentations, and map-based projects
Related Maps
- Alameda County California Land Cover Map
- Alpine County California Land Cover Map
- Amador County California Land Cover Map
Sources and references
- MRLC Annual NLCD Data — access to Annual NLCD land-cover and impervious-surface products
- USGS Annual NLCD Land Cover Classification — land-cover class definitions and interpretation guidance
- Mono County — About Mono County — official geographic context for the Sierra, high desert, lakes, forests, public lands, and Mono Lake
- Mono County General Plan — county policies for growth, development, and natural-resource conservation
- U.S. Census Bureau TIGER/Line Shapefiles — county boundary data
Green Map creates custom-edited map images using open geographic data sources such as geoBoundaries, Natural Earth, OpenStreetMap, and government open data.
These maps are edited visual materials, not raw data files, and are provided for education, documents, presentations, and graphic reference.