Modoc County occupies a very different land-cover setting from California’s coastal cities and Central Valley farm counties. The 2025 summary is led by shrubland at 49.88%, while forest covers 21.26% and grassland 11.35%. Large lakes, wet basins, forested ranges, and small pockets of agriculture break up that broad high-desert surface, so the county is best understood by comparing several map views rather than by looking at one dominant class alone.
This page includes a general land-cover map, a forest-and-farmland view, an impervious-surface map, and a 1985–2025 class-difference map. The maps are displayed as WebP images for reading on the page, and the same four original JPG files are available together in one ZIP below. Use the first map for the county-wide pattern, then move to the other three when you need a clearer look at farming valleys, hard surfaces, or mapped differences between the two comparison years.
Table of Contents
A high-desert county where water and forest interrupt the shrubland
Shrubland is the largest 2025 class at 49.88%, but it does not appear as one featureless block. Forested areas occupy 21.26% of the county and form substantial green masses in the west, south, and along the eastern mountain belt. Grassland contributes another 11.35%, while agriculture accounts for 5.07%, wetlands 4.18%, and water 3.14%. The result is a map with strong regional contrasts: broad tan shrub cover across much of the interior, greener mountain areas around it, and blue or teal basins set into the drier landscape.
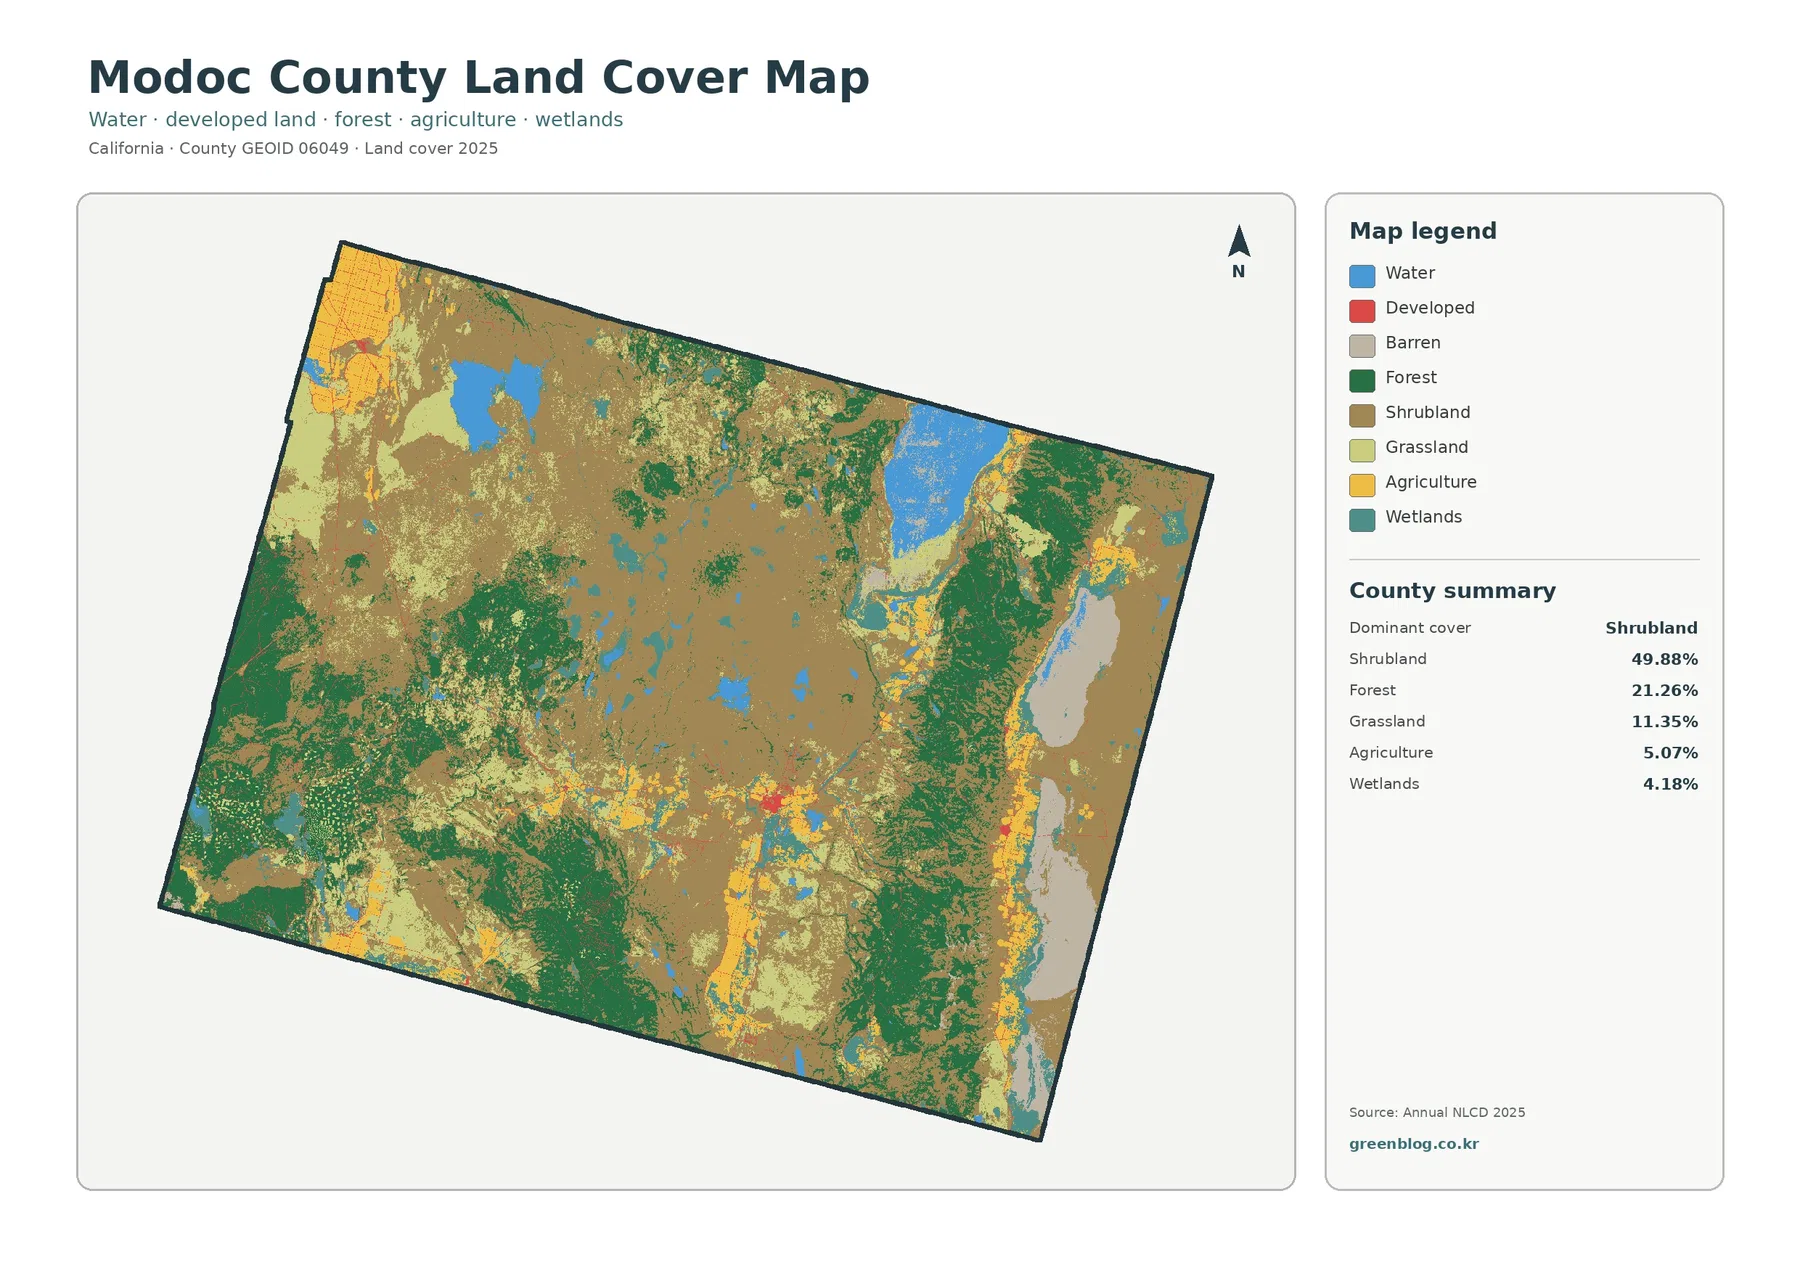
The U.S. Fish and Wildlife Service places Modoc National Wildlife Refuge southeast of Alturas along the South Fork of the Pit River, near the western edge of the Great Basin. It describes a high-elevation cold-desert setting with wetlands, reservoir habitat, shrub-steppe, wet meadows, and cropland. That local mix helps explain why water, wetland, agriculture, and shrub classes meet in the county’s central interior.
The forest pattern follows major uplands rather than filling the county evenly
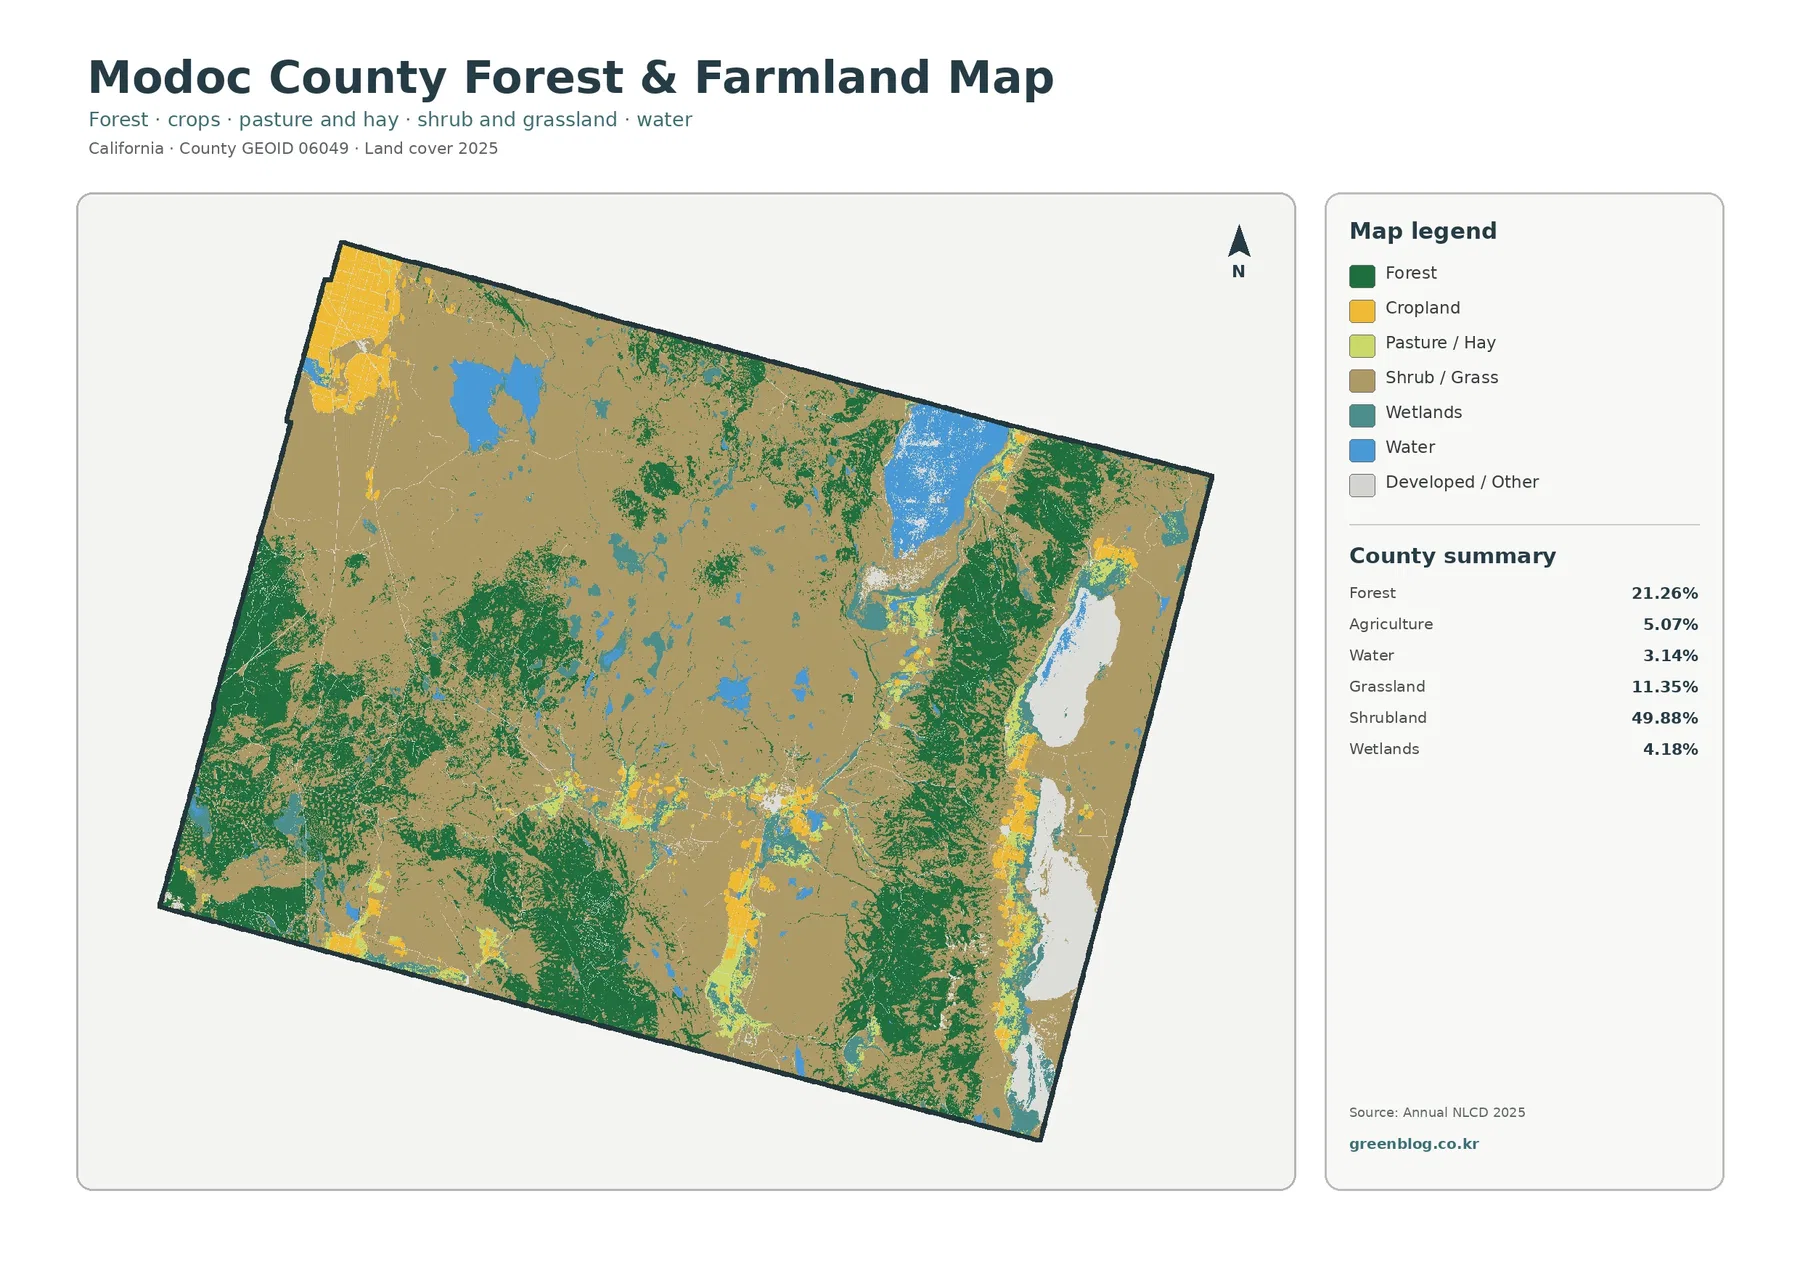
The forest-and-farmland view makes the mountain pattern easy to see. A long green zone runs through the eastern half, with large forest blocks in the west and southwest. The U.S. Fish and Wildlife Service identifies the Warner Mountain range east of the Modoc refuge and the Adin Mountain range to its west, useful context for the broad forest bands around the open interior.
Agriculture is only 5.07%, but it is easy to locate because it clusters in flatter basins
Agricultural cover occupies a modest share of Modoc County, yet its yellow patches are visually distinct. The largest concentrations appear in the northwest and in several central and eastern valley settings, often near water or wetland areas. Instead of spreading uniformly through the county, cropland and pasture-related cover is concentrated in relatively limited zones. That pattern makes the agricultural map useful for identifying broad farming districts without implying that every yellow pixel has the same crop, management system, or legal agricultural designation.
Goose Lake and the dry basins make the water classes unusually important
Water is 3.14% of the 2025 summary and wetlands are 4.18%, percentages that sound small next to shrubland. Visually, however, they are prominent because several large blue or teal areas interrupt the tan high desert. A broad water body appears toward the northeastern side of the county, while additional lakes and wet areas are scattered through the center and south. Wetland colors often form irregular margins or narrow connections around open water rather than appearing as simple isolated shapes.
The U.S. Geological Survey identifies Goose Lake as a terminal lake on the Oregon–California border, one of the important saline-lake ecosystems studied in the region. USGS also describes Surprise Valley in Modoc County as a dry-lake or playa setting with the Warner Mountain Range in the background. Those references help explain why the county can contain both blue open-water basins and pale barren or dry-lake surfaces in the east. Because the supplied map does not print lake names, a labeled USGS or state map should be used when an exact feature name is required.
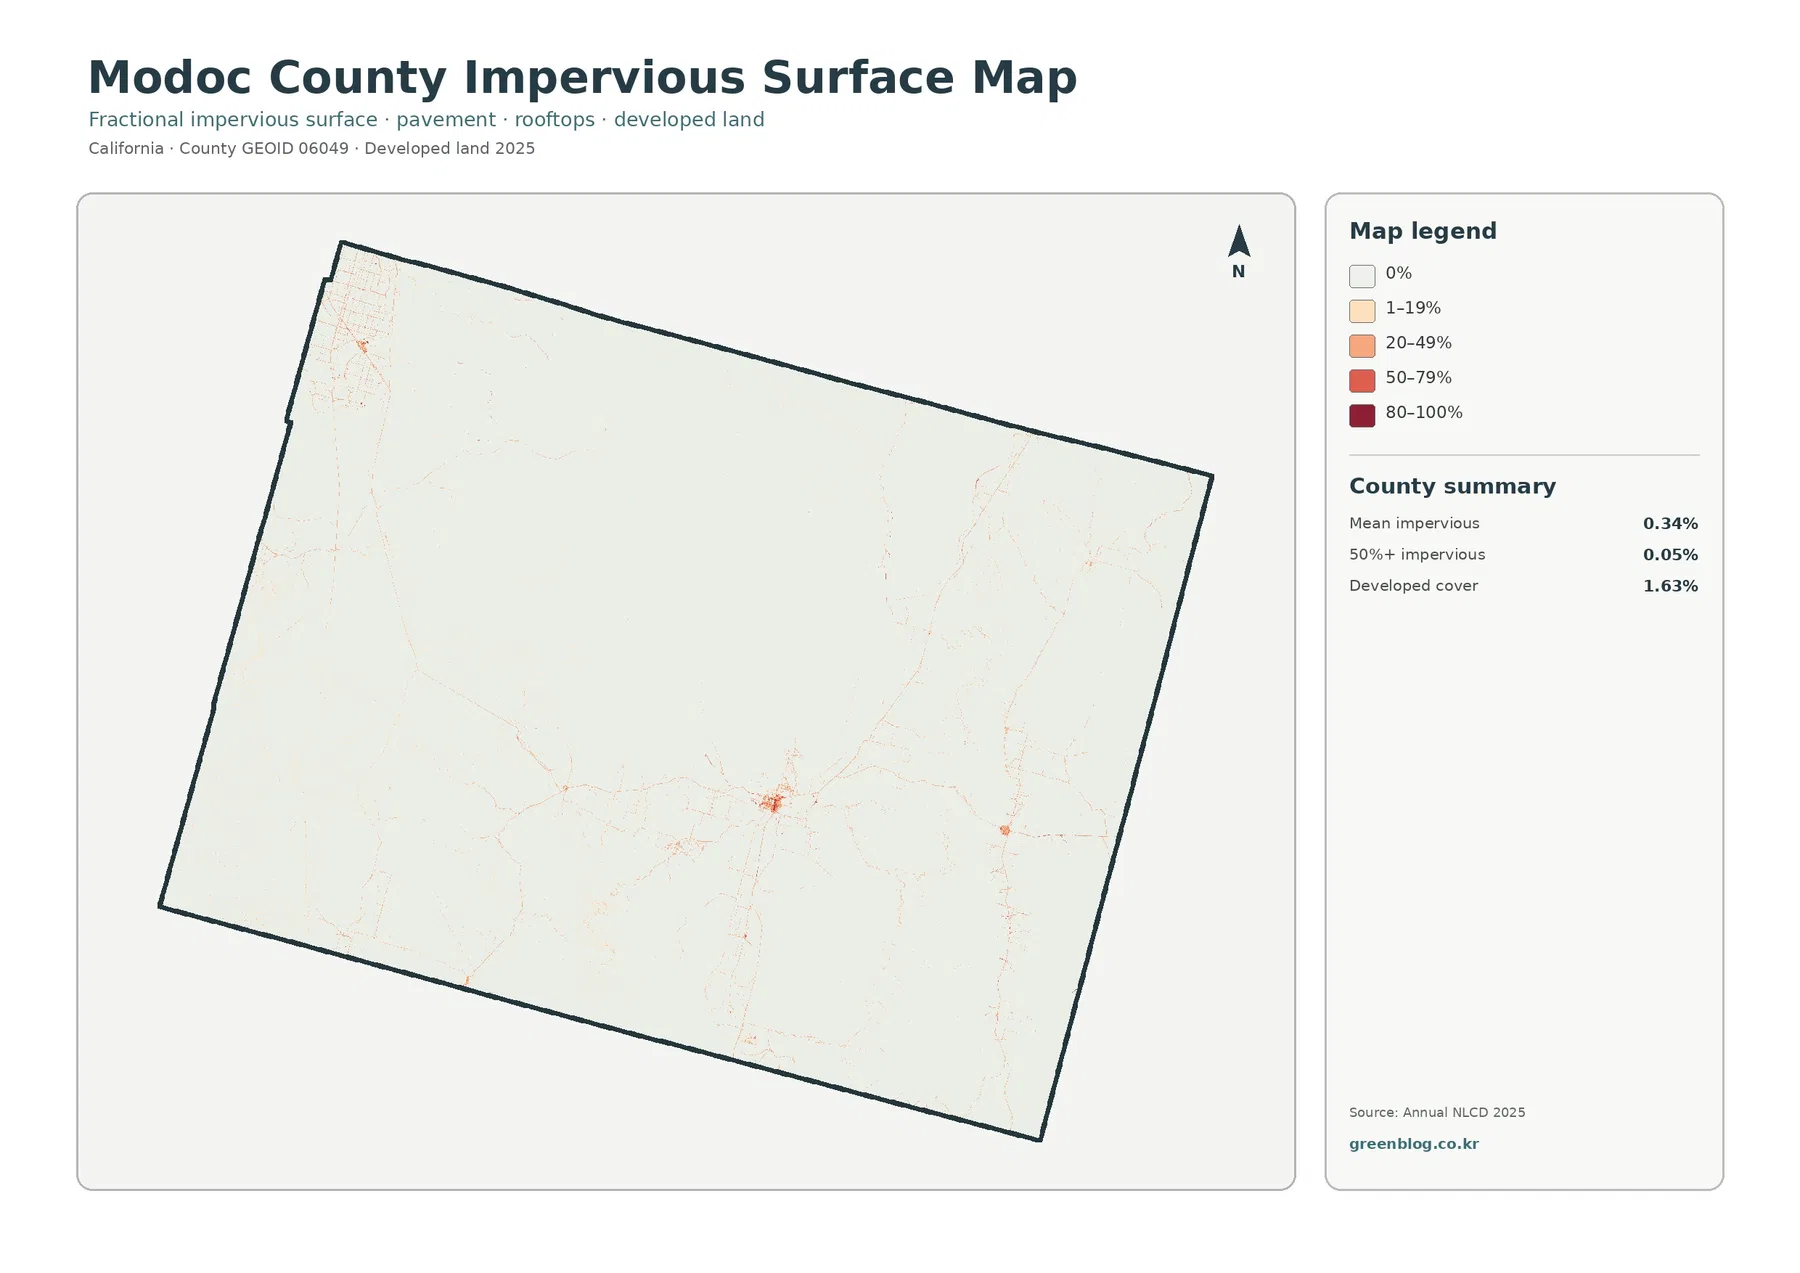
Only a few small places register strongly on the impervious-surface map
Impervious surface means roofs, pavement, and similar materials that prevent water from soaking directly into the soil. Modoc County has a mean impervious value of just 0.34%, and only 0.05% of the county falls in the 50%-or-higher impervious group. Developed cover is 1.63%. The difference between those numbers matters because a developed land-cover class can include lawns, bare soil, trees, and other surfaces that are not sealed by pavement or buildings.
The 1985–2025 comparison is dominated by “other class difference,” not urban conversion
The change map reports that 20.51% of the county has a different mapped class in 1985 and 2025. Within that total, 14.39% is assigned to other class difference, 4.09% to forest loss, 0.57% to agricultural loss, and 0.48% to areas classified as developed. Wetland difference is shown as a separate legend category as well. These categories make it clear that the overall 20.51% figure cannot be described simply as development growth or deforestation.
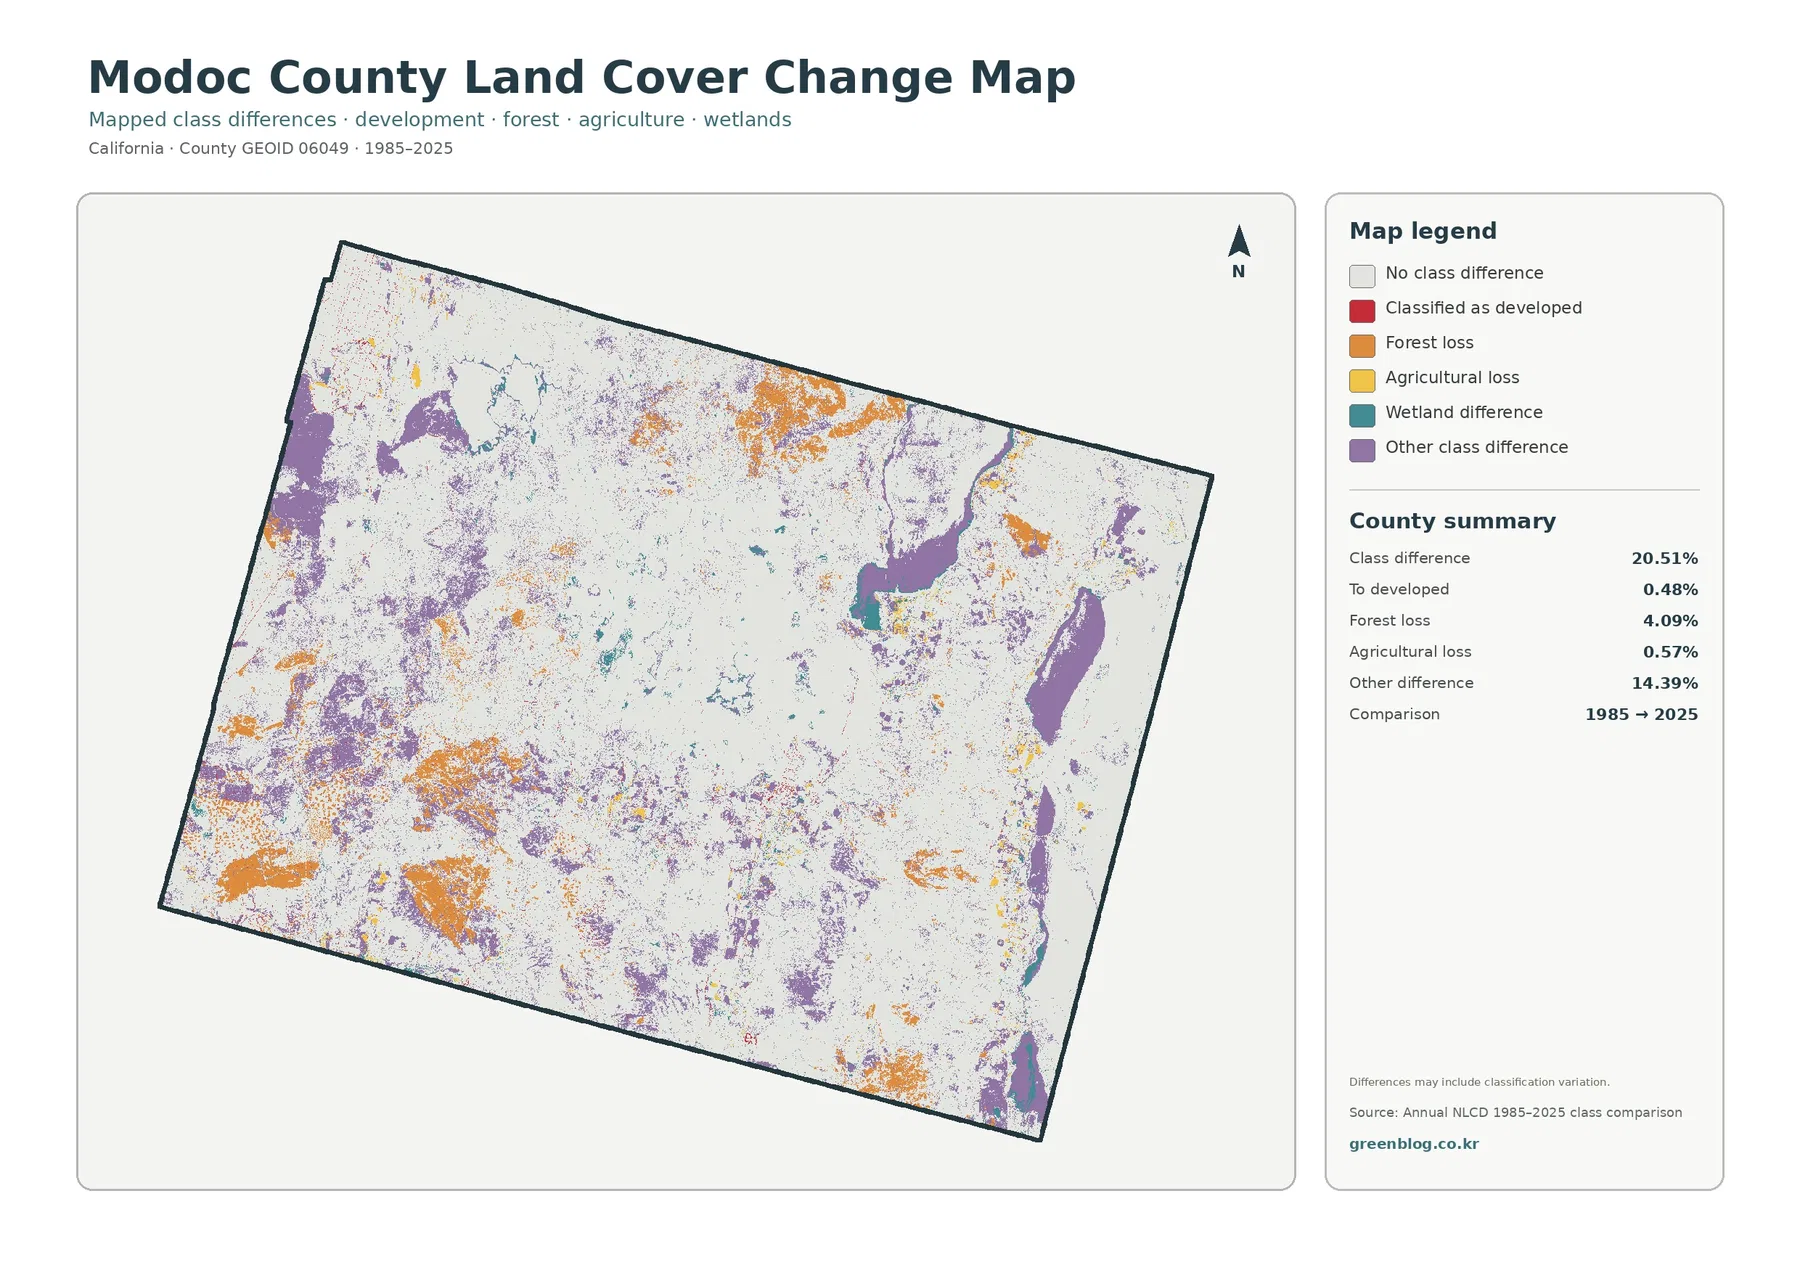
The map itself warns that mapped differences may include classification variation. Real surface change can contribute to a class difference, but so can image conditions, seasonal vegetation, mixed pixels, and changes in classification methods. If a forest-loss patch matters for a specific project, intermediate-year imagery, fire records, timber or vegetation data, and local management information would be needed before assigning a cause. The same caution applies to wetland or agricultural differences.
Download details and actual JPG dimensions
A 30-meter raster is a regional guide, not a parcel survey
Annual NLCD is a raster product, meaning the landscape is divided into grid cells and each cell receives a representative class or value. The standard land-cover resolution is 30 meters. A single cell can contain more than one real-world surface, such as shrub, grass, a narrow road, and a wet edge. The classification simplifies that mixture, so very small features may disappear or be represented by the dominant condition within the cell.
Frequently Asked Questions
Why does shrubland dominate the Modoc County map?
The 2025 summary assigns 49.88% of the county to shrubland, the largest single class. Federal descriptions of the area also place Modoc County at the western edge of the Great Basin in a high-elevation cold-desert setting with extensive shrub-steppe habitat. Forest, grassland, wetlands, water, and agriculture still form large local contrasts, so the county should not be treated as uniform shrubland even though that category leads the total.
What is the difference between 1.63% developed cover and 0.34% mean impervious surface?
Developed cover is a land-cover class that can include both hard and permeable surfaces within developed settings. Mean impervious surface measures the fraction covered by roofs, pavement, and similar materials. A small rural town can therefore occupy developed pixels without every part of those pixels being paved. That is why Modoc County’s developed-cover percentage is higher than its mean impervious value.
Does the 20.51% class difference mean that one-fifth of the county was physically transformed?
Not necessarily. It means that the mapped class in 1985 differs from the mapped class in 2025 across 20.51% of the county. Real land-surface change can be part of that result, but the map also notes that classification variation may contribute. To confirm what happened at a particular location, compare intermediate imagery and use fire, vegetation, agricultural, wetland, or local planning records as appropriate.
Map File Information
Download the four original JPG land-cover maps for Modoc County in one ZIP file.
- Included Files: Use only the versions confirmed in the article and supplied images
- File Type: Use the confirmed download contents
- Intended Use: Printing, education, presentations, and map-based projects
Related Maps
- Alameda County California Land Cover Map
- Alpine County California Land Cover Map
- Amador County California Land Cover Map
Sources and references
- MRLC Annual NLCD Data — access to Annual NLCD land-cover and impervious-surface products
- USGS Annual NLCD Land Cover Classification — class definitions and interpretation guidance
- U.S. Fish & Wildlife Service — Modoc National Wildlife Refuge — local context for the Pit River, wetlands, reservoirs, shrub-steppe, and cropland near Alturas
- USGS — Goose Lake, Oregon-California — geographic context for the large terminal lake on the state border
- USGS — Surprise Valley, California — geographic context for playa surfaces and the Warner Mountain Range in Modoc County
Green Map creates custom-edited map images using open geographic data sources such as geoBoundaries, Natural Earth, OpenStreetMap, and government open data.
These maps are edited visual materials, not raw data files, and are provided for education, documents, presentations, and graphic reference.