Napa County looks very different depending on which surface feature is isolated. Hard built surfaces form a strong southern cluster, Lake Berryessa occupies a large part of the east, and shrubland plus grassland cover more than two-thirds of the county. The four maps on this page separate those features so the same county boundary can be compared without forcing every land-cover class into one view.
A ZIP download near the end of the article contains the four original JPG maps: general land cover, forest and farmland, impervious surface and developed land, and the 1985–2025 comparison. They are reference maps of physical surface cover. A color on these maps does not establish zoning, parcel ownership, a permit status, or a legal land-use designation.
Table of Contents
The southern valley contains most of the county’s hard surface
The impervious-surface view immediately separates Napa County’s dense southern footprint from its much more lightly built uplands. Mean impervious surface is 2.62%, while 2.13% of the county is mapped at 50% or greater imperviousness. The darkest values form the largest cluster in the south. Smaller patches and narrow traces continue north through the valley, with another separate cluster visible in the northwest.
Most eastern and northeastern uplands remain pale on this map. Even around Lake Berryessa, high-impervious areas are limited to small pockets and narrow routes rather than a broad urban field. That contrast helps explain why developed cover can be 7.70% while the countywide mean impervious value is much lower. A developed land-cover class may include lawns, trees, bare ground, or other permeable surfaces inside a developed setting; impervious surface focuses more directly on pavement, rooftops, and similar hard cover.
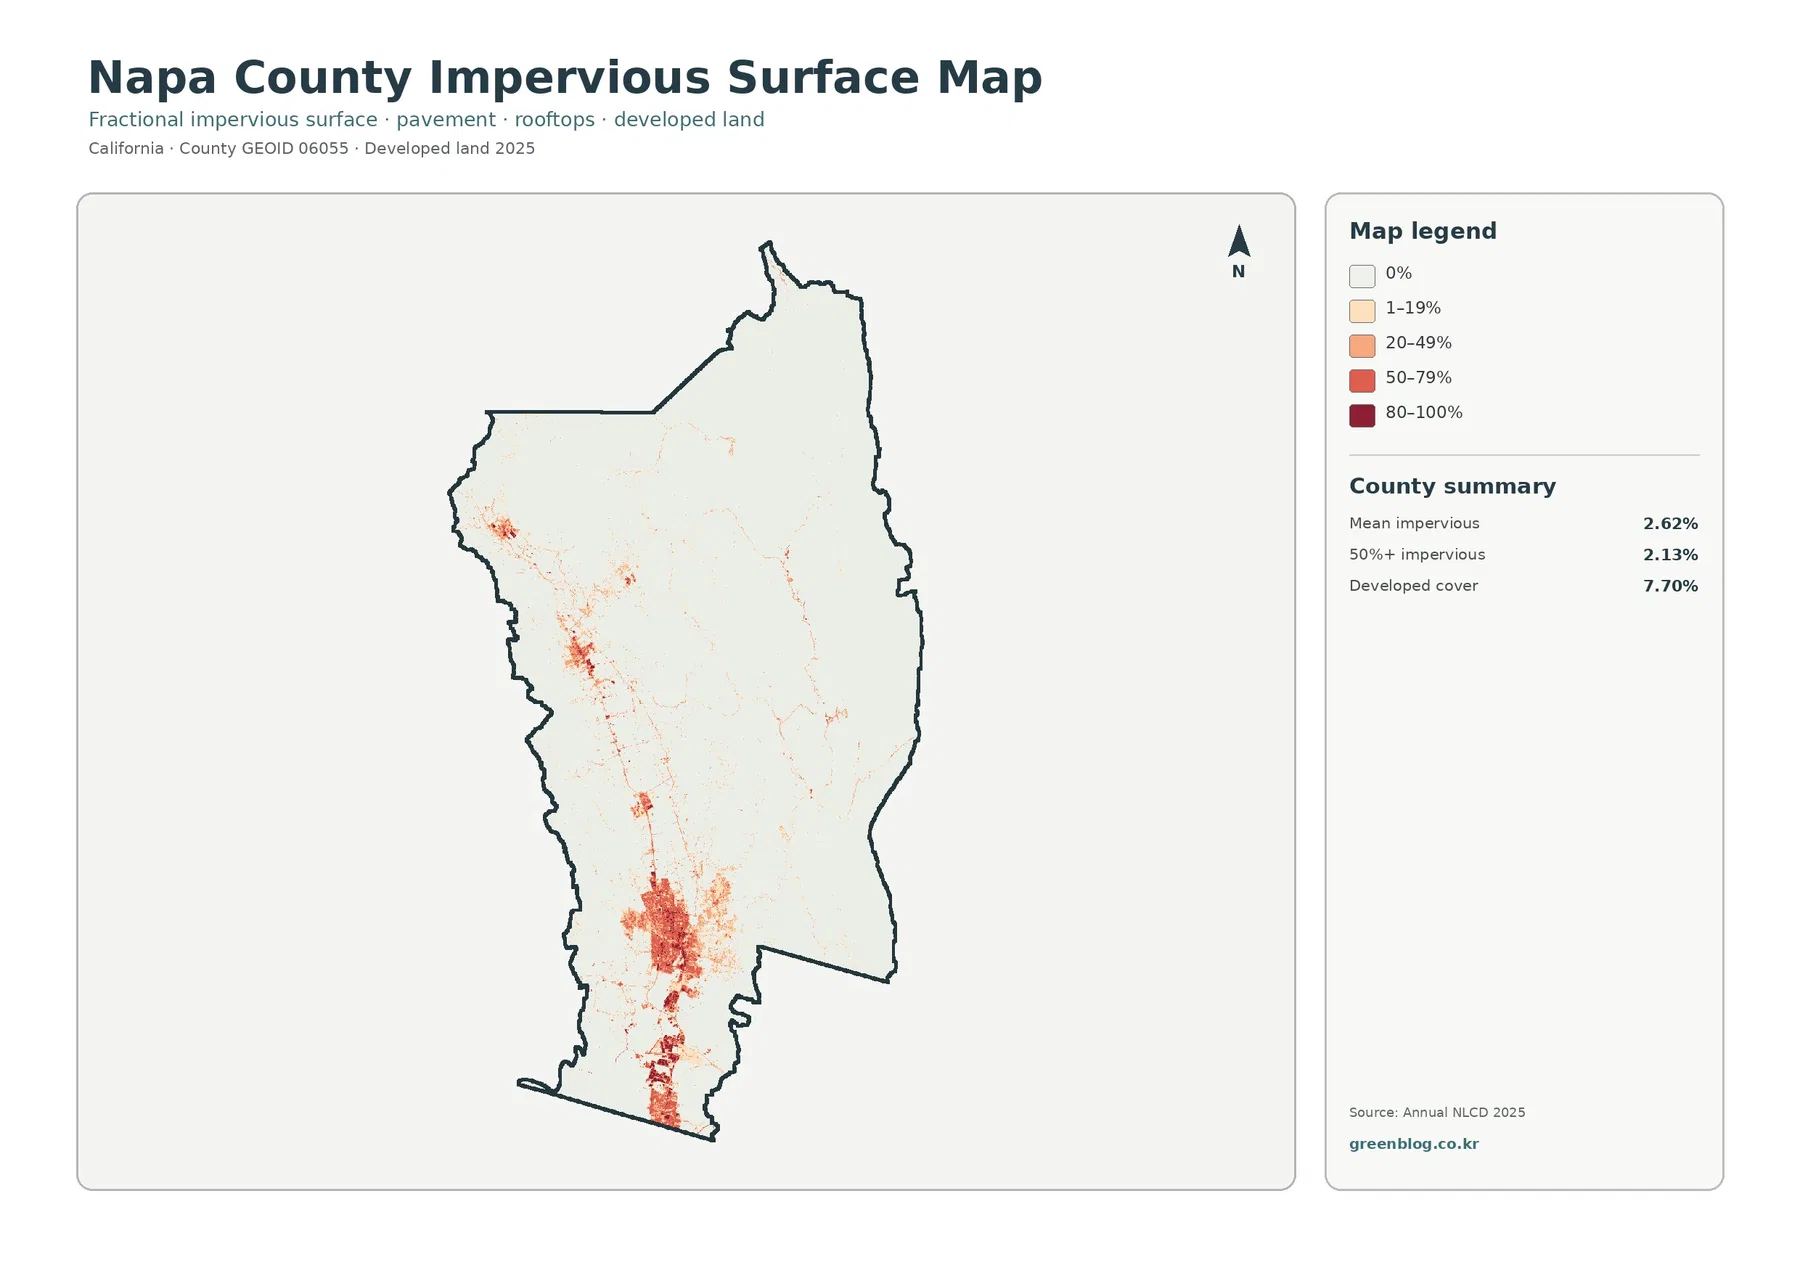
In a watershed lesson, the southern cluster gives students a clear place to compare hard surfaces with the county’s open eastern terrain before streams or drainage data are added. It does not calculate runoff or flood risk. Terrain, soil, drainage infrastructure, streams, and rainfall all affect how water moves, and those factors are not fully represented by an impervious percentage alone. The map is best treated as a county-scale surface comparison rather than an engineering layer.
Small roads and individual buildings also fall below the level of detail implied by the county outline. Annual NLCD is a raster product, so a grid cell can contain more than one real-world surface. A rural road may share a cell with grass or shrubs, and a developed cell can still contain substantial vegetation. The pattern of concentration is reliable for visual comparison at this scale, but the image should not be used to measure a parcel or a driveway.
The 2025 overview is dominated by shrubland, grassland, and eastern water
Once the built footprint is located, the general land-cover map shows what surrounds it. Shrubland is the largest class at 34.36%, followed closely by grassland at 33.46%. Together they account for 67.82% of Napa County. Forest covers 11.45%, developed land 7.70%, and agriculture 5.65%. Those totals make the county look overwhelmingly open at first glance, but the location of each smaller class creates the most recognizable regional structure.
Water contributes 5.55% and wetlands 1.77%. Lake Berryessa is the major blue feature in the eastern half, where open shrub and grass cover extend across much of the surrounding upland. West of the lake, the color pattern becomes more varied. Forest appears more often in western and central terrain, agriculture forms a narrow valley corridor, and developed cover becomes much stronger toward the southern end.
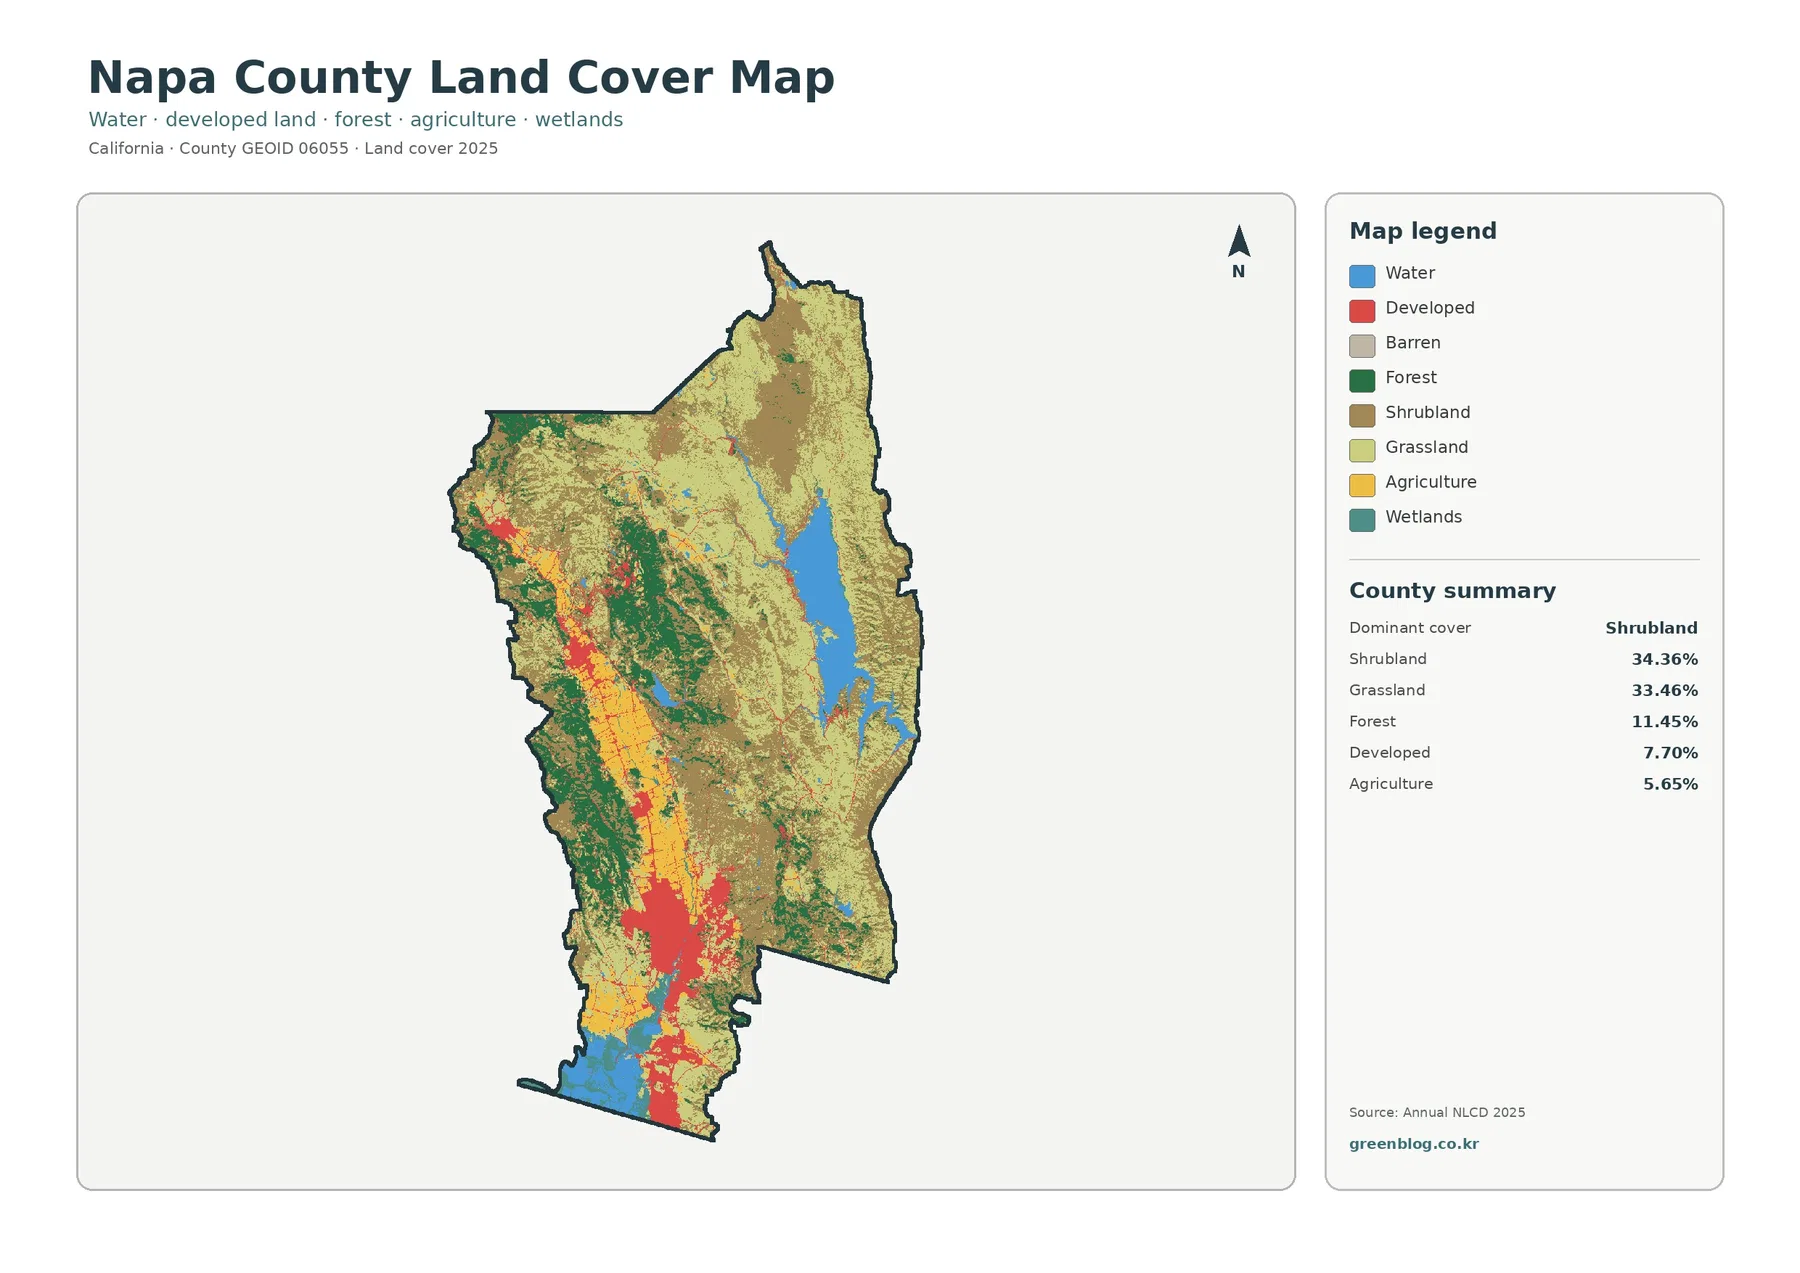
The agricultural share is a good example of why area percentage and visual importance are not the same thing. Yellow agricultural cover occupies only 5.65% countywide, yet it forms a distinct north-south belt through the valley. Developed cover behaves in a similar way. Much of its 7.70% share is packed into the south and into smaller valley settlements, so it stands out clearly against the much larger but more dispersed shrub and grass classes.
The legend describes surface cover, not legal use. A red developed pixel does not mean every part of that cell is paved or densely built. An agricultural pixel does not define an agricultural zoning district. Forest identifies the dominant mapped surface, not a protected-area boundary. Keeping those distinctions separate prevents the map from being asked to answer questions that belong to county planning, cadastral, or permitting records.
Forest and farmland reveal a narrow cultivated corridor beside wooded uplands
The forest-and-farmland map simplifies the palette and makes the valley’s agricultural shape much easier to follow. Yellow cropland and pasture-related cover starts in the south and continues north through a relatively narrow western-central corridor. Broad eastern uplands do not show the same agricultural concentration. This is why agriculture can occupy a modest countywide share while still providing one of the clearest directional patterns in the county.
Green forest patches are more common along western and central uplands and frequently sit close to the agricultural corridor. The northwest also contains forest, though it is mixed with shrub and grass cover rather than forming one continuous block. Moving toward the eastern side, open shrub and grass classes become much more dominant, while Lake Berryessa remains the major water feature. The simplified map therefore emphasizes a sequence from wooded western terrain to cultivated valley floor and then to broad open cover around the eastern lake.
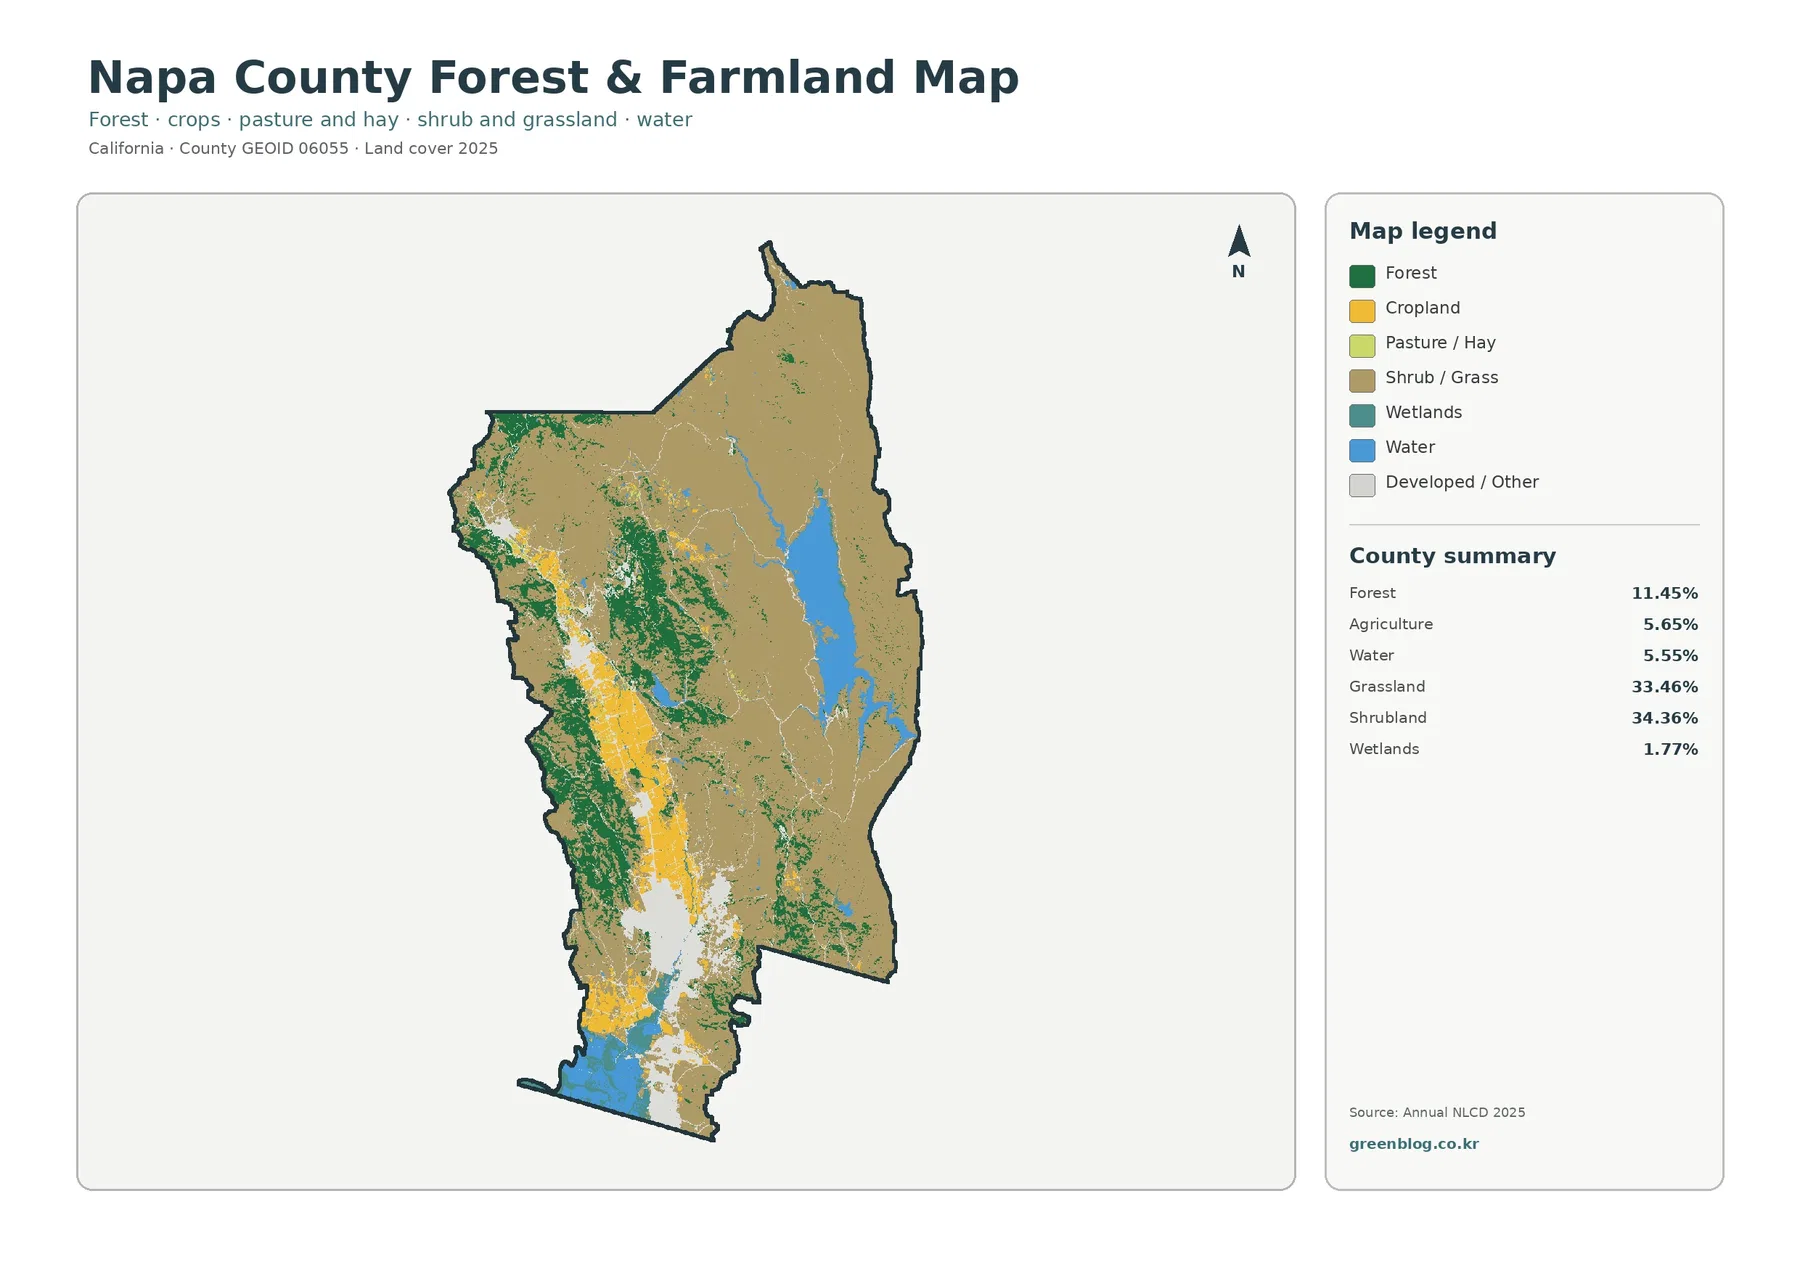
The agriculture category should not be treated as a crop inventory. Nothing in this map’s summary legend identifies individual crop types, so the yellow areas should not be assigned a specific crop from appearance alone. County agricultural reports or other dedicated records are the correct sources for crop composition. The map answers a simpler question: where does land classified as agricultural cover occur relative to forest, open vegetation, water, and developed areas?
That narrower question keeps a classroom or regional comparison focused on location rather than crop identity. A student can trace the farming corridor, compare its width with surrounding forest, and then look east to see how quickly the dominant cover changes. A presentation can place this version beside the general map to reduce legend complexity while preserving the same county boundary. Exact elevation or slope should not be inferred from the vegetation colors; a separate terrain dataset is needed for those measurements.
A 40.68% class difference does not mean 40.68% of the county was completely transformed
The 1985–2025 comparison reports a different mapped class across 40.68% of Napa County. The displayed summary lists 2.32% classified to developed, 12.97% forest loss, 0.75% agricultural loss, and 24.28% other class difference. The legend also includes wetland difference, although the county summary does not give it a separate percentage. The large “other difference” category matters because it shows that the map is broader than a development or forest-loss graphic. Many kinds of class transitions are grouped into the comparison.
Purple other-difference areas cover large parts of northern and eastern uplands. Orange forest-loss categories appear extensively in portions of the western and central terrain. Red cells classified to developed are far more concentrated, especially in the south and around settlement areas. White areas retain the same mapped class at the two endpoints. Fine speckling occurs beside larger patches, which is one reason individual small cells should be interpreted cautiously.
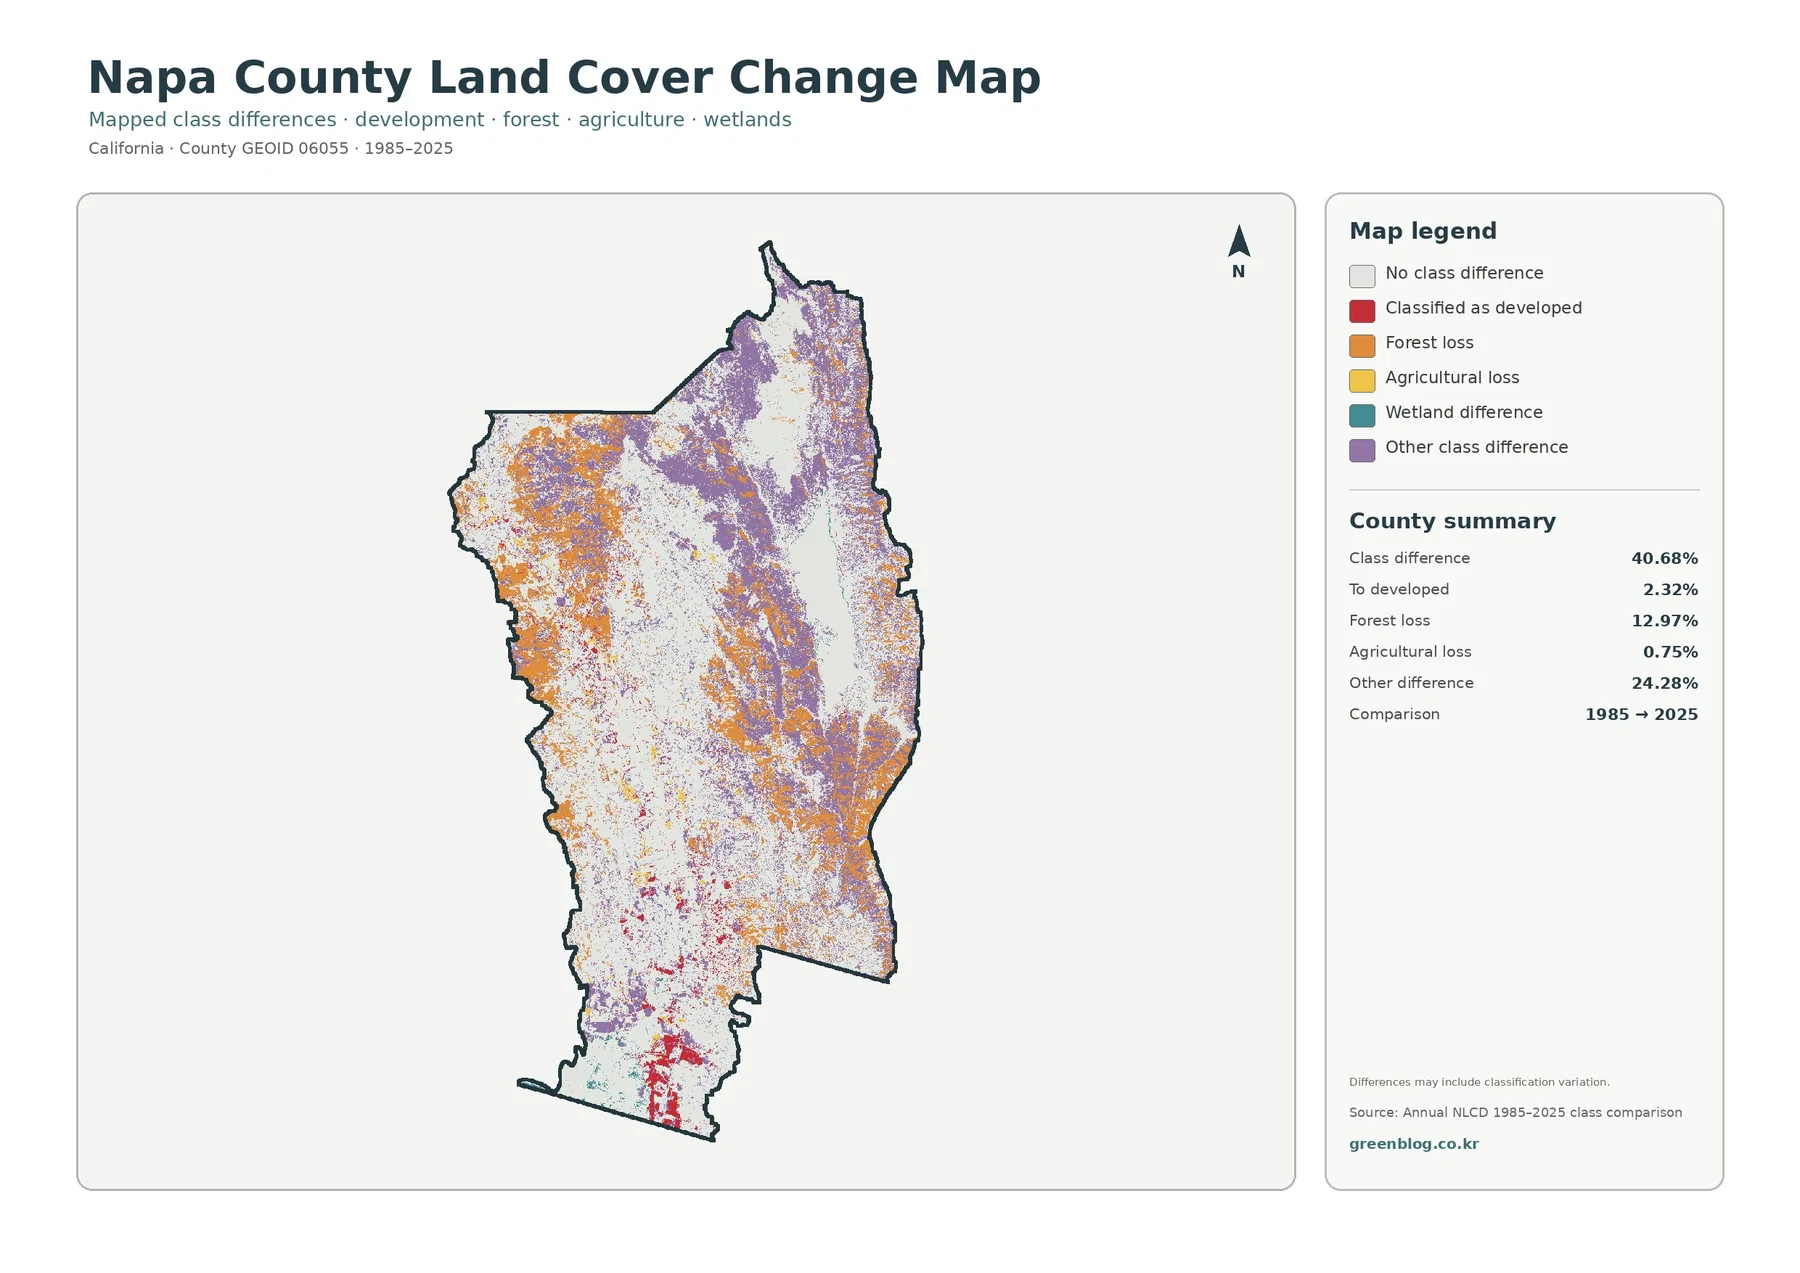
The supplied map warns that class differences may include classification variation. Real surface change can be present, but image conditions, mixed pixels, vegetation state, and classification decisions can also affect whether two years receive the same label. A change-colored cell is therefore a location to investigate, not proof of one specific event.
Forest loss at 12.97% is especially easy to overinterpret. The image does not identify fire, management, drought, harvest, or any other cause. Establishing a cause requires additional evidence such as intermediate Annual NLCD years, aerial imagery, fire history, or local resource records. The 2.32% classified-to-developed figure needs the same discipline; the comparison marks a class outcome, not the reason behind it.
Choosing a map for a specific Napa County question
For a county profile, the general land-cover map gives the broadest single view. It keeps Lake Berryessa, shrub and grass uplands, forest, agriculture, wetlands, and development in one frame. When the question narrows to the agricultural corridor and adjacent woodland, the forest-and-farmland version removes much of the extra color and makes those two covers easier to trace.
Urban-surface questions belong with the impervious map. Comparing its 2.62% mean impervious value with 7.70% developed cover shows why “developed” and “paved” should not be treated as synonyms. The map also separates the dense southern cluster from the much lighter eastern uplands more clearly than the general land-cover legend does.
The change map belongs at the end of a comparison rather than at the beginning of an explanation. After locating a purple, orange, or red change area, return to the 2025 overview to see its current class. A red change cluster can then be checked against the impervious surface image. An orange forest-loss area can be compared with the forest-and-farmland view. This sequence keeps the interpretation tied to visible evidence instead of turning one change color into a guessed story.
Because each theme is a separate JPG, a print layout or presentation can use only the Napa County views needed for that question. A classroom slide may need only the overview and impervious map, while a landscape-change exercise can use all four at the same county outline. A local planning discussion can use the maps as broad physical context before moving to official zoning, parcel, environmental, or infrastructure records.
Map File Information
The WebP images above are page previews. The downloadable ZIP contains four original JPG files, one for each map theme. The general map provides the overall 2025 snapshot. The forest-and-farmland file isolates selected natural and agricultural cover, while the impervious map focuses on hard surfaces and development. The final JPG compares mapped classes between 1985 and 2025.
Keep the legend and year with any exported or printed map when possible. The change image loses important meaning if the 1985–2025 comparison period is omitted, and the current maps should remain identified as 2025 classifications. The JPGs are finished reference graphics rather than raw analytical layers. Pixel values, intermediate years, and formal GIS analysis should use the official datasets listed below.
What 30-meter raster data can and cannot show
USGS describes Annual NLCD as a 30-meter raster product. Raster data divides the landscape into grid cells and assigns a mapped value to each cell. That structure is well suited to consistent countywide comparison, but it generalizes small details. A single 30-meter cell may contain part of a road, nearby vegetation, and a building edge at the same time.
Mixed cells matter along field edges, narrow roads, shorelines, wetland strips, and the border between developed and natural cover. A crisp line on a county-scale image can be more complicated on the ground. The change comparison has the same limitation: a boundary cell can receive different labels in two years even when the real-world transition is subtle. Conditions after 2025 are outside the current maps as well.
Legal land use requires a different source. An agricultural land-cover class does not prove an agricultural zoning designation. A developed class does not say whether more construction is allowed, and forest cover does not establish a conservation boundary. Napa County Planning, Building & Environmental Services and other official local records are appropriate for zoning, permits, parcels, and regulatory questions.
Frequently Asked Questions
Why does Napa County look mostly open even though development is prominent in the south?
Shrubland and grassland together account for 67.82% of the 2025 county summary, so open natural cover occupies most of the county. Development is only 7.70%, but much of it is concentrated in the southern valley and smaller settlement clusters. Concentration makes the developed areas visually prominent without requiring them to cover a large share of the county.
Which Napa County map is best for comparing the agricultural valley with surrounding forest?
The forest-and-farmland map is the clearest choice because it reduces the number of competing colors. Agriculture forms a narrow valley corridor, while forest is more common along western and central uplands. The general land-cover map is useful as a companion because it adds shrubland, grassland, development, wetlands, and Lake Berryessa back into the same county outline.
Does every colored area on the 1985–2025 map represent confirmed land-use change?
No. The comparison marks cells whose land-cover class differs between the two endpoint years, and the map itself notes that classification variation may be included. Real change can be part of the signal, but a specific cause should be checked with intermediate land-cover years, aerial imagery, fire records, agricultural information, or local planning records.
Sources and reference material
The links below provide the official Annual NLCD background for the mapped classes and 30-meter resolution, a federal boundary reference, Napa County planning information, and official context for Lake Berryessa. They are complementary sources rather than substitutes for one another.
- MRLC Annual NLCD Data — annual land-cover and related products
- USGS Annual NLCD Collection 1.2 Land Cover — 2025 coverage, class documentation, and 30-meter raster information
- U.S. Census Bureau TIGER/Line Shapefiles — county boundary reference data
- Napa County Planning, Building & Environmental Services — official local planning and environmental information
- U.S. Bureau of Reclamation: Lake Berryessa — official information for the major eastern water feature
Map File Information
The ZIP includes all four original JPG land-cover maps for Napa County, California.
- File Type: ZIP containing four JPG files
Related Maps
- Alameda County California Land Cover Map
- Alpine County California Land Cover Map
- Amador County California Land Cover Map
Green Map creates custom-edited map images using open geographic data sources such as geoBoundaries, Natural Earth, OpenStreetMap, and government open data.
These maps are edited visual materials, not raw data files, and are provided for education, documents, presentations, and graphic reference.