Across a vast desert interior, the La Paz County Arizona Land Cover Map makes the county’s small but important exceptions easy to spot. Shrubland covers 85.09% of the county in the 2025 summary, yet the west and northwest contain a very different mix of agriculture, water, barren ground, and developed patches. Those narrow and compact areas are easy to miss in a countywide percentage but stand out clearly on the maps.
Four views are provided on this page: general land cover, forest and farmland, impervious surface/developed land, and a 1985–2025 land-cover comparison. Near the end of the page, one download contains all four original 2480 × 1754 JPG files. They are suited to classroom reference, presentation graphics, county comparison, and broad environmental study.
Table of Contents
The Colorado River edge breaks the county’s shrubland pattern
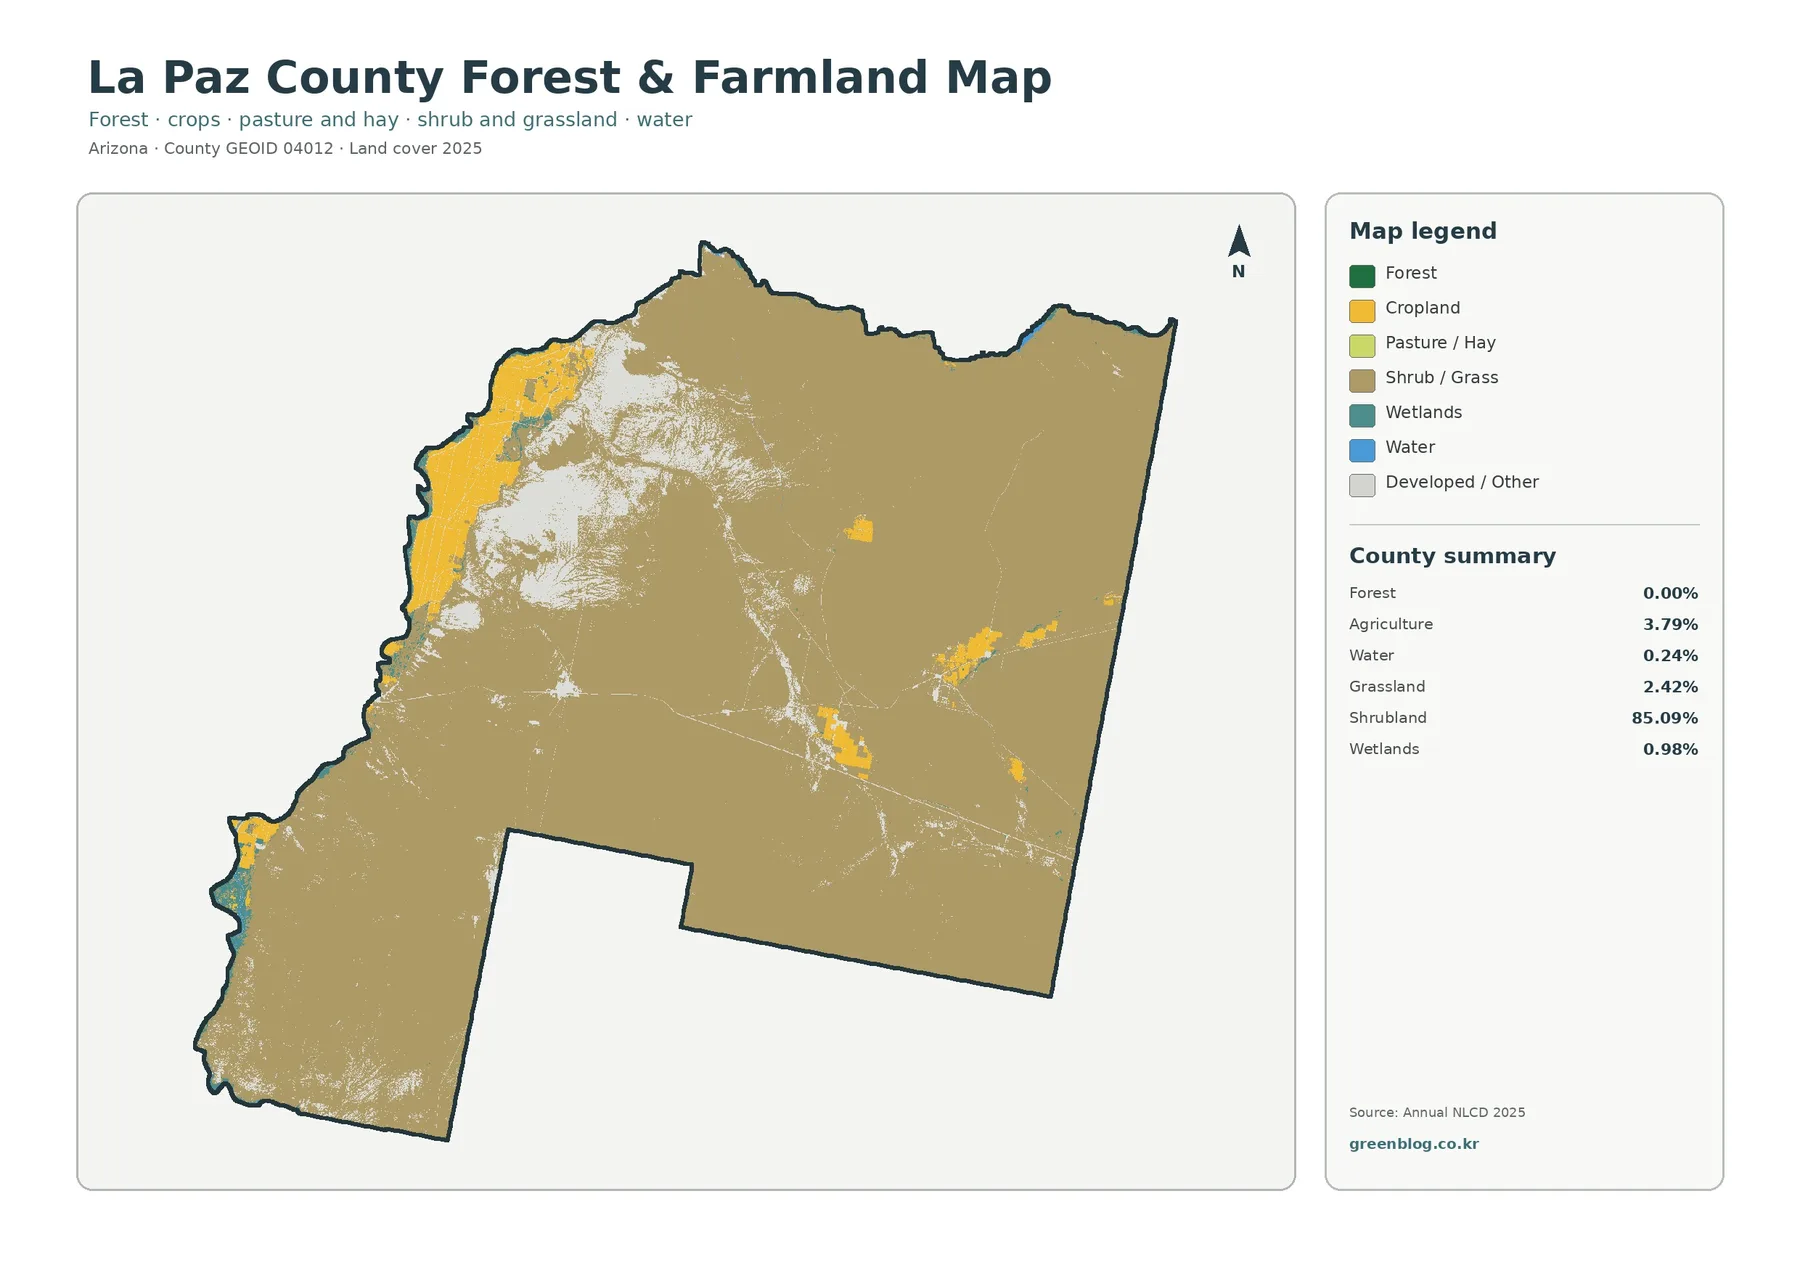
The simplified forest-and-farmland view makes the western agricultural belt easier to see than the full land-cover map. Yellow agricultural cells are concentrated along the northwest and western edge, where the Colorado River forms Arizona’s boundary. Smaller agricultural patches occur farther inland, but they are much less extensive than the river-side concentration.
Official county information identifies agriculture and tourism as leading parts of the local economy and highlights water recreation along the Colorado River and Parker Strip. That local description fits the geography visible here: agriculture and water occupy small countywide percentages but are strongly concentrated along the western river corridor. Crop type, irrigation rights, and farm ownership are outside the scope of this land-cover view and require separate records.
Water accounts for 0.24% of the county and wetlands for 0.98%. Those percentages are small because rivers and wet areas are narrow compared with the county’s large desert interior. Small area does not mean small local importance. A long river corridor can support recreation, farming, wildlife habitat, and communities while still contributing very little to the county’s total land area.
Forest is listed at 0.00% in the 2025 summary. That should be read as a classification result rather than a claim that no individual trees occur anywhere in La Paz County. Annual NLCD assigns a representative class to raster cells, so scattered trees or small wooded sites can fall within other dominant land-cover classes.
Hard surfaces occupy very little land but form visible local clusters
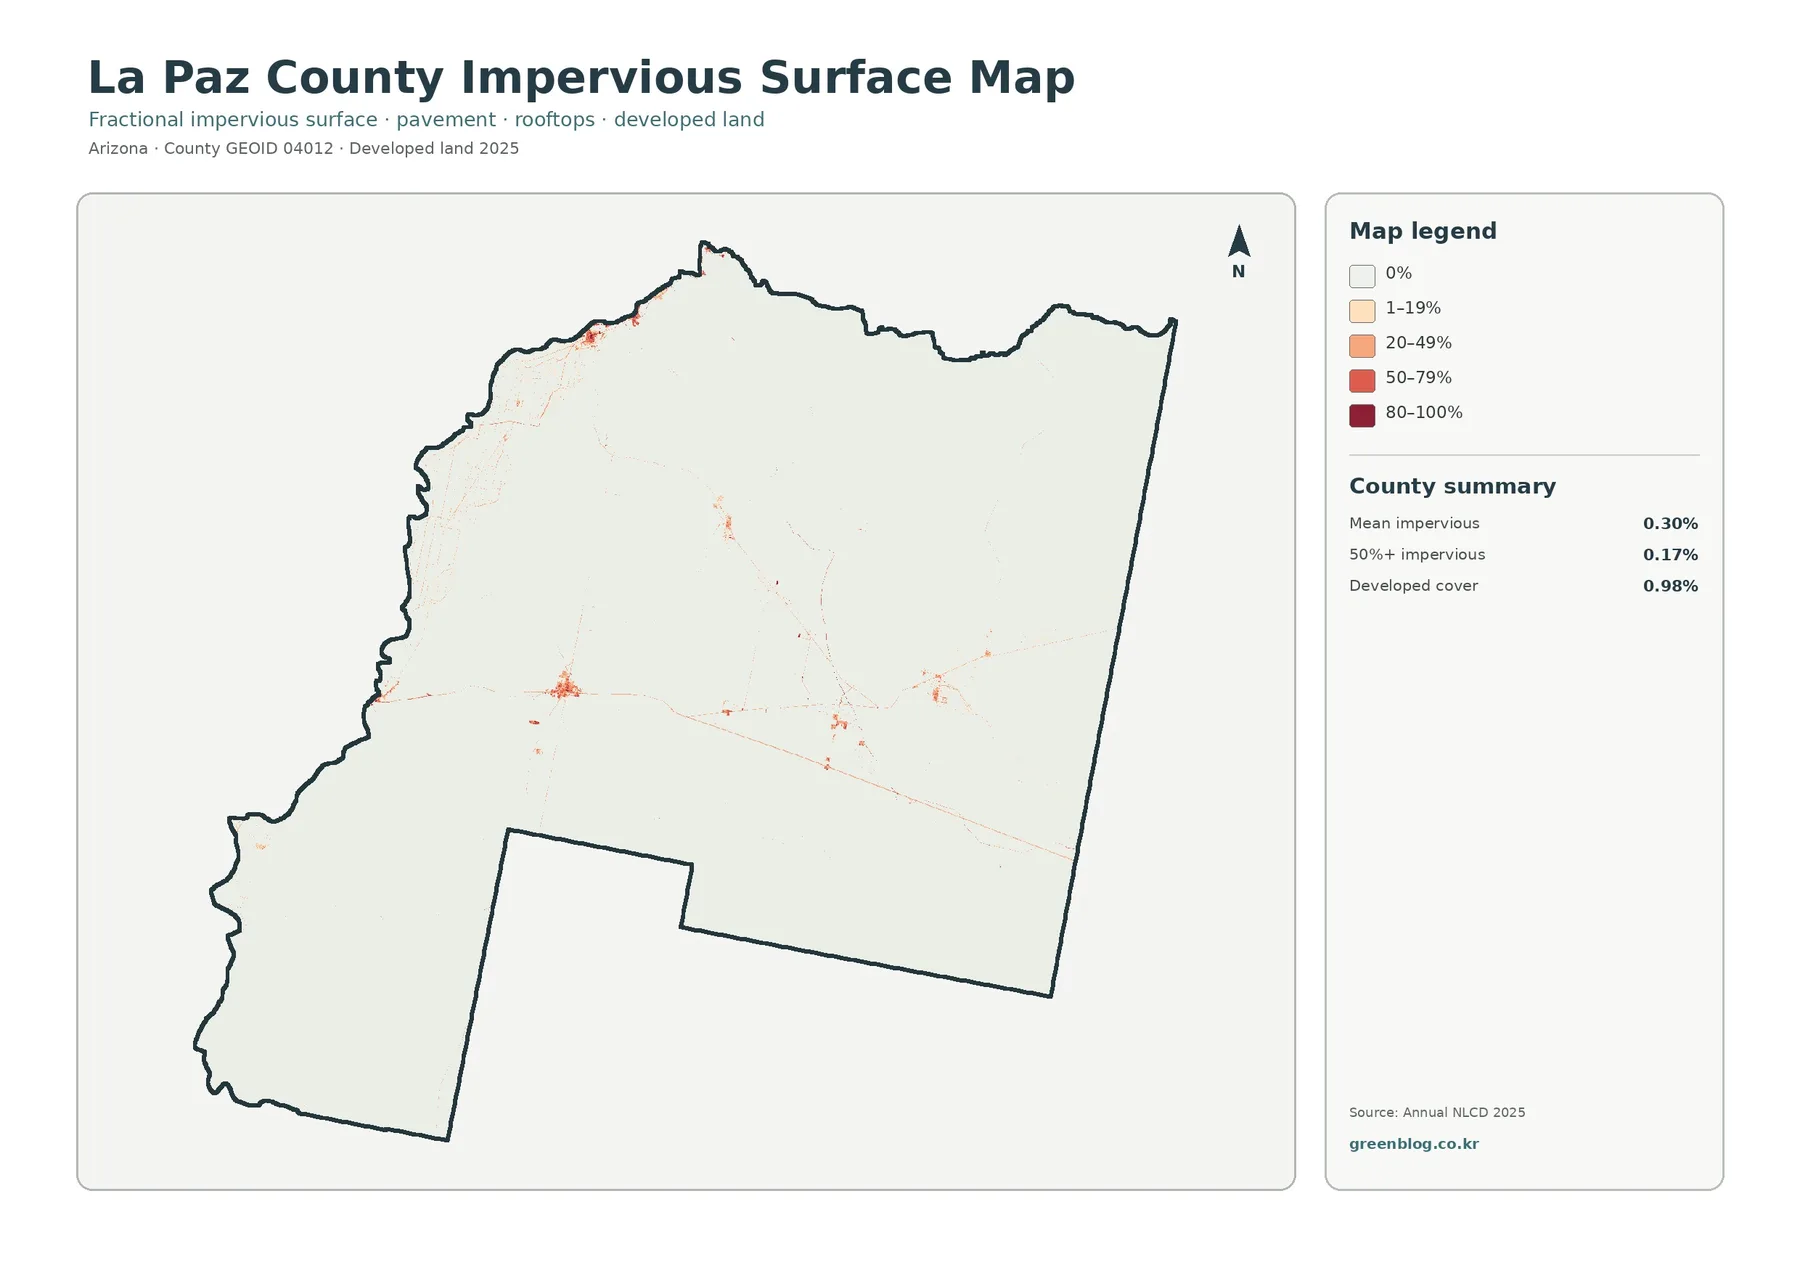
Impervious surface means pavement, rooftops, and other hard material that limits water infiltration. The countywide mean is just 0.30%, and cells that are at least 50% impervious account for 0.17%. Most of the map is therefore almost white. Orange and red marks are limited to a few clusters in the northwest, west-central area, and several smaller interior locations.
The county’s official information identifies Parker and Quartzsite as its main population and business centers. Hard surfaces are clearly concentrated rather than evenly spread across the county, although the unlabeled raster image should not be used to trace exact municipal boundaries. The best use is to compare the concentration of built surfaces with the surrounding desert landscape.
Developed land cover at 0.98% is a different measure from mean imperviousness at 0.30%. A developed cell may contain buildings and roads together with soil, trees, landscaping, or other permeable surfaces. Imperviousness measures hard cover more directly. Keeping the two statistics separate prevents a developed land-cover percentage from being mistaken for the share of the county that is paved.
This view is useful for county-scale comparisons, but it is not a parcel or engineering map. A roughly 30-meter classification cell can contain several surface types. Measuring a specific road, building site, parking lot, or drainage area requires more detailed imagery and local GIS or survey information.
Shrubland dominates 85.09%, while barren ground forms the largest secondary class
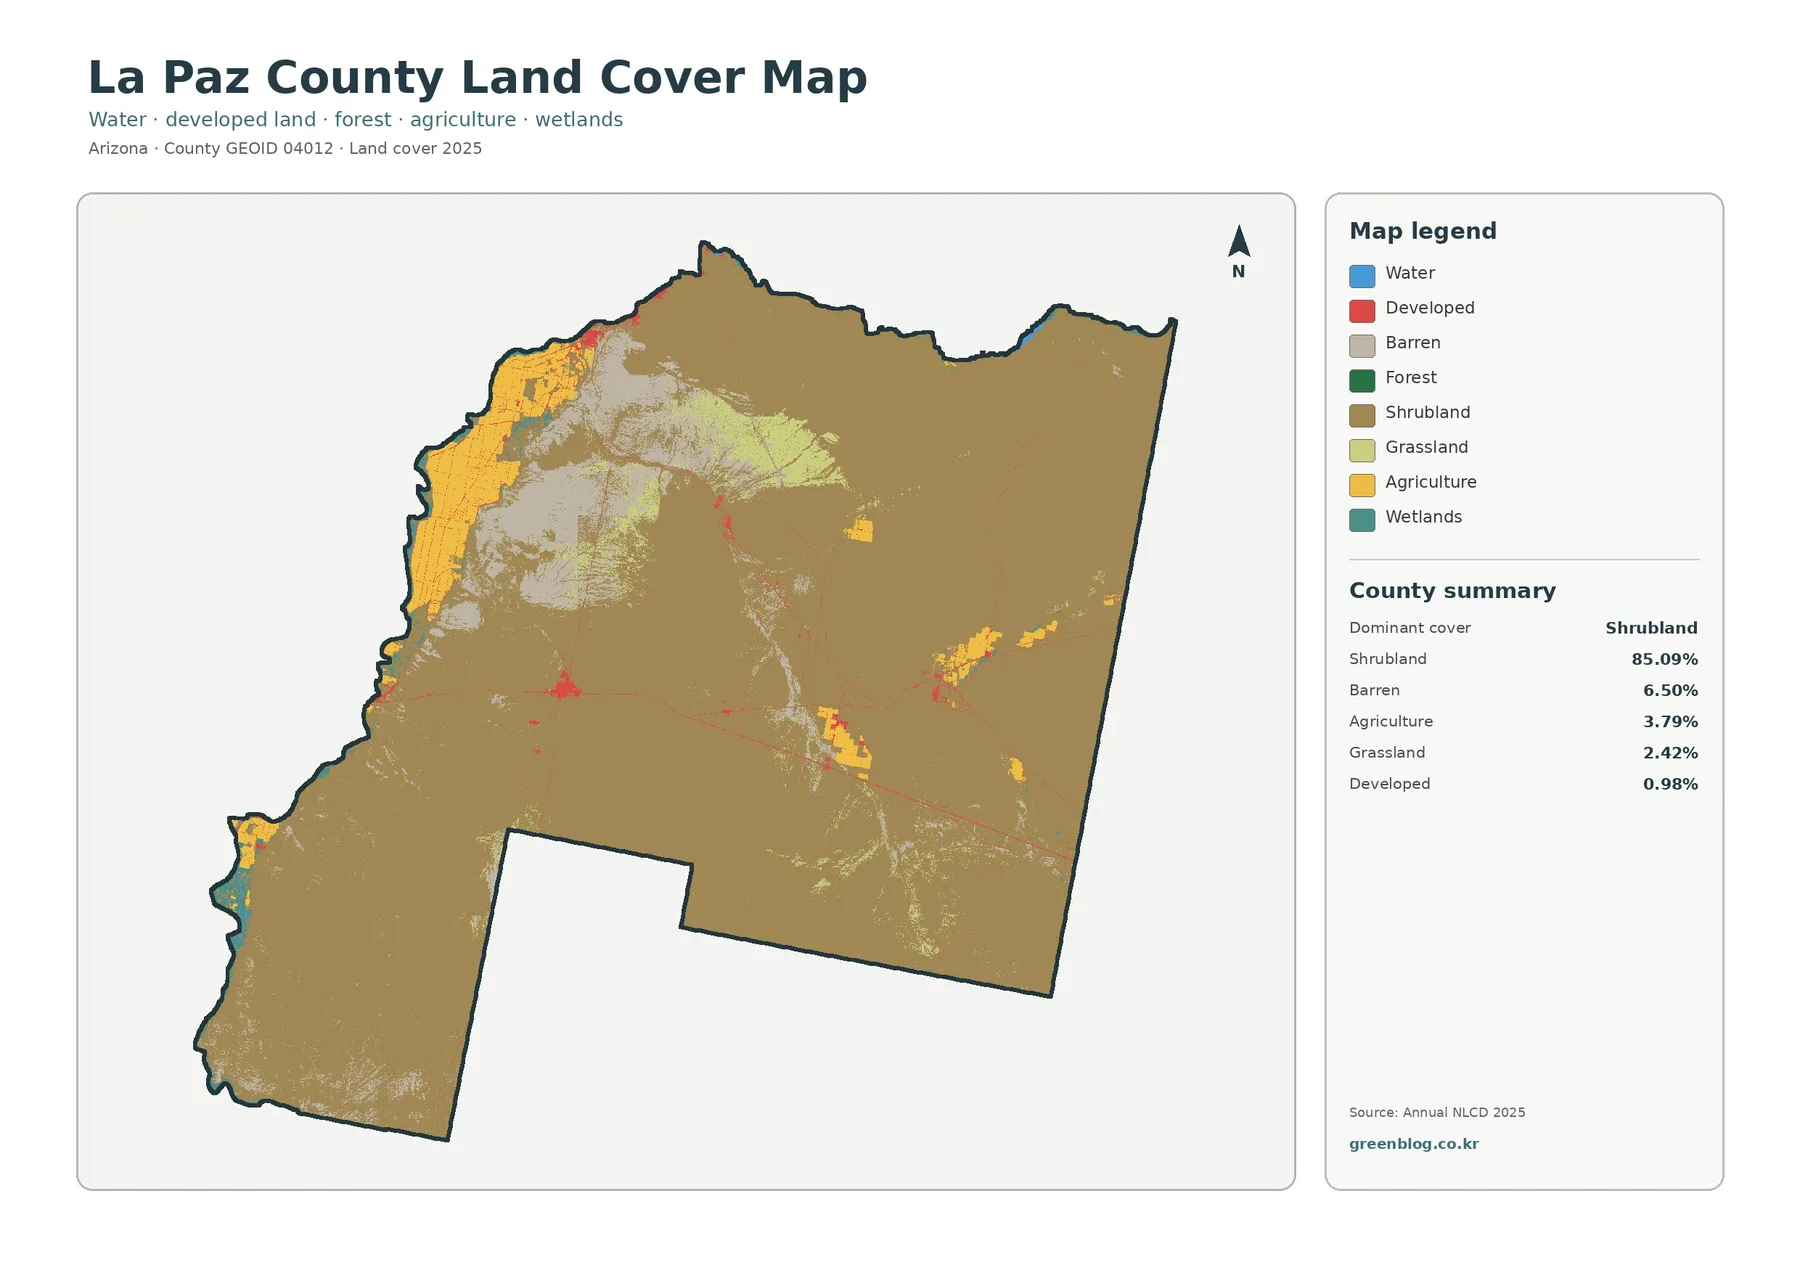
Across the eastern and southern parts of the county, the general land-cover view is dominated by shrubland. Brown covers most of the county interior, but the northwest is more varied. Gray barren areas, yellow agriculture, small developed patches, and water along the western boundary create a much more complex landscape than the 85.09% shrubland figure alone suggests.
Barren land is the second-largest mapped class at 6.50%. The broadest gray areas appear in the northwest interior and west-central part of the county, with smaller patches scattered elsewhere. Barren classification indicates surfaces where exposed soil, rock, or similarly open ground is more prominent than vegetation. It does not by itself identify a mine, recreation area, construction site, or geologic unit.
Grassland contributes 2.42% and developed cover 0.98%. Both are small at county scale, yet compact patches are easy to locate on the map. This is an important reading habit for desert counties: percentage tells how much area a class occupies, while the map shows whether that class is concentrated in a few places or spread across the landscape.
Land cover is not zoning or ownership. Shrubland can occur on federal, tribal, state, county, or private land, and a developed cell does not reveal what construction is legally permitted there. The county’s Planning and Zoning Commission handles rezoning, zoning ordinances, and comprehensive-plan matters, which are separate from the surface classification shown here.
Most of the 7.43% class difference is not mapped as new development
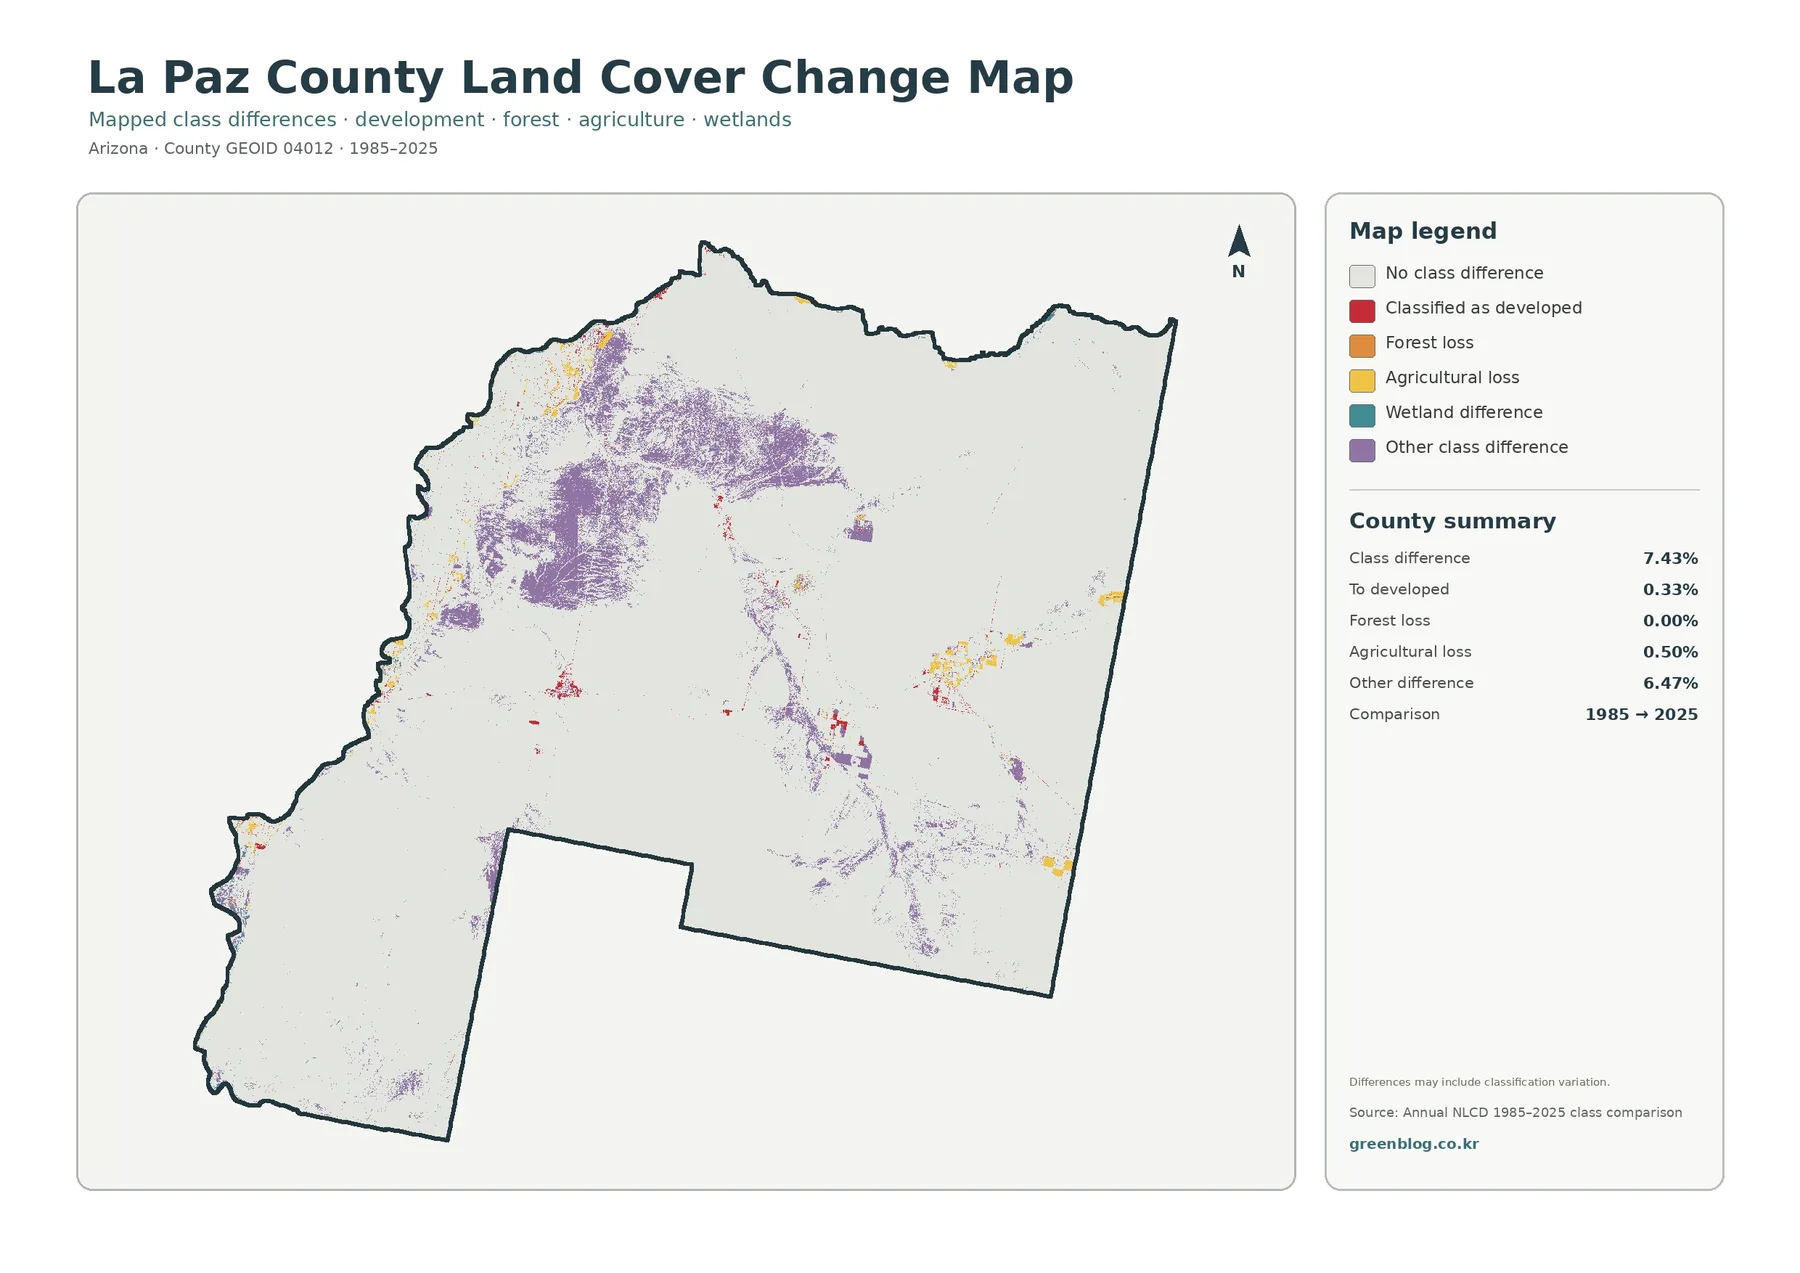
For the 1985–2025 comparison, total class difference is separated from specific change categories. The 7.43% total counts raster cells whose land-cover class differs between the 1985 and 2025 layers. Transition to developed is only 0.33%, agricultural loss is 0.50%, forest loss is 0.00%, and other class difference accounts for 6.47%.
Purple other-class difference is especially extensive in the northwest interior, where the 2025 map also contains large barren and shrub areas. Yellow agricultural-loss marks appear along parts of the western agricultural belt and around several smaller inland farm patches. Red developed-transition marks are localized near existing developed areas. These separate patterns do not support treating every changed cell as the result of one process.
The 6.47% other-difference category can include changes among shrubland, barren ground, grassland, and other non-highlighted classes, as well as normal classification variation around boundaries. The comparison also notes that some differences may reflect classification variation. A large purple area therefore needs follow-up imagery or another dataset before it is assigned a specific environmental or land-use cause.
Agricultural loss at 0.50% is also a map-class statistic rather than an economic measure. It means cells classified as agriculture in the older comparison were assigned another class in 2025. It does not measure farm revenue, crop production, irrigation use, or the number of farms.
Parker, Quartzsite, and the Colorado River help orient the map without becoming land-cover classes
Official county information lists Parker and Quartzsite as the main population and business centers and includes the Colorado River Indian Tribes among its communities. Its visitor information also describes the Parker Strip as a major water-recreation area along the Colorado River. These names give readers useful geographic reference points for understanding why the western edge contains more agriculture, water, and development than most of the desert interior.
Those place names are useful for orientation, but the relationship still needs careful interpretation. The raster maps do not label town boundaries, reservation boundaries, parcel lines, or road names. They show where surface classes and impervious cover are concentrated. Local place names help a reader understand the county, but exact jurisdiction and land ownership must come from separate official maps.
Planning questions require the same separation of source types. La Paz County’s Planning and Zoning Commission deals with rezoning applications, zoning ordinances, master plans, and comprehensive plans. Those legal and planning records answer different questions from a land-cover map. Use the NLCD-based maps to understand the visible ground surface, and use planning documents for what a parcel may legally be used for.
Use the four views for different questions rather than reading them as duplicates
- Overall distribution: use the general map to compare the 85.09% shrubland majority with barren, agricultural, and developed patches.
- River agriculture: use the forest-and-farmland view to focus on the Colorado River agricultural belt, wetlands, and water.
- Built surfaces: use the impervious map to locate the limited clusters where pavement and rooftops are concentrated.
- Time comparison: use the change map to distinguish total class difference, agricultural loss, other difference, and transition to developed.
A useful classroom sequence starts with the general map, then moves to the simplified agriculture view so students can see why the western edge differs from the interior. The impervious map can then show how small the built footprint is, and the change map can finish the discussion by separating long-term classification change from development.
For presentation work, larger maps are more useful than four tiny panels. A river-and-farming topic may need only the forest-and-farmland map plus the general map. A settlement topic may work best with the impervious map and a short reference to Parker or Quartzsite. Select the map that answers the question and keep the legend large enough to read.
Raster classification simplifies narrow canals, fields, roads, and mixed desert surfaces
Annual NLCD products classify the landscape in raster cells, roughly 30 meters across for the land-cover product used here. One cell can contain farm ground, canal edge, road, shrub vegetation, and bare soil but still receive a single class. Narrow water features, small fields, and mixed developed sites can therefore be simplified in a county-scale map.
Because the classification is tied to 2025, later construction, farming changes, and vegetation changes are not included. The 1985–2025 comparison can also contain classification variation around mixed or transitional desert surfaces. A changed pixel is a reason to investigate further, not final proof of a specific event.
Download the four La Paz County land-cover JPG maps
Frequently Asked Questions
Does the 3.79% agriculture share measure the county’s agricultural economy?
No. It is the share of mapped area classified as agriculture in the 2025 land-cover product. Farm revenue, employment, irrigation use, and crop production are separate statistics.
Does the 7.43% class difference mean 7.43% of the county became developed?
No. The 7.43% figure includes every cell assigned to a different class in the 1985 and 2025 comparison. Transition to developed is a separate 0.33% category.
What files are included in the download?
The archive contains four 2480 × 1754 JPG files: general land cover, forest and farmland, impervious surface/developed land, and 1985–2025 land-cover change.
Map File Information
La Paz County Land-Cover Map Files
- Included Files: Use only the versions confirmed in the article and supplied images
- File Type: Use the confirmed download contents
- Intended Use: Printing, education, presentations, and map-based projects
Related Maps
- Apache County Arizona Land Cover Map
- Cochise County Arizona Land Cover Map
- Coconino County Arizona Land Cover Map
Sources and reference links
- MRLC Annual NLCD Data — land-cover and impervious-surface data access
- USGS Annual NLCD Land Cover Classification — land-cover class information
- U.S. Census Bureau TIGER/Line Shapefiles — county boundary reference
- La Paz County About Us — Parker, Quartzsite, the Colorado River, agriculture, and visitor context
- La Paz County Planning & Zoning Commission — zoning and comprehensive-plan responsibilities
Green Map creates custom-edited map images using open geographic data sources such as geoBoundaries, Natural Earth, OpenStreetMap, and government open data.
These maps are edited visual materials, not raw data files, and are provided for education, documents, presentations, and graphic reference.