The Maricopa County Arizona Land Cover Map set makes one contrast immediately visible: a very large urban footprint occupies the middle and eastern part of a county that is still mostly desert shrubland. The 2025 summary lists shrubland at 74.33% and developed land at 14.43%. Agriculture, grassland, barren ground, water, and wetlands form smaller but locally important patterns around the county.
Four views are included: general land cover, forest and farmland, impervious surface/developed land, and 1985–2025 land-cover change. The four original 2480 × 1754 JPG files are available together in one download near the end of the page. They are useful for classroom work, presentation graphics, county comparison, and broad environmental reference.
Table of Contents
The impervious map shows why the county’s urban footprint cannot be treated as a small local patch
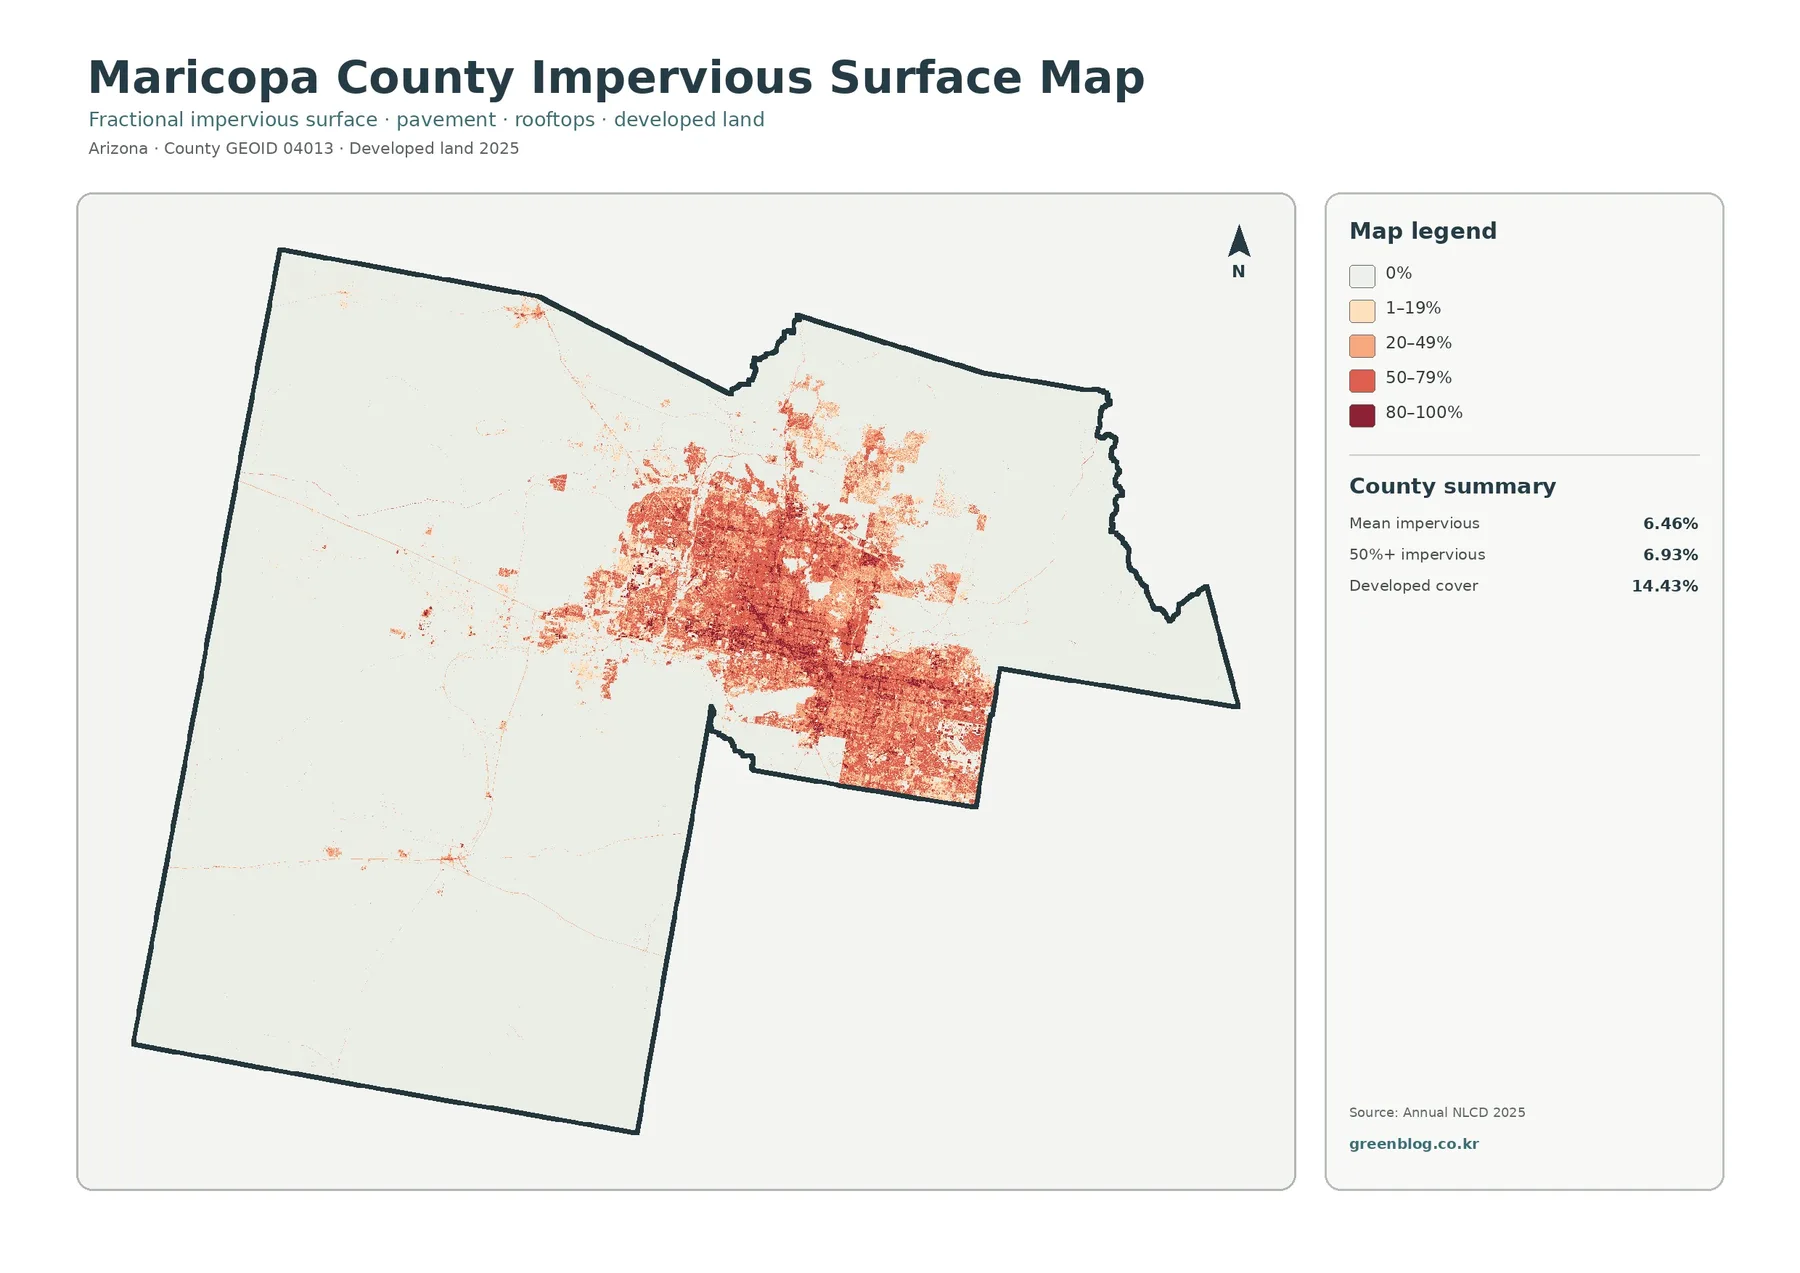
Hard surfaces cover a visibly broad part of Maricopa County. The map’s oranges and reds spread across the central urban area and continue eastward and southeastward rather than appearing as a handful of isolated spots. A countywide mean imperviousness of 6.46% is therefore consistent with the image: most desert land remains lightly covered, but a large urbanized zone contains roads, rooftops, parking areas, and other surfaces that limit infiltration.
Cells at 50% or greater imperviousness account for 6.93% of the county. That statistic is narrower than the 14.43% developed land-cover share because a developed raster cell can still contain soil, landscaping, trees, or other permeable ground. Imperviousness measures hard surface more directly. The two values answer related but different questions and should not be combined into one development percentage.
Official county Quick Facts identifies Phoenix as the county seat and Arizona’s state capital. The raster map does not draw municipal boundaries, but that place reference helps orient the large central developed area. Built cover extends well beyond a single city boundary, so the safest description is a broad central and eastern urban area rather than an exact outline of Phoenix.
At parcel scale, this map is too generalized for engineering or site design. The underlying product uses raster cells of roughly 30 meters, so one cell may contain a house, road, tree canopy, yard, and bare soil while receiving a single class and impervious estimate. Detailed pavement or drainage questions require finer imagery and local records.
Shrubland still covers nearly three quarters of the county around that urban core
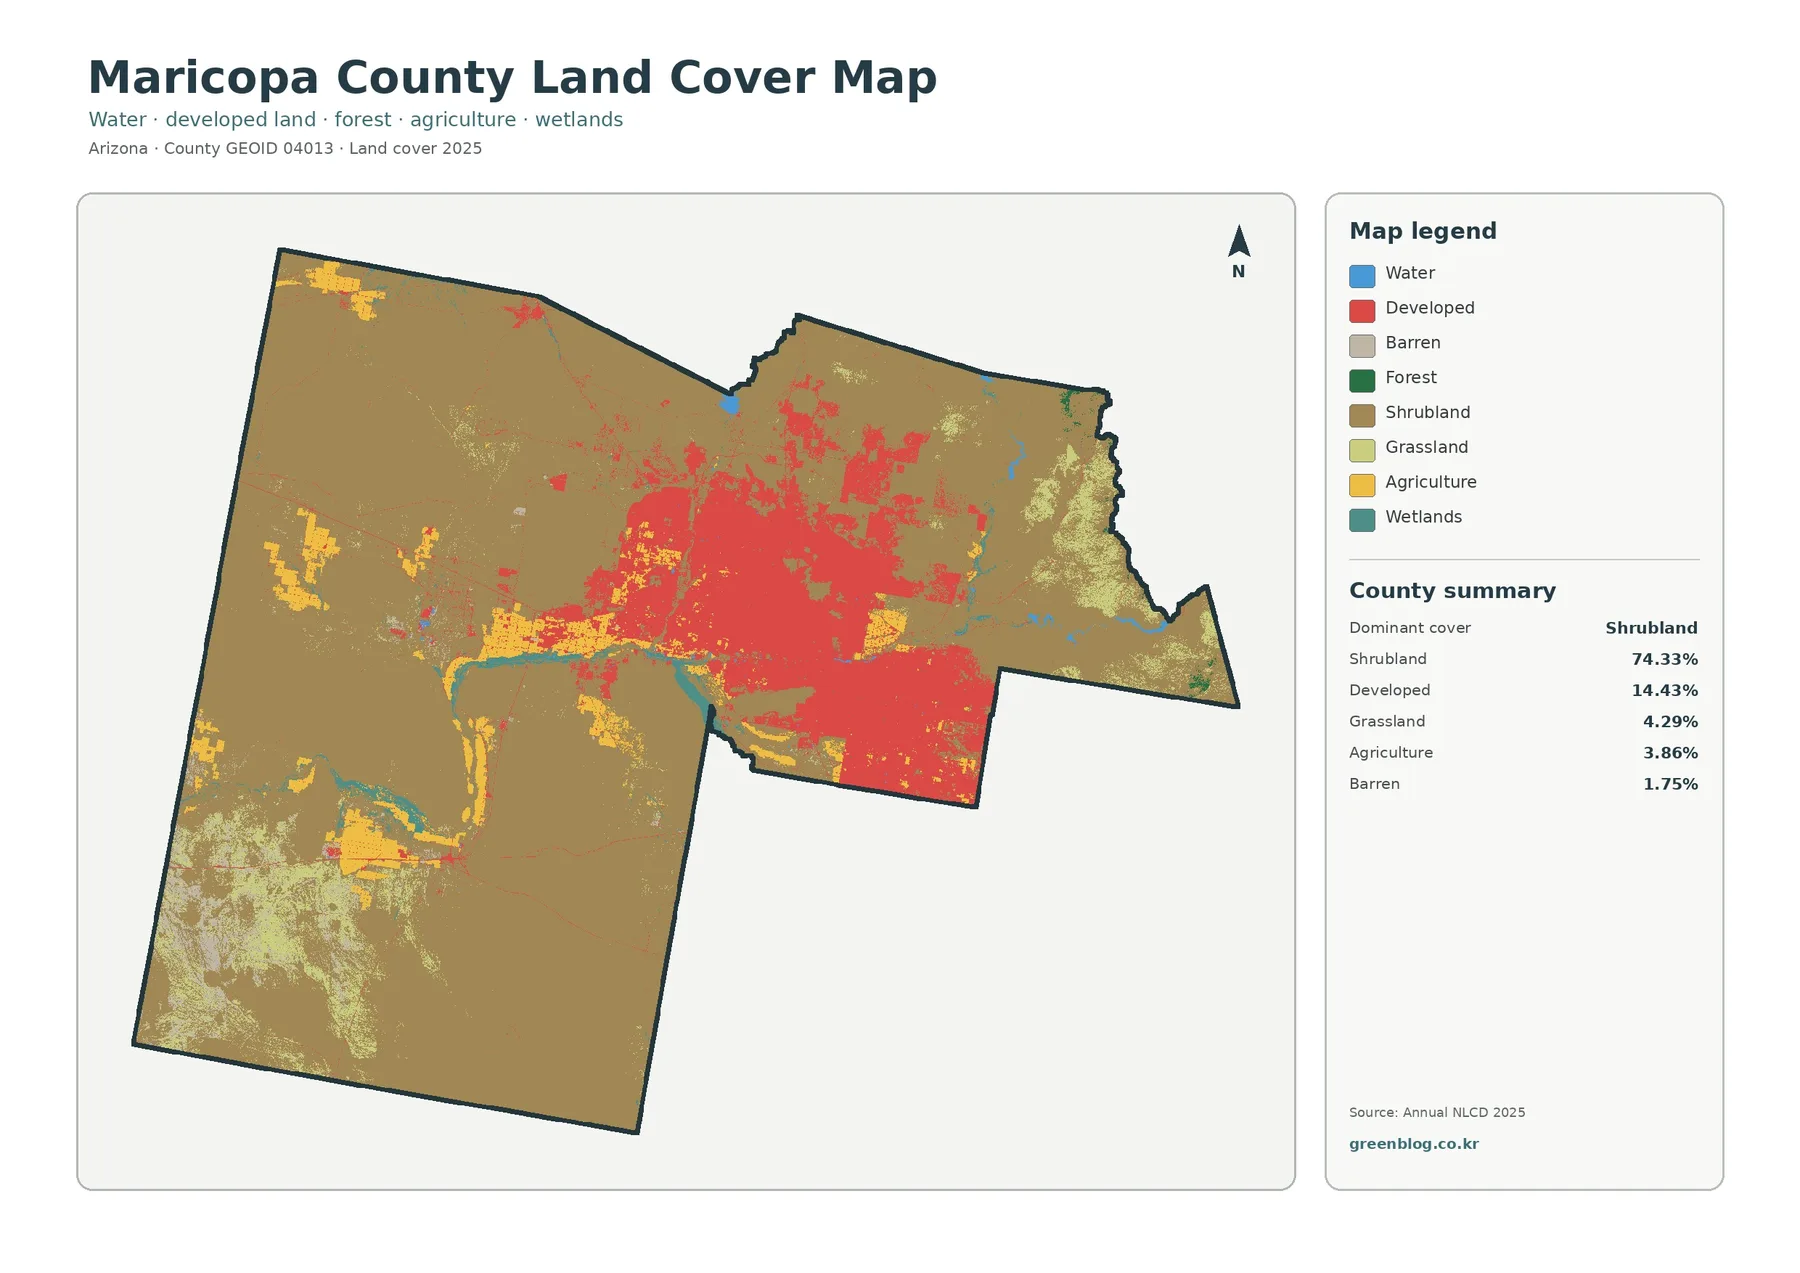
Brown shrubland dominates the western, southwestern, and northern portions of the county and surrounds the large central developed zone. This 74.33% majority explains why Maricopa County can contain a major metropolitan landscape while still remaining mostly open desert by area. The map also shows that shrubland is not the only cover beyond the urban area; agricultural, grass, barren, wetland, and water classes interrupt it in several directions.
Developed cover is the second-largest category at 14.43%, an unusually prominent share for the Arizona county maps in this series. Grassland follows at 4.29%, agriculture at 3.86%, and barren land at 1.75%. Agriculture is particularly easy to identify in western and southwestern blocks, while lighter grassland patches occur more often toward the eastern and southwestern margins.
County parks provide useful geographic context for the open land outside the urbanized area. Maricopa County Parks & Recreation emphasizes Sonoran Desert landscapes and natural open space across its regional park system. Those park boundaries are not shown by the land-cover colors, but the official park network helps explain why large desert areas remain important for recreation and environmental education even though the land-cover map is not a management map.
Land cover should not be read as zoning, ownership, or development permission. A shrubland cell can fall on federal, tribal, state, county, or private land, and a developed cell does not reveal whether the property is residential, commercial, industrial, or something else. The map describes the visible ground surface, not the legal status of a parcel.
Western agricultural blocks and northern water features interrupt the desert pattern
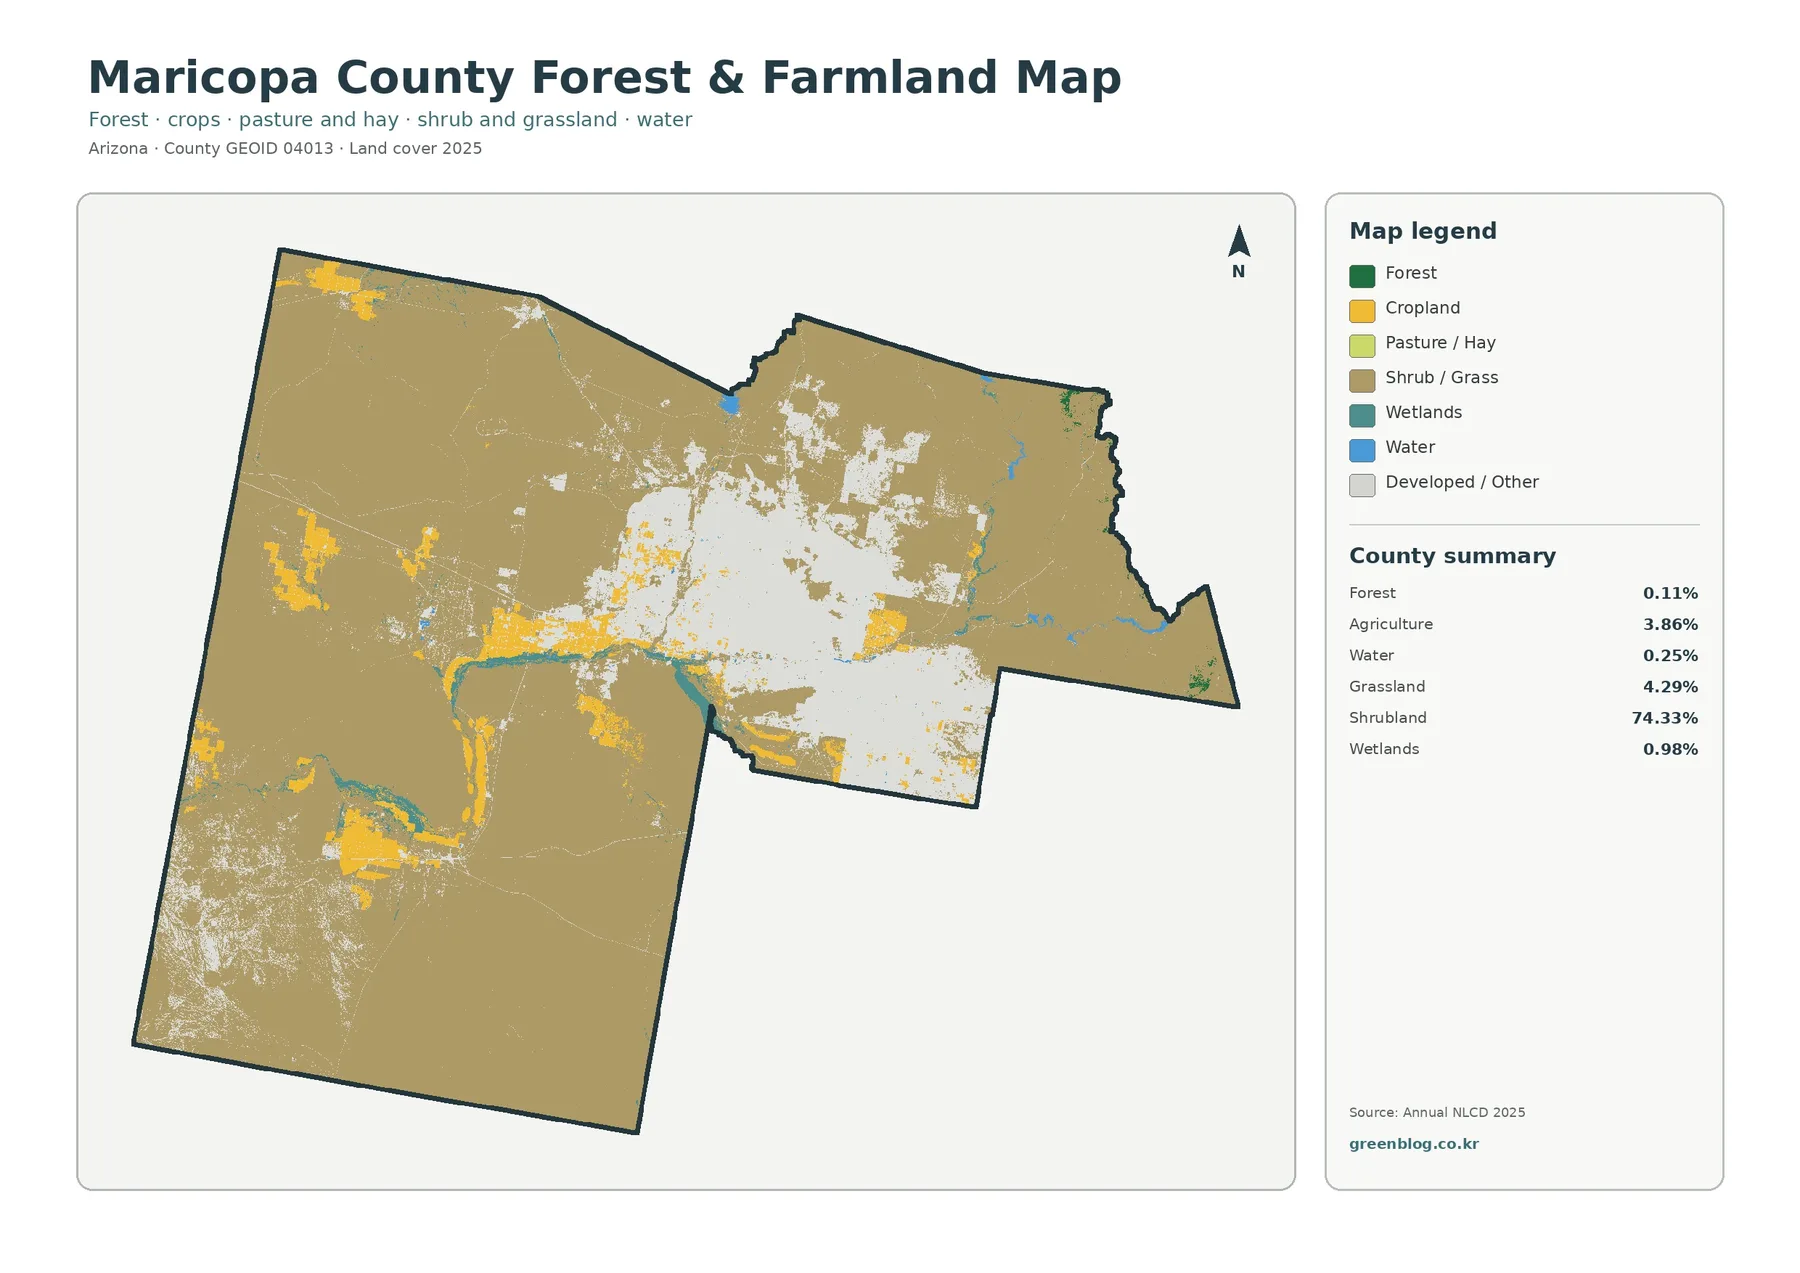
Removing the developed classes from the foreground makes agriculture easier to locate. Yellow agricultural blocks occur west and southwest of the central urban area and in several smaller patches elsewhere. They occupy only 3.86% of the county, but their clustering means they are far more obvious locally than the countywide percentage might suggest.
County Quick Facts notes that Maricopa County’s early economy drew on Arizona’s traditional “Five C’s,” including citrus and cotton. That historical reference does not tell us what is grown in the 2025 agricultural pixels, and the map should not be used as a crop inventory. It does show that agriculture remains a visible part of the county’s surface pattern even within a county best known today for a large urban population.
Water is only 0.25% of the mapped area and wetlands 0.98%. Even so, a large northern water feature is visually distinct from the surrounding desert. Maricopa County Parks & Recreation describes Lake Pleasant as a major reservoir and recreation area in the northwest Valley, part of the Central Arizona Project system. That official context helps explain why a small water percentage can still correspond to an important regional resource.
Forest is only 0.11%, so the green forest class is nearly absent at county scale. Grassland at 4.29% is much more visible, particularly toward the east and parts of the southwest. A simplified map like this is useful when the goal is to compare open desert, farms, water, and minor vegetation classes without the large developed area dominating the legend.
The 1985–2025 comparison separates a 7.83% transition to developed from other class change
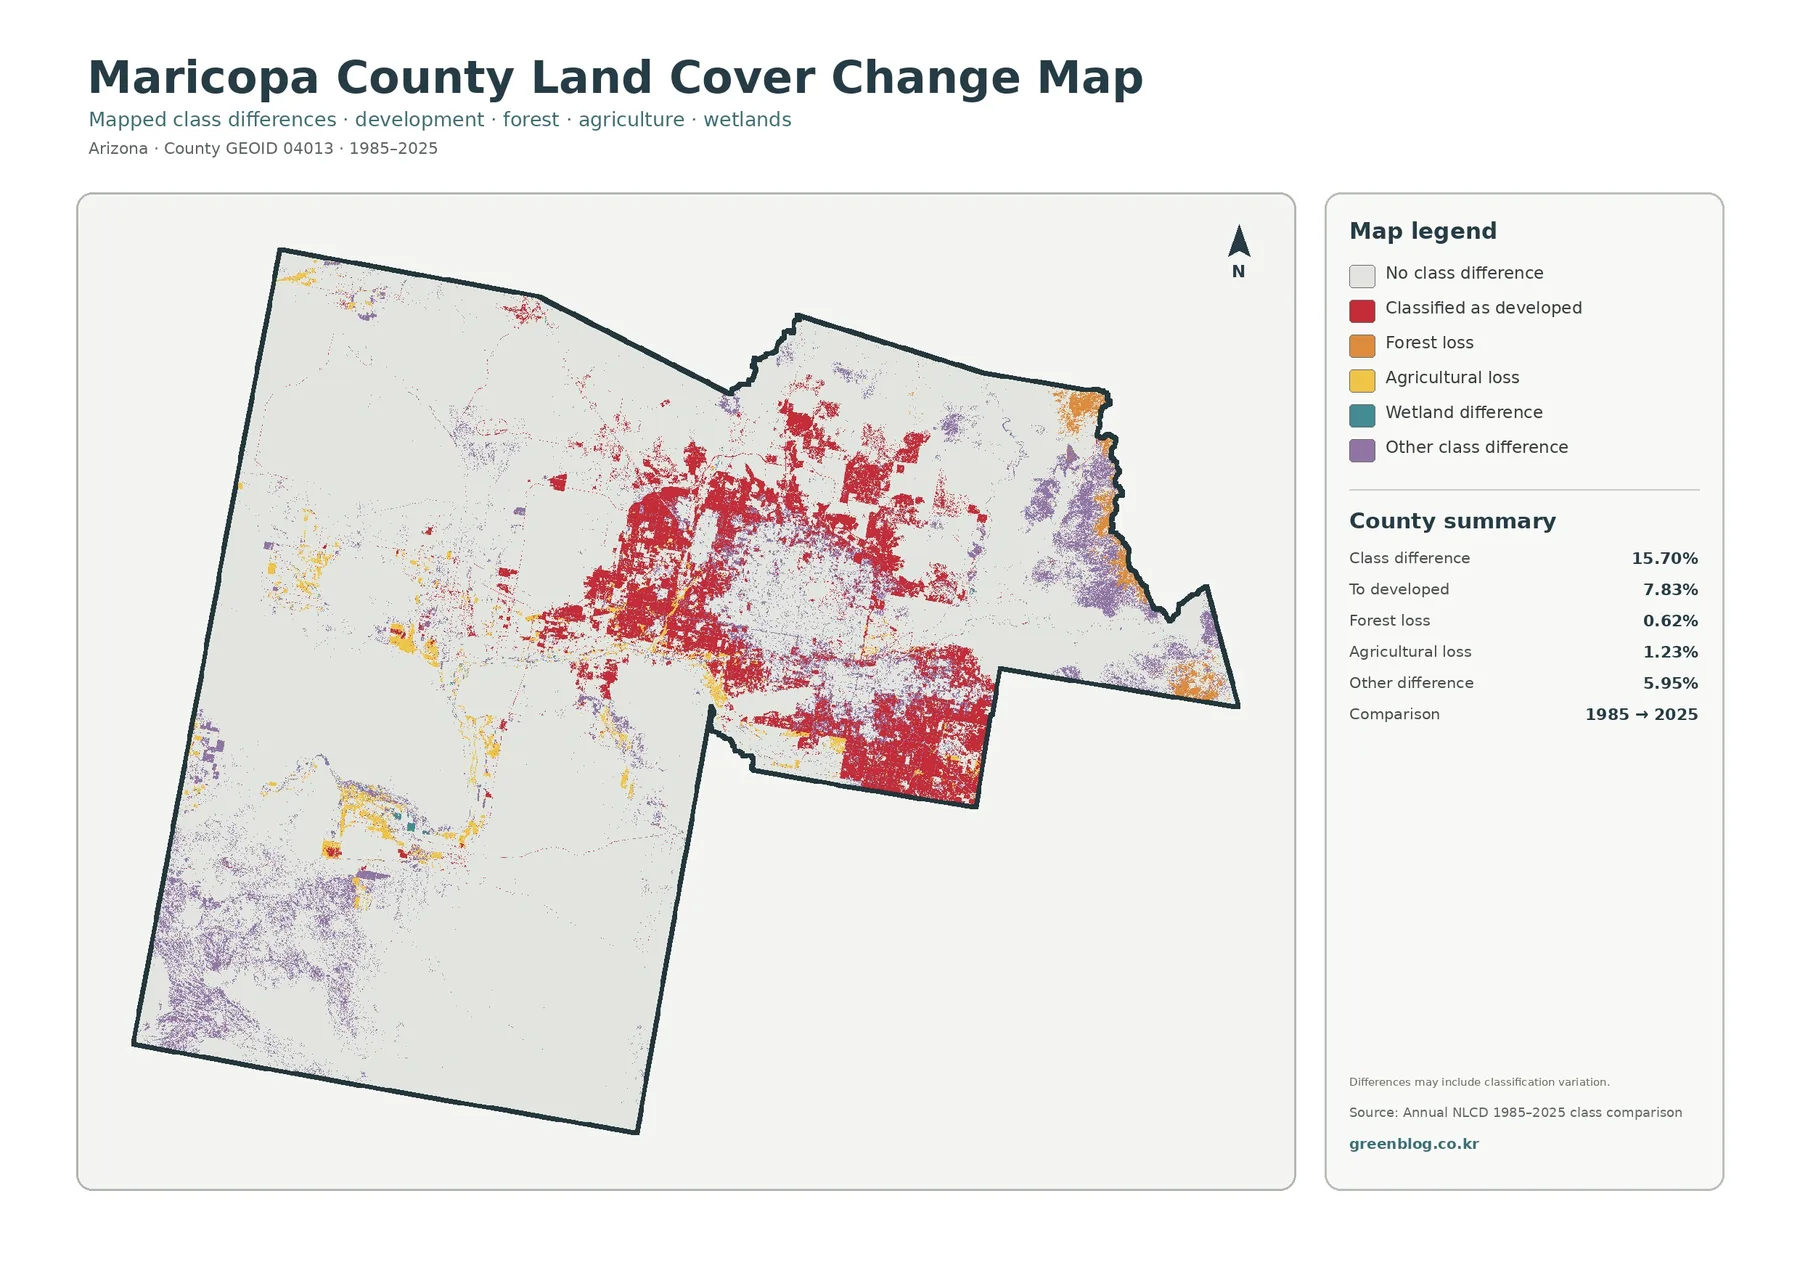
Total class difference is 15.70%, but that number is not a development rate. It counts every raster cell assigned to a different land-cover class in the 1985 and 2025 comparison. The specific transition-to-developed category is 7.83%, while agricultural loss is 1.23%, forest loss is 0.62%, and other class difference is 5.95%.
Red developed-transition cells form a broad band around the current central urban area and extend in several directions beyond it. The pattern is much more extensive than in the rural Arizona counties already covered in this series. It is useful to compare this map with the impervious view: one shows where classification changed toward developed cover, while the other shows the current concentration of hard surfaces.
Yellow agricultural-loss marks occur around several western agricultural areas, and orange forest-loss cells appear in smaller eastern patches. Purple other-class differences are substantial in the east and southwest. Those colors may represent changes among shrub, grass, barren, wetland, or other classes as well as normal classification variation, so they should not be assigned one cause without additional evidence.
The comparison itself warns that classification variation may be included. Historical imagery, more recent aerial photography, planning records, and project-specific information are the better sources for explaining why a particular place changed. The change map is strongest as a way to locate areas worth investigating, not as proof of a specific cause.
Planning records answer legal land-use questions that a land-cover map cannot
Maricopa County Planning & Development is responsible for land-use planning, zoning, subdivision, and construction permitting in its jurisdiction. Those responsibilities are separate from the Annual NLCD classification used on this page. A red developed cell identifies a surface pattern; it does not say what zoning district applies, whether a permit has been issued, or what future development is allowed.
Agricultural status also illustrates the difference between surface cover and administrative classification. The Maricopa County Assessor explains that agricultural classification is a statutory property-valuation category with its own eligibility rules. A yellow agricultural raster cell is therefore not automatically the same thing as a parcel that qualifies for agricultural tax classification.
Keeping these source types separate makes the maps more useful. NLCD-based images answer questions about what covers the ground. County planning pages answer questions about zoning and permits. Assessor records answer property-classification questions. Parks information provides place context for reservoirs and Sonoran Desert open spaces.
Each map works best when it is tied to one clear question
- Urban versus desert: use the general land-cover map to compare 14.43% developed cover with the 74.33% shrubland majority.
- Hard-surface concentration: use the impervious map to show where pavement and rooftops are most concentrated inside the urbanized area.
- Farms and water: use the forest-and-farmland map to focus on western agricultural blocks, wetlands, water, grassland, and the small forest share.
- Long-term comparison: use the change map to separate transition to developed from agricultural loss and other class differences.
For a classroom sequence, starting with the impervious map can quickly establish the scale of the urban area. The general map can then show how that built landscape sits inside a much larger desert county. A third step can focus on western agriculture and northern water, followed by the change map to discuss how current patterns differ from the 1985 classification.
Presentation slides are easier to read when one or two maps are shown large rather than all four being reduced to small panels. An urban-development topic may only need the impervious and change views. An agriculture-and-desert topic may work better with the general map and the simplified farm-and-water view.
Raster size and observation date matter in a county with fast-changing urban edges
Annual NLCD products classify land in raster cells, roughly 30 meters across for the land-cover data used here. A cell can include a street, building, yard, canal edge, or farm field while still receiving one dominant class. Narrow roads, small irrigation features, landscaping, and mixed urban lots are therefore simplified at county scale.
The maps represent the 2025 classification and cannot show construction or land-cover change that happened later. Fast-changing edges around developed areas are especially important to verify with current aerial imagery when a recent condition matters. Small differences in the 1985–2025 comparison can also come from classification variation, so changed pixels should be treated as screening information rather than a parcel history.
Download the four Maricopa County land-cover JPG maps
Frequently Asked Questions
Why is developed cover 14.43% while mean imperviousness is 6.46%?
Developed land cover includes mixed urban cells that can contain buildings and roads together with soil, trees, or landscaping. Imperviousness measures the hard-surface share more directly, so the values are expected to differ.
Does the 15.70% class difference mean 15.70% of the county became developed?
No. The 15.70% total includes every cell assigned to a different class in the 1985 and 2025 comparison. Transition to developed is a separate 7.83% category.
What files are included in the download?
The archive contains four 2480 × 1754 JPG files: general land cover, forest and farmland, impervious surface/developed land, and 1985–2025 land-cover change.
Map File Information
Maricopa County Land-Cover Map Files
- Included Files: Use only the versions confirmed in the article and supplied images
- File Type: Use the confirmed download contents
- Intended Use: Printing, education, presentations, and map-based projects
Related Maps
- Apache County Arizona Land Cover Map
- Cochise County Arizona Land Cover Map
- Coconino County Arizona Land Cover Map
Sources and reference links
- MRLC Annual NLCD Data — land-cover and impervious-surface data access
- USGS Annual NLCD Land Cover Classification — land-cover class information
- U.S. Census Bureau TIGER/Line Shapefiles — county boundary reference
- Maricopa County Quick Facts — Phoenix and county historical context
- Lake Pleasant Regional Park — reservoir and Sonoran Desert recreation context
- Maricopa County Planning & Development — zoning, land-use planning, subdivision, and permitting context
Green Map creates custom-edited map images using open geographic data sources such as geoBoundaries, Natural Earth, OpenStreetMap, and government open data.
These maps are edited visual materials, not raw data files, and are provided for education, documents, presentations, and graphic reference.