Catawba County sits in the western part of North Carolina in the foothills of the Blue Ridge Mountains. On the maps in this package, the county is easiest to understand by using several different anchors rather than treating the county seat as the only center. Hickory stands out in the northwest as the largest city, Newton lies closer to the middle as the county seat, Conover sits between those urban areas, and the eastern edge is shaped by the Catawba River and its reservoir shoreline. This page explains those relationships with the supplied county, city, and terrain-and-water maps, and the larger A3 JPG versions can be downloaded from the map file box below.
A useful first pass is to find Hickory, Newton, and Conover, then trace the main road network around them. Interstate 40 and U.S. 70 provide strong east-west references across the northern urban area, while U.S. 321 and NC 127 help define the western side. NC 16 runs through the central part of the county, and NC 10, NC 18, and NC 150 are useful for the southern and southeastern areas. The eastern boundary looks very different from the west because it follows a broad, irregular water edge connected to the Catawba River system. Moving between the three maps makes it easier to see where settlement is concentrated, where the road network is densest, and how streams and reservoirs shape the county outside the urban core.
Table of Contents
Hickory, Newton, and the eastern water boundary give Catawba County its basic shape
The general county map makes the contrast between the northwest and the east immediately visible. Hickory occupies the northwestern part of the county, with St. Stephens just to the northeast and Long View and Brookford close by on the southwest side. Conover lies east of Hickory, while Newton is farther south and closer to the center of the county. That arrangement matters because Newton is the county seat, but the largest concentration of city labels and major roads is farther north around Hickory and Conover. A reader who starts only with Newton can miss the way the county’s urban activity stretches across more than one center.
East of that cluster, Claremont and the town of Catawba lead toward a much more irregular county edge. Catawba County government describes the county as being strongly influenced by the Catawba River and three major lakes: Lake Hickory, Lake Lookout Shoals, and Lake Norman. The county map specifically labels Lake Norman of Catawba in the southeast, where the shoreline creates a broad indentation along the boundary. The official county profile also notes that a large portion of the county is bordered by the Catawba River system. This explains why the eastern outline is not a simple straight county line and why water remains an important reference even on a map that is mainly focused on roads and places.
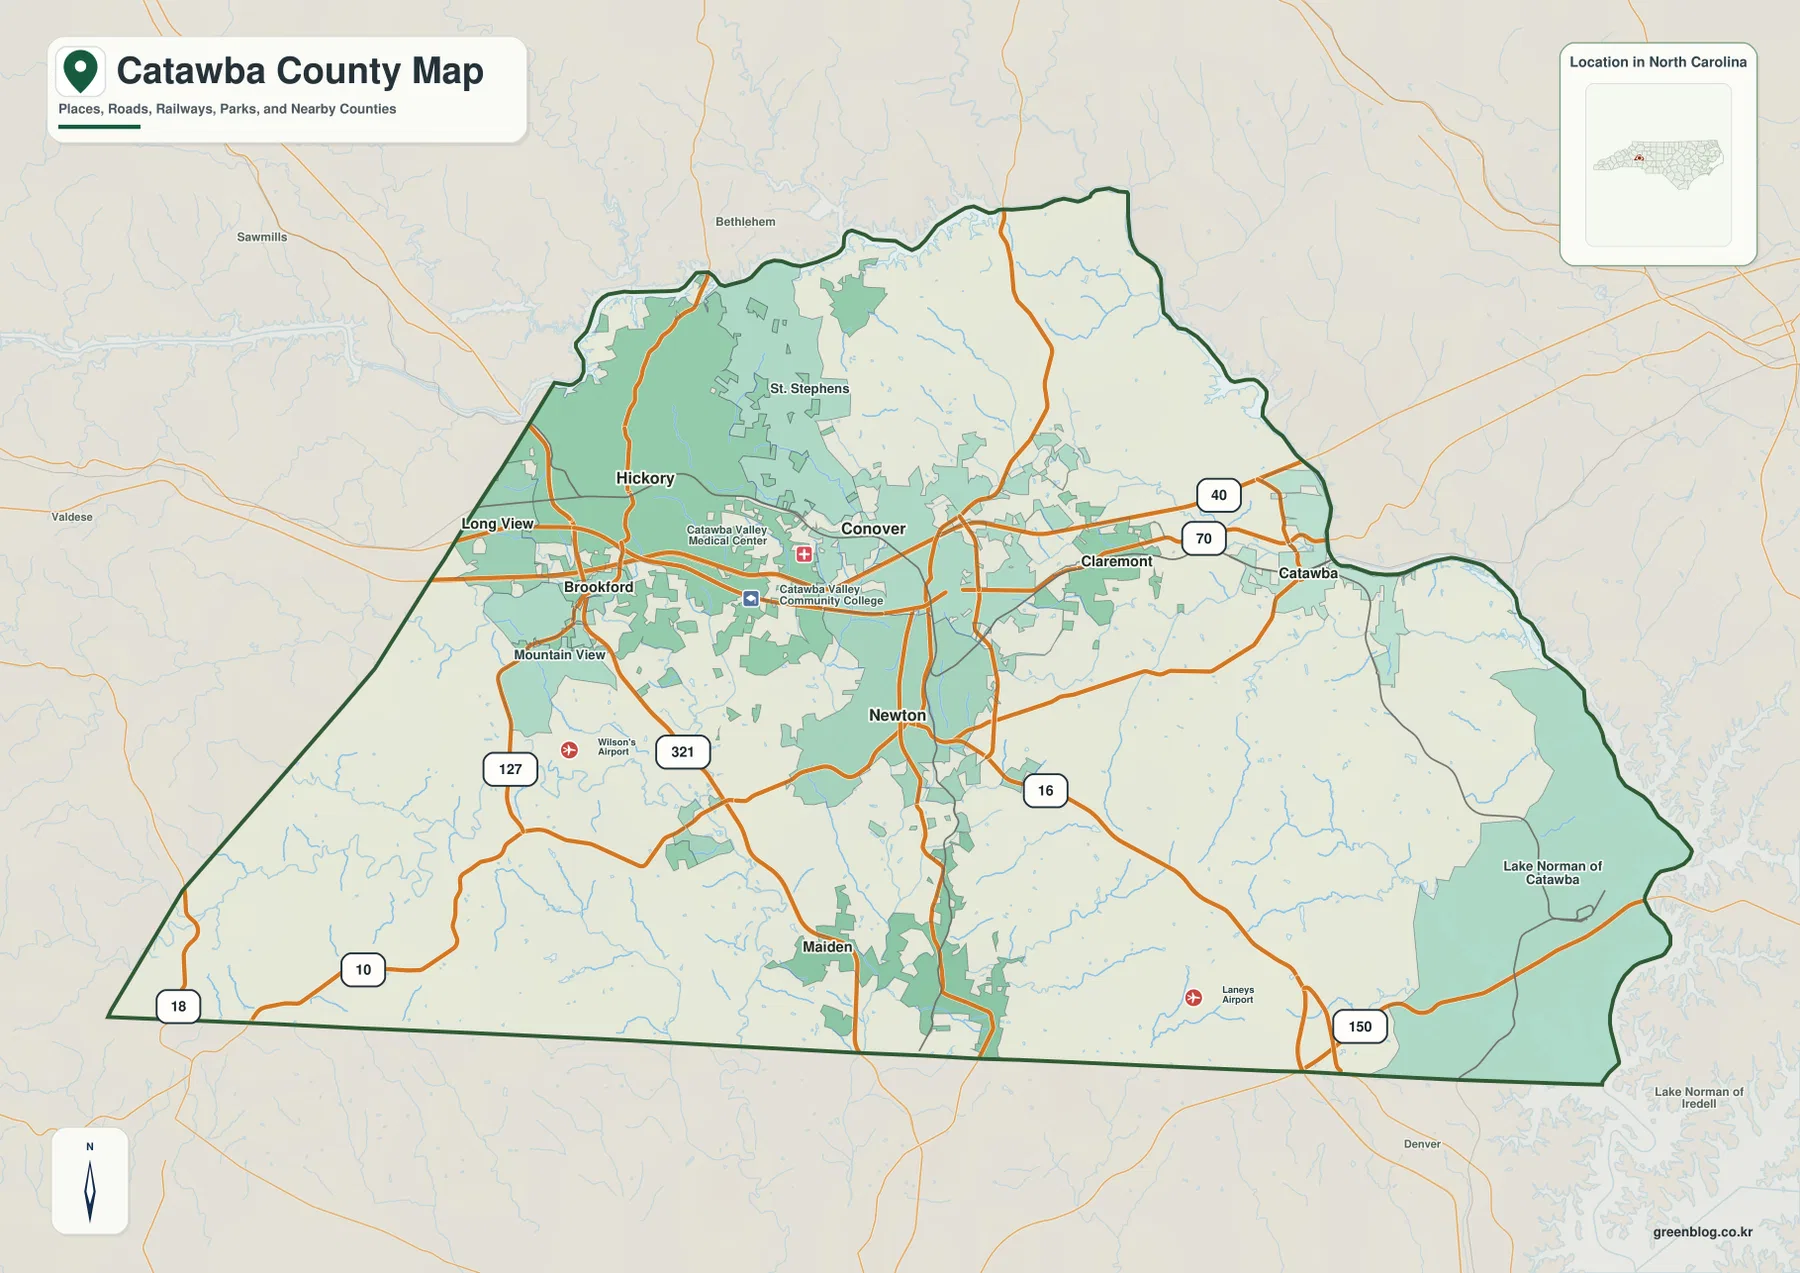
The road pattern gives another way to divide the county. I-40 crosses the northern half near Hickory and Conover, and U.S. 70 follows the same broad east-west urban belt. U.S. 321 is a major north-south reference near Hickory, while NC 127 runs farther west through the Long View and Mountain View side. NC 16 passes through the Newton area and continues south, making it useful for connecting the county seat to Maiden. NC 10 and NC 18 help orient the southwest, and NC 150 marks a route near the southeastern edge. These roads are not presented here as turn-by-turn navigation; they are most useful as large, stable reference lines for understanding where the communities sit within the county.
The map also shows how much denser the northwest appears compared with the southern and southeastern portions. Around Hickory, labels for Long View, Brookford, Mountain View, St. Stephens, medical facilities, and Catawba Valley Community College appear close together. South of Newton and east toward the lake boundary, the named places are farther apart and the blue stream network becomes more noticeable. That difference makes the general map especially useful for explaining why the county cannot be reduced to a single center: its northwest is more urban and road-dense, Newton provides the administrative reference near the middle, and the east is increasingly defined by water.
The city map separates the Hickory cluster from Newton and the southern towns
The simplified city map removes much of the road and facility detail and emphasizes six major places: Hickory, Newton, Conover, Long View, Maiden, and Claremont. Hickory is ranked first and appears in the northwest. Newton is second and sits noticeably farther south. Conover is third, positioned east of Hickory and north of Newton. The locations of those three cities form the clearest urban framework in the county, showing that the main population centers are concentrated across the northwestern and central portions rather than evenly distributed from border to border.
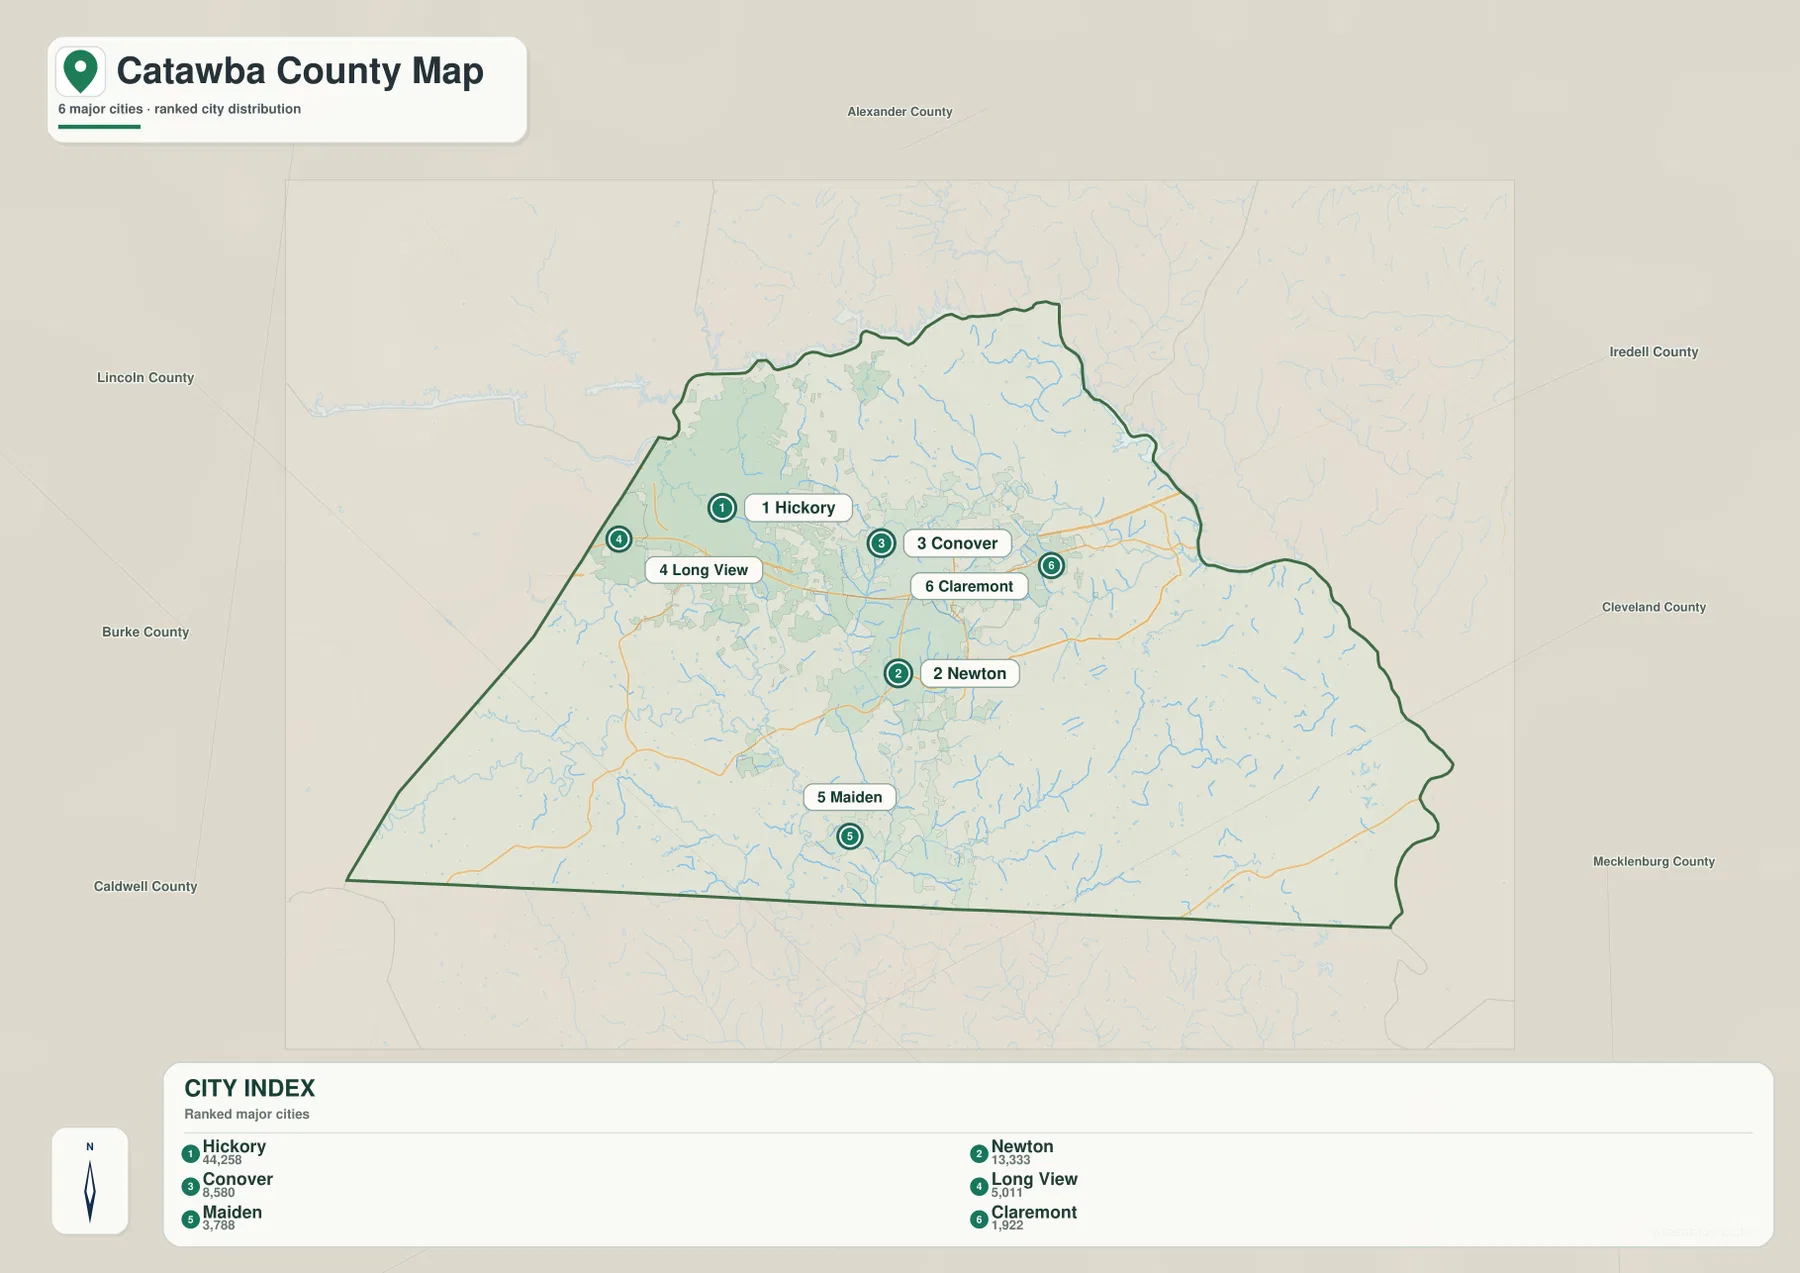
Long View is placed very close to Hickory on the southwest side, reinforcing how tightly the western urban area is grouped. Maiden is clearly separated to the south of Newton, making it a useful marker for the lower part of the county. Claremont lies east of Conover and helps connect the urban cluster to the eastern side. County names around the outside of the map provide additional orientation: Alexander County is to the north, Iredell County to the east, Lincoln County to the west and southwest, while Burke and Caldwell Counties help frame the western side. These labels are useful because they show which Catawba County communities are closest to particular neighboring county directions without requiring a more detailed regional map.
The numbered city ranking should not be read as a substitute for a current demographic table. Its main value is visual: it tells the reader which places the map is emphasizing and where they sit relative to one another. Hickory, Newton, and Conover are close enough to be compared as part of the county’s main urban network, but their roles are not identical. Newton is the government center, Hickory is the largest city on the map, and Conover occupies an important position between them and the I-40/U.S. 70 corridor. Maiden and Claremont then extend that picture south and east. This is much easier to see on the uncluttered city view than on a road map full of labels.
Reservoir shoreline, creeks, and shaded foothill terrain dominate the water map
The terrain-and-water map changes the emphasis completely. Highways and city labels are no longer the main visual cues. Instead, the eastern edge is occupied by a broad reservoir shoreline, and a dense network of smaller streams reaches across the interior. The shaded background also makes it clear that the county is not a flat plain. Catawba County’s official description places it in the foothills of the Blue Ridge Mountains, and the relief shown here is consistent with a landscape of low ridges, valleys, and rolling ground rather than one uniform surface.
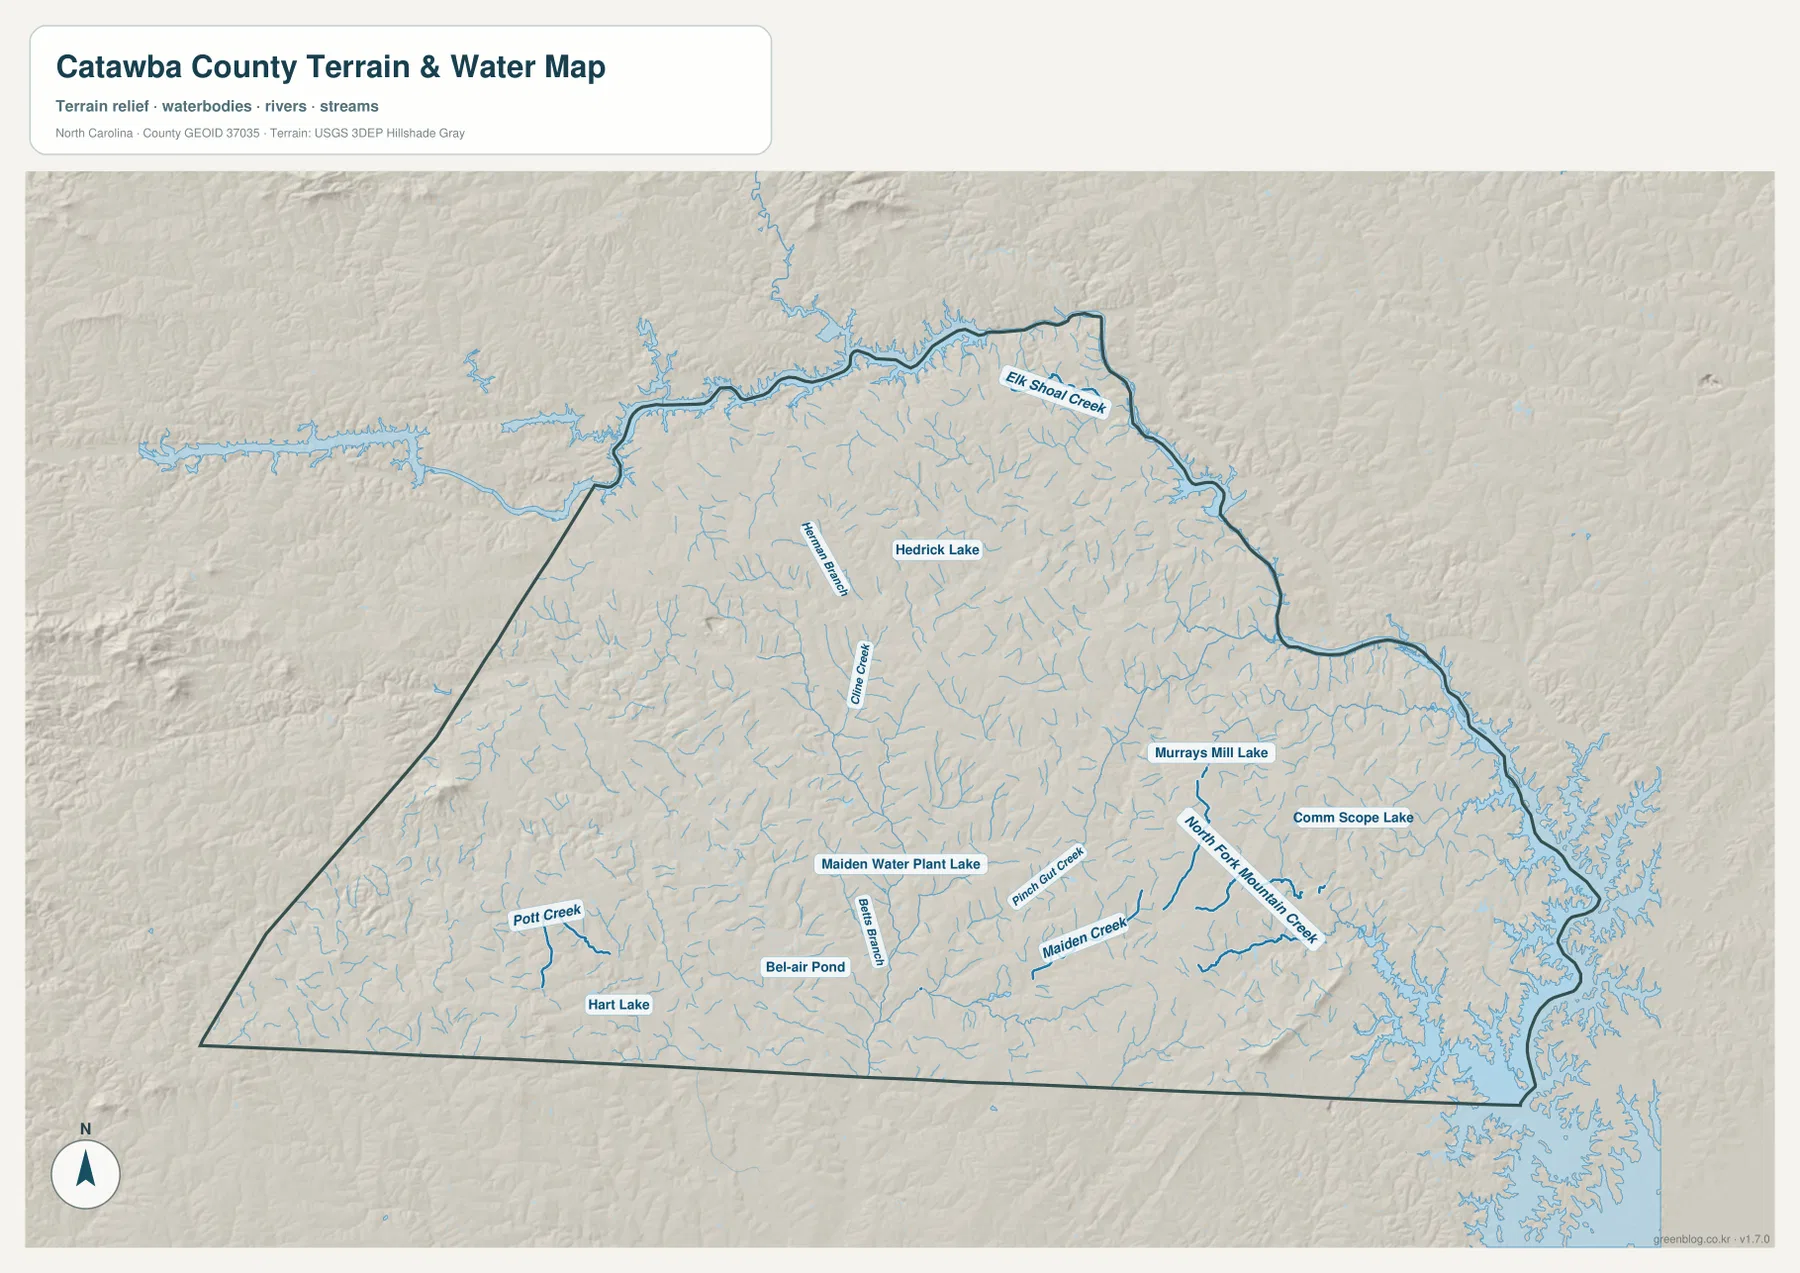
Several labels make the interior water network easier to follow. Elk Shoal Creek appears in the northeast. Herring Branch and Hedrick Lake are shown farther west and closer to the north-central area, while Gillis Creek runs through the interior. Murrays Mill Lake and Comm Scope Lake are labeled in the eastern half. Farther south, North Fork Mountain Creek, Pinch Gut Creek, and Maiden Creek provide strong references between the center and the large water body along the eastern side. Pott Creek and Hart Lake stand out in the southwest, and Maiden Water Plant Lake and Boggs Branch add detail near the southern middle of the county.
Those smaller names are valuable because much of southern and eastern Catawba County has fewer large city labels than the Hickory area. A creek or small lake can therefore be a better local reference than the nearest incorporated place. For example, Maiden Creek helps distinguish the country southeast of Newton and east of Maiden, while North Fork Mountain Creek provides another reference closer to the eastern reservoir system. In the northeast, Elk Shoal Creek helps identify the upper water network where the county boundary begins to curve sharply. The map is most useful when those streams are treated as location clues rather than as technical hydrologic measurements.
This water view is not a flood map, navigation chart, property map, or survey product. The shaded relief is also not a dedicated elevation layer with contour lines or precise spot heights. The county government reports an elevation range of roughly 705 to 1,780 feet for Catawba County, which helps explain why the relief appears uneven across the map, but exact elevation work should use an official elevation dataset. For ordinary map reading, the shaded surface is best used to see how streams occupy lower ground and how the eastern reservoirs sit within a rolling foothill landscape.
Cross-checking roads and water makes the county easier to navigate on paper
A good way to use the set is to start with the general county map and then switch views when the question changes. To explain the relationship between Hickory and Newton, begin with I-40, U.S. 70, U.S. 321, and NC 16 on the general map. Then use the city map to remove the extra labels and compare the positions of Hickory, Conover, and Newton directly. If the area of interest shifts east toward Catawba, Claremont, or the reservoir boundary, move to the water map to see how the streams and shoreline complicate the geography beyond the road network.
The same method works well in the south. Maiden is an obvious place marker on both the general and city maps, and NC 16 provides a north-south road reference back toward Newton. On the water map, Maiden Creek, Maiden Water Plant Lake, Boggs Branch, and nearby tributaries divide that broad southern area into smaller, more recognizable pieces. Instead of describing everything only as “south of Newton,” the maps let a reader distinguish the land around Maiden from the creek valleys leading toward the eastern water system.
In the northwest, Hickory and Long View are the easiest place references. The general map shows the concentration of roads and facilities around them, while the water map supplies the terrain and stream context that the city map intentionally leaves out. That difference is important when choosing a map for a project. A presentation about transportation or city locations benefits from the general or city view; a lesson about the county’s river-and-reservoir setting is clearer with the terrain-and-water map. None of the three needs to do every job.
Choose the file by the question you need the map to answer
Use the general county map when you need the county outline, named communities, highway numbers, and the eastern lake boundary in one view. The city map is better when the task is to compare Hickory, Newton, Conover, Long View, Maiden, and Claremont without a dense background. The terrain-and-water map is the strongest choice for the reservoir shoreline, creeks, smaller lakes, and the rolling relief. For school projects, county introductions, travel planning, presentations, or general reference, keeping all three files together makes it easy to switch from one type of question to another.
- General county map JPG: best for Hickory, Newton, Conover, major highways, county boundaries, and the eastern lake edge.
- City map JPG: best for a simplified comparison of Hickory, Newton, Conover, Long View, Maiden, and Claremont.
- Terrain and water map JPG: best for the reservoir shoreline, Elk Shoal Creek, Mountain Creek, Maiden Creek, smaller lakes, and shaded relief.
The archive is named catawba_county_north_carolina_3_map_jpg.zip, so both the county and state remain clear when the download is stored with other map files. The WebP images in the article are lighter previews for on-screen browsing, while the JPG files in the ZIP are the larger versions intended for closer viewing and layout work. Before printing at a large size, check the page size and scaling settings in the application you are using so the map is not unintentionally cropped or reduced.
Frequently Asked Questions
Why should a Catawba County map be read with both Hickory and Newton in mind?
Newton is the county seat, but Hickory is the largest city shown and anchors the denser northwestern urban area. Looking at both places prevents the county from being interpreted as if its administrative center and its largest city were the same location. Conover then helps connect those two references across the northern road network.
Why is the eastern Catawba County boundary much more irregular than the western side?
A large part of the eastern side follows the Catawba River and reservoir shoreline rather than a simple straight land boundary. Lake Norman of Catawba is labeled in the southeast on the general map, and the terrain-and-water view shows the broader branching water edge and many tributaries. That water-defined boundary creates the strong contrast with the simpler western outline.
Does the download include a separate Catawba County elevation map?
No. The package contains the general county map, city map, and terrain-and-water map only. The water map includes shaded relief that helps show rolling ground, but it does not provide a dedicated elevation layer with contour values or survey-grade heights. Use an official elevation dataset if precise elevation is required.
Sources and reference material
- Catawba County Government – About Catawba County – official county information on Newton, local municipalities, the Catawba River, major lakes, and the county’s foothill setting.
- North Carolina Department of Transportation – County & Bridge Maps – official county road mapping resources, including Catawba County.
- U.S. Census Bureau TIGER/Line Shapefiles – official geographic and county-boundary data.
- USGS National Hydrography – authoritative reference data for rivers, lakes, streams, and other surface-water features.
- USGS 3D Elevation Program – the appropriate official source when precise elevation or terrain measurements are needed.
Map File Information
The download ZIP contains three high-resolution A3-layout JPG maps for Catawba County, North Carolina. Use these larger source files when the web previews are too small for a document, presentation, or print layout.
- Included Files: Use only the versions confirmed in the article and supplied images
- File Type: Use the confirmed download contents
- Intended Use: Printing, education, presentations, and map-based projects
Related Maps
Green Map creates custom-edited map images using open geographic data sources such as geoBoundaries, Natural Earth, OpenStreetMap, and government open data.
These maps are edited visual materials, not raw data files, and are provided for education, documents, presentations, and graphic reference.