Whiteside County is overwhelmingly agricultural in the 2025 land-cover summary, with agriculture accounting for 81.29% of the mapped area. The county does not look uniform, however. A broad developed cluster stands out around Sterling and Rock Falls in the east-central part of the county, the Mississippi River forms a water-rich western edge, and the Rock River cuts diagonally through farm country with forest, wetlands, and open water appearing repeatedly along its course. The four maps on this page separate those patterns into current cover, forest and farmland, impervious surface, and long-term class difference.
The article uses WebP images for quick viewing, while the original four JPG maps are available together in one download below. Because every map uses County GEOID 17195, the same places can be cross-checked from one view to another. That makes it easier to distinguish a developed land-cover class from a highly impervious surface, or a current forest patch from a cell whose class changed between 1985 and 2025.
Table of Contents
An 81.29% agricultural landscape still has several strong regional contrasts
Agriculture is the dominant 2025 class at 81.29%. Developed land follows at 9.34%, then forest at 5.04%, water at 1.96%, and wetlands at 1.92%. Grassland accounts for 0.28% and shrubland only 0.02%. The percentages explain why yellow agricultural cover fills most of the county, but the map also shows that the smaller classes are concentrated rather than evenly scattered. Their location matters as much as their county-wide share.
Large, relatively continuous farm areas cover much of the northeast, southeast, and interior. Green forest patches become more frequent along river corridors and in several northwestern and southwestern areas. Blue water and teal wetlands interrupt the agricultural background most strongly near the Mississippi and Rock Rivers. Red developed cover is concentrated in a handful of centers instead of forming a continuous suburban belt. That combination produces a county that is agricultural overall but visually diverse near rivers and towns.
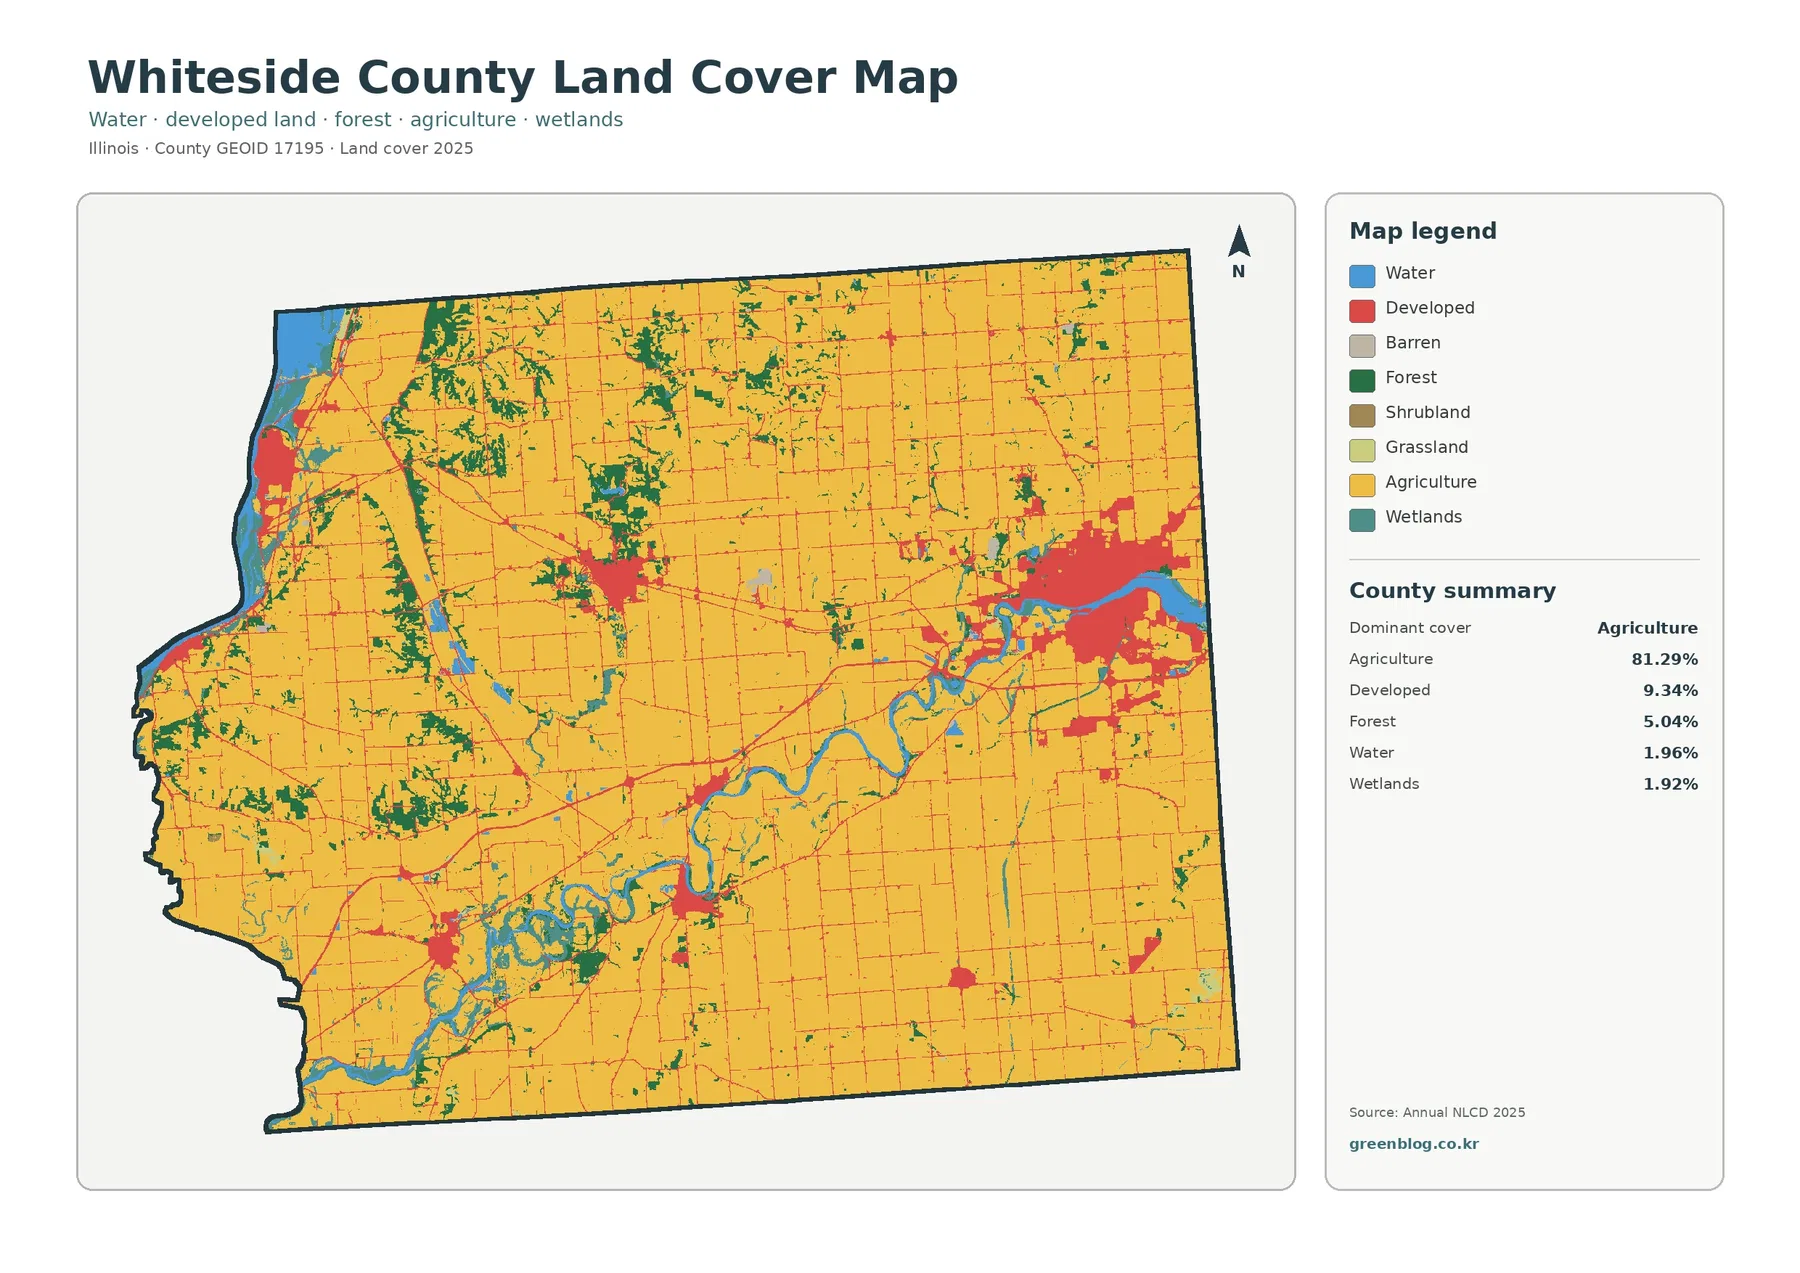
The general map is the best starting point when the question is simply, “What covers the ground here now?” It brings all major classes together, which is useful around river bends where farmland, woodland, wetlands, and water can occur within a short distance. It is less useful when the goal is to measure hard surfaces inside a town or to isolate farm-versus-forest patterns, so the next maps narrow the question.
Sterling and Rock Falls form the largest hard-surface concentration
The most prominent developed area lies in east-central Whiteside County. The county’s comprehensive plan identifies Sterling and Rock Falls in this part of the county, and the land-cover image shows a broad red cluster there. Smaller developed centers occur near the western Mississippi River edge and at several interior and southern locations. Thin developed lines connect many of these centers through the agricultural landscape, but the surrounding countryside remains largely non-impervious.
Developed cover and impervious surface are not the same measurement. Annual NLCD developed classes can include lawns, trees, soil, and other surfaces mixed with buildings and pavement. Impervious surface estimates the share covered by rooftops, paved roads, parking areas, and similar surfaces that resist water infiltration. Whiteside County’s mean impervious value is 2.75%, while only 1.52% of the county has impervious cover of 50% or more. Those numbers are far below the 9.34% developed-cover share because much developed land is not completely paved.
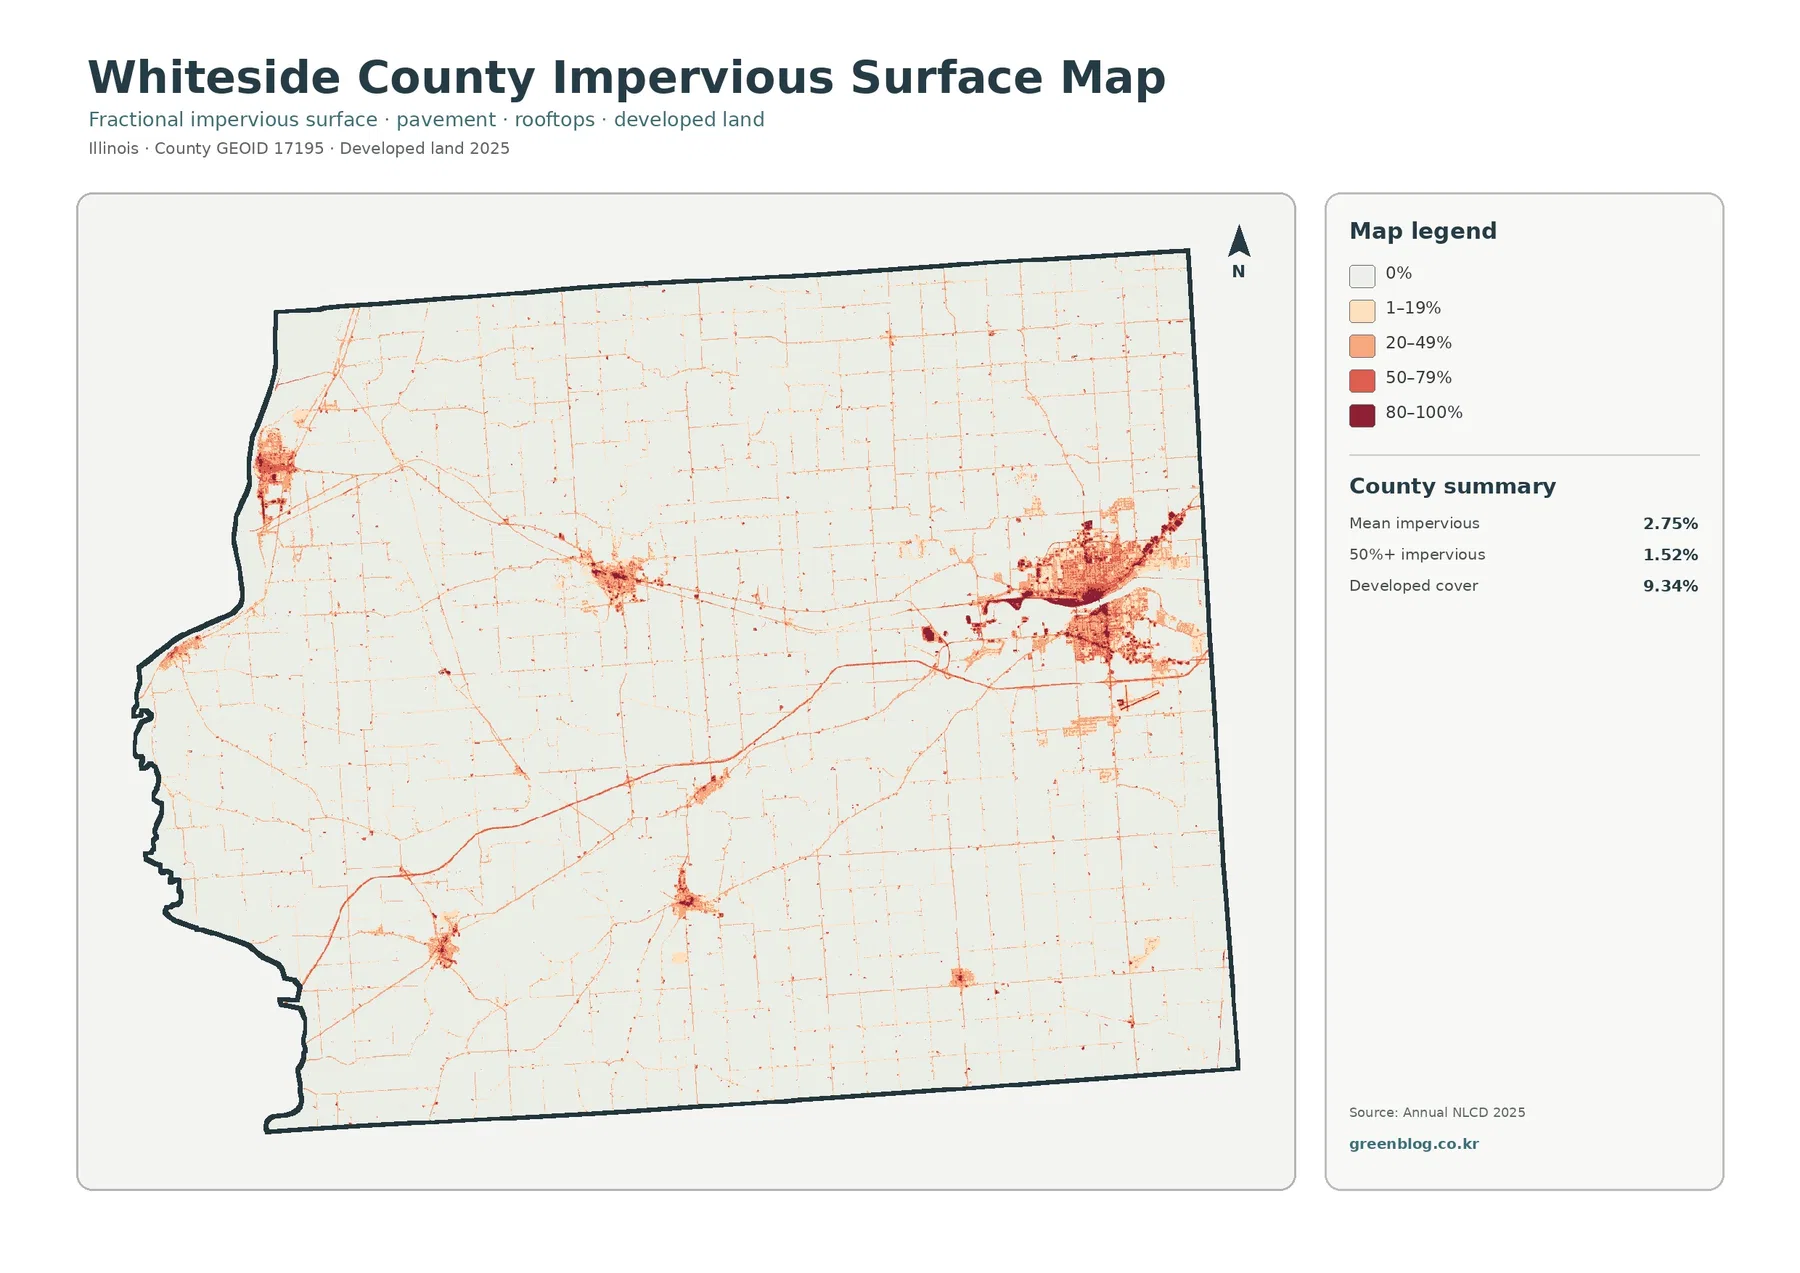
The darkest tones are concentrated in the Sterling–Rock Falls area and along selected linear connections. A smaller hard-surface cluster appears near the Mississippi River on the western side, with additional localized centers in the interior and south. Most farm and woodland areas remain pale. This makes the impervious map useful for comparing settlement intensity without treating every developed cell as equally paved.
Impervious cover should not be read as a flood-risk map. Pavement and rooftops affect how much water can infiltrate locally, but actual flooding depends on rainfall, river stage, elevation, drainage systems, soils, and many other factors. The map supports a narrower conclusion: hard surfaces are much more concentrated around the county’s developed centers than across its agricultural interior.
The Mississippi and Rock Rivers organize the county’s water, wetland, and forest pattern
Whiteside County’s official comprehensive plan places the county within the Mississippi River Basin. It notes that the Mississippi River forms the western boundary and the Rock River crosses the county diagonally from northeast to southwest. The plan also describes most of the county as part of the Rock River watershed, with the western portion in the Mississippi River watershed and a small southeastern area in the Green River watershed. Those geographic facts match the large-scale water pattern visible in the supplied map.
Water represents 1.96% of the county and wetlands 1.92%. The western boundary contains a long blue river edge, while the Rock River produces a winding blue corridor through the interior and southwest. Teal wetland cells often occur near these water features, especially where the river broadens or bends. Their combined share is modest, but their concentration gives river-adjacent parts of the county a different appearance from the broad agricultural blocks farther away.
Open water and wetlands need to remain separate in interpretation. Blue cells are classified as water; teal cells represent wetland cover, often with vegetation. Neither should be treated as a surveyed legal boundary. Annual NLCD is a raster product with cells roughly 30 meters across, so a narrow channel, trees, crops, and wet soil may fall within the same cell near an edge. The maps are strongest for county-scale distribution, not regulatory wetland delineation.
Forest is only 5.04%, but it repeatedly follows the river-dissected parts of the county
The forest-and-farmland view strips away much of the visual complexity of the developed classes and makes one contrast especially clear. Cropland dominates nearly every large open area, while forest appears as narrower green patches in the northwest, north-central interior, along sections of the Rock River, and through parts of the southwest. The forest share is much smaller than agriculture, yet its location creates recurring breaks in otherwise continuous farm country.
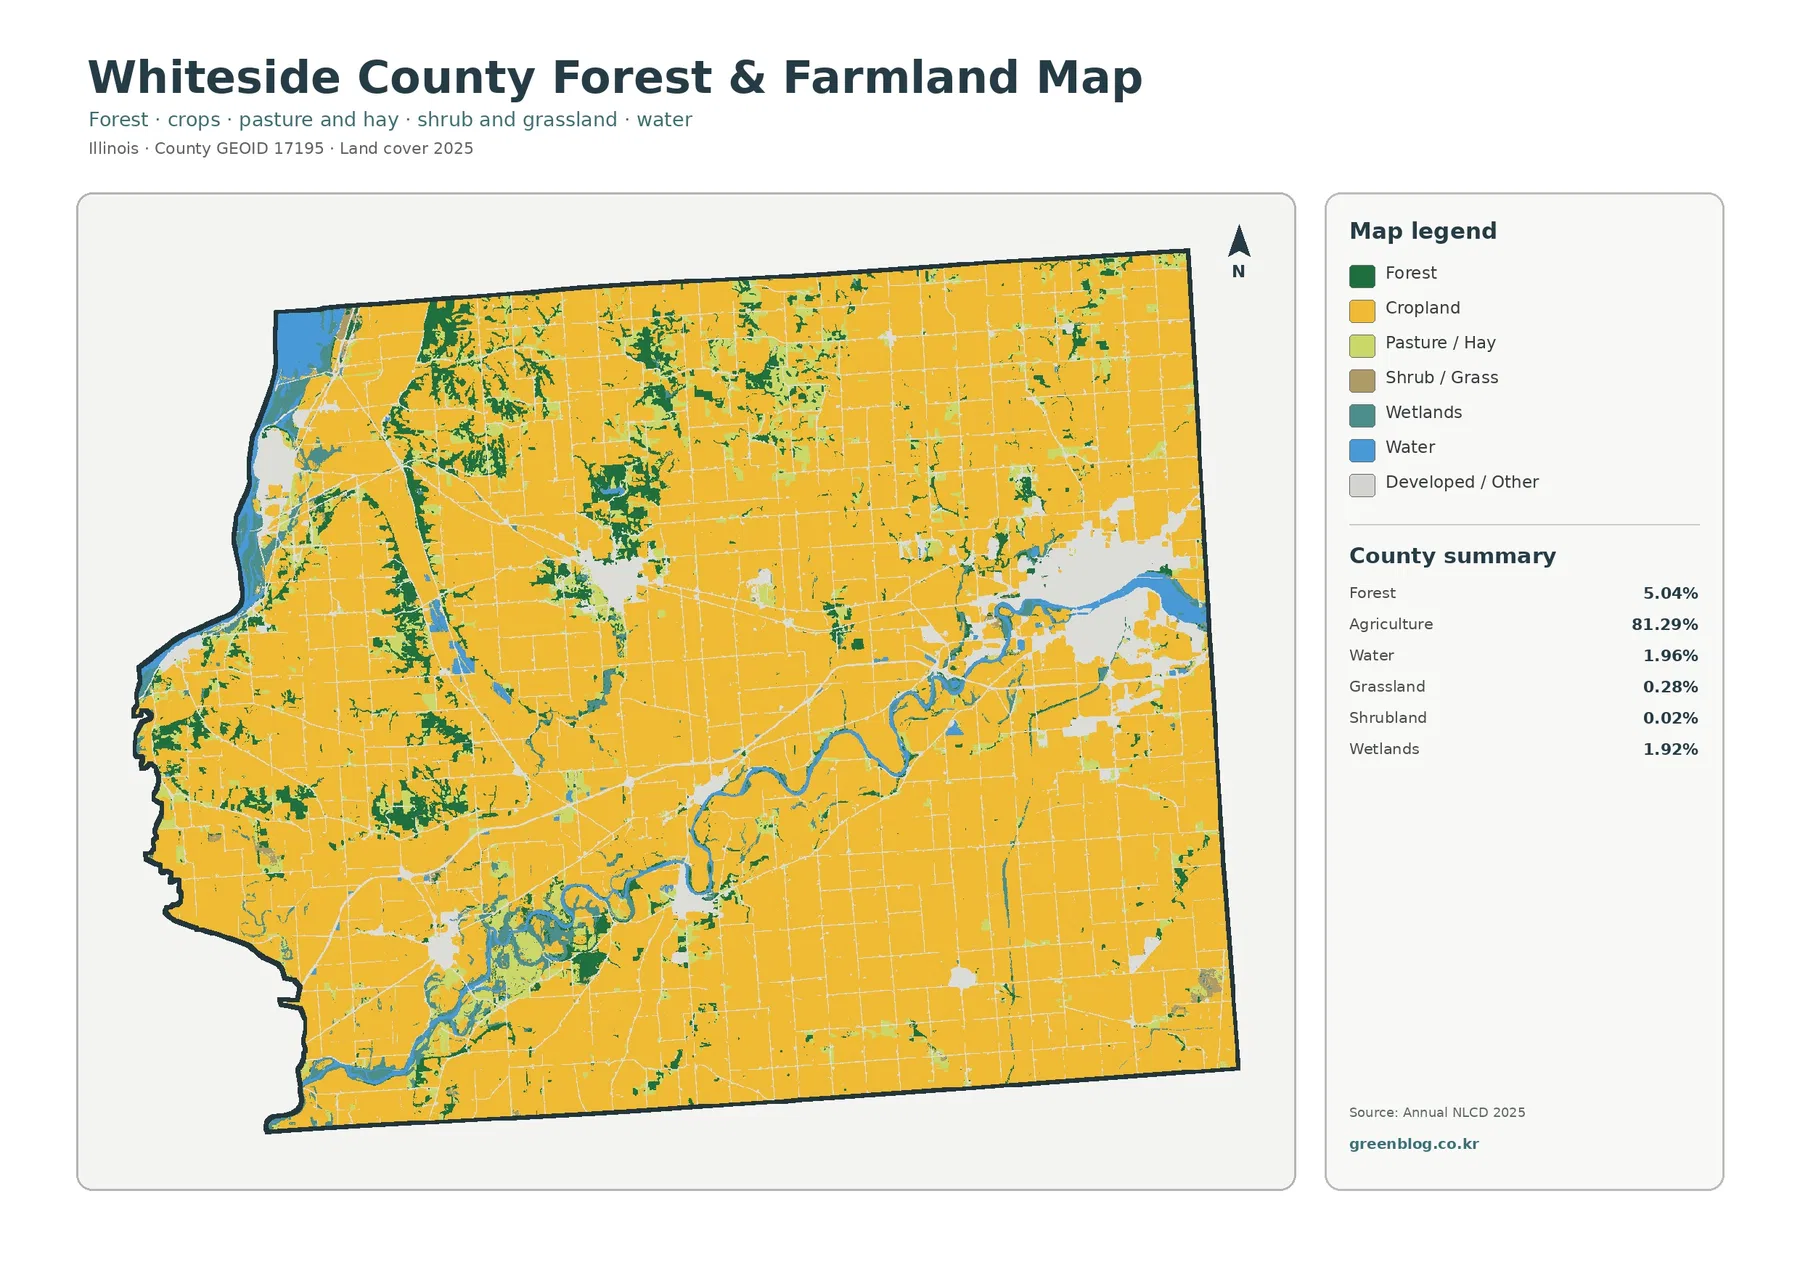
The southwest is particularly useful for comparison because water, wetlands, forest, and agriculture meet in a compact area. On the general map that mixture can look busy. In the forest-and-farmland view, the agricultural background and green woodland patches are easier to separate, while water and wetlands still preserve the river context. Farther east and northeast, cropland becomes more continuous and the green interruptions are generally smaller.
This map does not prove why forest remains in one location and not another. Slope, soils, floodplain conditions, land-management history, and ownership are separate questions that require other evidence. What the image does support is a clear spatial observation: woodland is not evenly distributed, and it appears more often where river corridors and other non-cropland surfaces break up the farm landscape.
The 1985–2025 comparison records 7.70% class difference, with “other” differences making up most of it
The change map marks cells whose land-cover classification differs between 1985 and 2025. Whiteside County’s total class difference is 7.70%. The summary separates that value into 1.43% classified as developed, 0.25% forest loss, 0.85% agricultural loss, and 5.07% other class difference. Because the “other” category is by far the largest component, the total should not be described as a verified 7.70% land-use conversion rate.
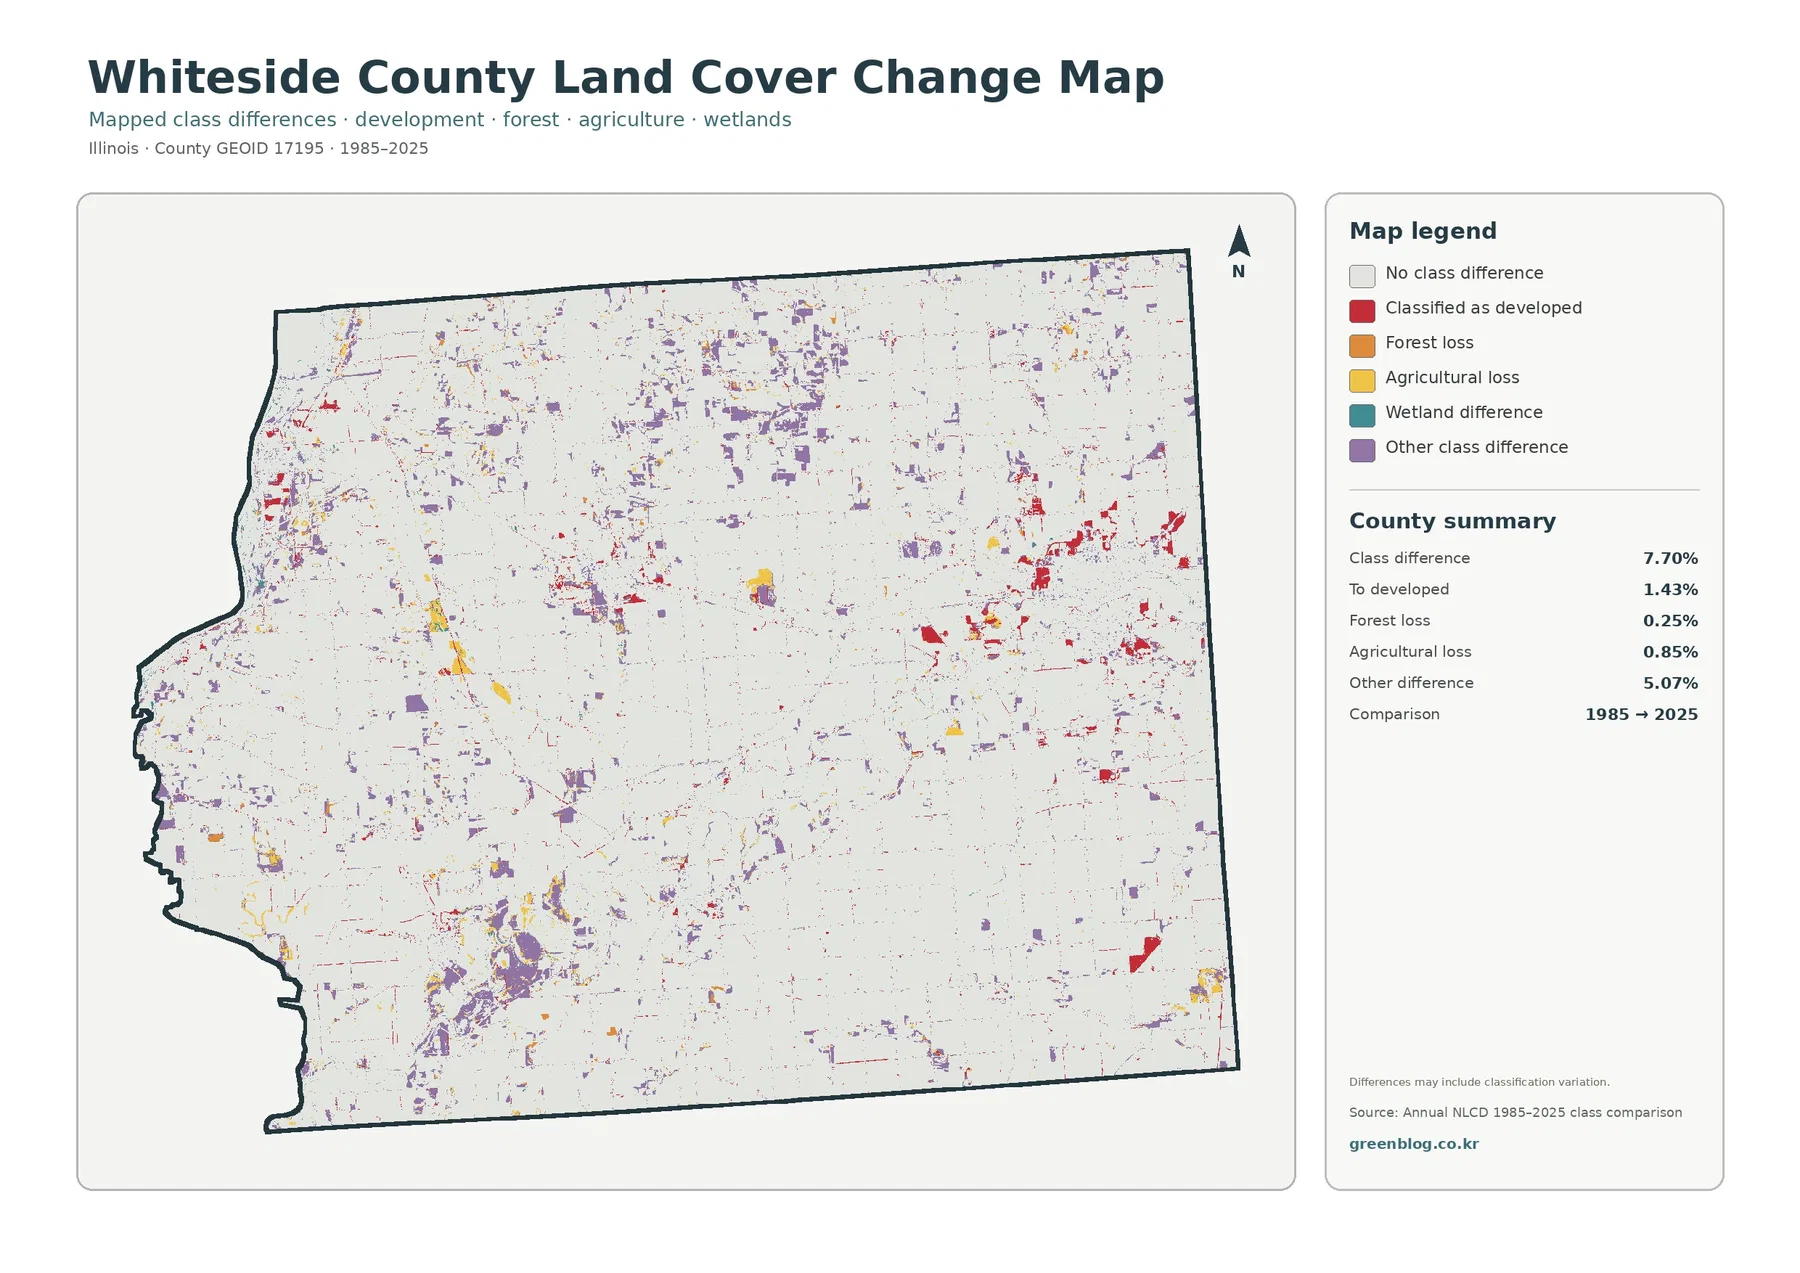
Red developed-change cells are noticeable around the east-central urban area and several smaller settlements, but the map does not show one single front of change. Purple “other difference” cells are scattered through northern, central, and western farm areas and also occur near river corridors. Yellow agricultural-loss and orange forest-loss cells appear in smaller patches. This scattered pattern is important because it argues against reducing four decades of mapped difference to one simple development story.
Long-term class comparisons can capture real development and vegetation change, but they can also reflect acquisition timing, classification methods, mixed pixels, water conditions, or seasonal differences. A colored change cell is therefore a place to investigate rather than proof of a specific event. Verifying a site would normally involve additional NLCD years, aerial imagery, local planning records, or other time-specific evidence.
Choose the map by the question rather than treating all four as interchangeable
For a county-wide overview, the general land-cover map is the most informative because agriculture, development, forest, water, and wetlands appear together. It works well when comparing the long agricultural interior with the Mississippi River boundary or the Rock River corridor. The forest-and-farmland map is better when the goal is to see where woodland interrupts cropland without the full set of developed colors competing for attention.
Questions about built intensity belong on the impervious map. Around Sterling and Rock Falls, the developed class covers a broad area, but the darkest impervious values occupy a smaller core and selected road-like connections. That difference helps explain why developed cover can be 9.34% while mean impervious cover is only 2.75%. For historical comparison, neither of those current-condition maps substitutes for the 1985–2025 class-difference map.
Cross-checking the same location across all four views is especially helpful near the Rock River. A river bend may contain current water, wetlands, forest, and agriculture; it may have low impervious cover; and it may still contain several change cells. Those statements describe different properties of the same place. Keeping them separate prevents a common mistake: assuming that every current class visible today is also a recent change.
The maps are county-scale classifications, not parcel, zoning, or ownership records
Annual NLCD uses a raster grid rather than surveyed parcel lines. Each roughly 30-meter cell receives a representative class or impervious value even though several real surfaces may occur inside it. That generalization matters along narrow roads, riverbanks, wetland margins, and the edges of towns. A sharp color boundary on the map should not be assumed to match a property line, a legal wetland boundary, or a zoning district.
Land cover also differs from legal land use. These maps classify what is physically on the surface—such as crops, forest, water, wetlands, or developed cover. They do not say whether construction is permitted, who owns a parcel, or what zoning rules apply. Whiteside County’s official GIS and planning resources are the appropriate place for those administrative questions, while the supplied maps are designed for broad environmental and landscape comparison.
A useful reading method is to start with large, repeated patterns before focusing on isolated cells. The 81.29% agricultural background, the Sterling–Rock Falls developed cluster, the Mississippi River boundary, and the diagonal Rock River corridor are all large enough to support county-level description. A single small change patch or a narrow wetland edge needs more caution because mixed pixels and classification uncertainty matter more at that scale.
Download four JPG maps for side-by-side Whiteside County comparison
The ZIP includes the general land-cover map, forest-and-farmland map, impervious/developed-land map, and 1985–2025 land-cover change map as JPG files. Because the four images share the same county boundary, they can be aligned mentally when comparing the Sterling–Rock Falls area, the Mississippi River edge, the Rock River corridor, or the large agricultural interior. The browser-friendly WebP images are convenient for reading online, while the JPG set is useful when a local copy is needed for a document, class handout, presentation, or map comparison.
Frequently Asked Questions
Why do the Mississippi and Rock Rivers matter when reading the Whiteside County maps?
The Mississippi forms the county’s western boundary, while the Rock River crosses the county diagonally. Water, wetlands, and forest repeatedly cluster near those corridors, so river-adjacent areas have a more varied land-cover mix than many of the broad agricultural areas farther away.
Why is developed cover 9.34% when mean impervious cover is only 2.75%?
Developed classes can include permeable surfaces such as lawns, trees, and bare soil mixed with buildings and roads. Impervious cover measures the hard-surface share more directly. In Whiteside County, the highest impervious values are concentrated around Sterling–Rock Falls and a few smaller developed centers rather than covering every developed cell at the same intensity.
Does the 7.70% class difference mean 7.70% of the county was developed between 1985 and 2025?
No. Only 1.43% is summarized as change to developed. The 7.70% total also includes forest loss, agricultural loss, and 5.07% in other class differences. Classification methods, mixed pixels, and conditions at the time of observation can also contribute, so a specific site should be verified with additional years or local records.
Map File Information
Download four original JPG maps for Whiteside County to compare agriculture, forest, water and wetlands, developed land, impervious surfaces, and mapped class differences from 1985 to 2025.
- Included Files: Land cover map, forest and farmland map, impervious/developed land map, land cover change map
- File Type: Four JPG maps in one ZIP
- Intended Use: Farm and forest comparison, river-corridor review, built-surface comparison, and long-term class review
Related Maps
- Adams County Illinois Land Cover Map
- Alexander County Illinois Land Cover Map
- Bond County Illinois Land Cover Map
Sources and References
The percentages and map descriptions in this article come from the supplied Annual NLCD 2025 maps and the 1985–2025 class comparison. Local context for the Mississippi River, Rock River, watersheds, and communities comes from the official Whiteside County comprehensive plan. Illinois Extension provides additional regional agriculture and natural-resource information for Carroll, Lee, and Whiteside Counties.
- MRLC Annual NLCD Data – Annual land-cover and impervious-surface datasets
- USGS Annual NLCD Land Cover Classification – Land-cover classes and interpretation guidance
- U.S. Census Bureau TIGER/Line Shapefiles – Standard county boundary and geographic reference data
- Whiteside County Comprehensive Plan – Official county context for rivers, watersheds, communities, and planning
- Illinois Extension – Carroll, Lee and Whiteside Counties – Regional agriculture and natural-resource education
Green Map creates custom-edited map images using open geographic data sources such as geoBoundaries, Natural Earth, OpenStreetMap, and government open data. These maps are edited visual materials, not raw data files, and are provided for education, documents, presentations, and graphic reference.