The Greenlee County Arizona Land Cover Map is especially useful for seeing how little of this long, narrow county is built over. The 2025 impervious-surface view is almost entirely pale, with the clearest hard-surface concentration in the west-central part of the county. That small cluster sits within a much larger landscape dominated by shrubland and forest.
This page includes four views: general land cover, forest and farmland, impervious surface/developed land, and 1985–2025 land-cover change. The four original 2480 × 1754 JPG maps are available together in one ZIP from the download section. They are useful for teaching, presentation graphics, county-scale environmental comparison, and general reference.
Table of Contents
A 0.26% impervious mean makes the developed cluster stand out
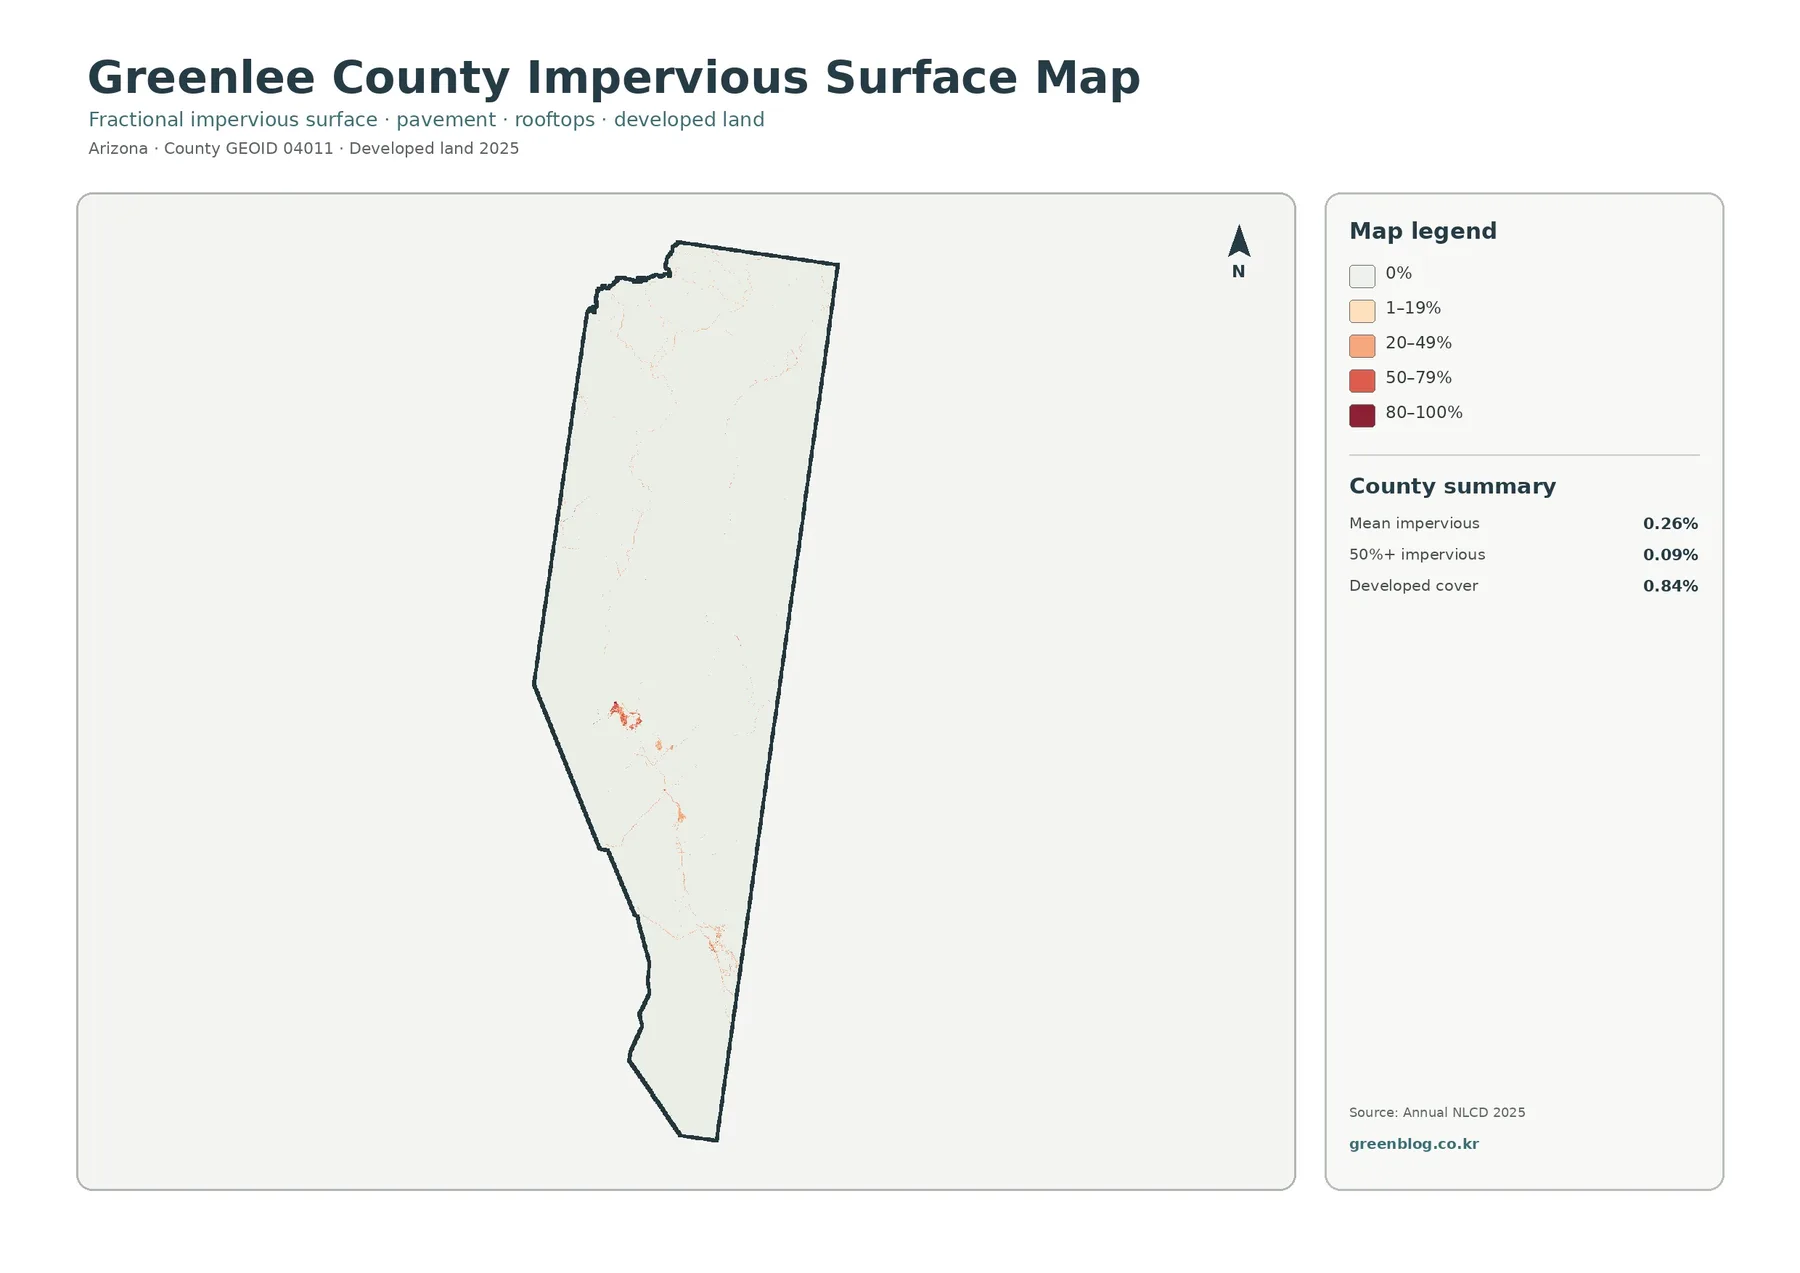
Impervious surface means pavement, rooftops, and other hard materials that limit water infiltration. Greenlee County has a countywide mean of only 0.26%, and cells that are at least 50% impervious account for 0.09%. Most of the map is therefore very light. The strongest orange and red concentration appears in the west-central part of the county, with smaller marks farther south.
County sources identify Clifton as the county seat and describe Morenci as the area’s major mining center. That local context is helpful when reading the cluster because the general land-cover map also contains a large west-central patch of barren and developed cover. The maps show that built and heavily disturbed surfaces occupy a small share of the county even though they are locally prominent around the main population and industrial area.
The 0.84% developed class is not the same measurement as the 0.26% mean impervious value. Developed cells can contain trees, soil, lawns, and other permeable ground along with roads and buildings. Imperviousness measures the share of hard surface more directly. A developed percentage that exceeds the impervious mean is therefore expected rather than contradictory.
Use this view to compare where hard surfaces are concentrated at county scale, not to measure a specific road, mine facility, house lot, or parking area. The underlying land-cover products generalize the ground into roughly 30-meter cells, so detailed site analysis requires finer imagery and local records.
Forest dominates the north while shrubland expands southward
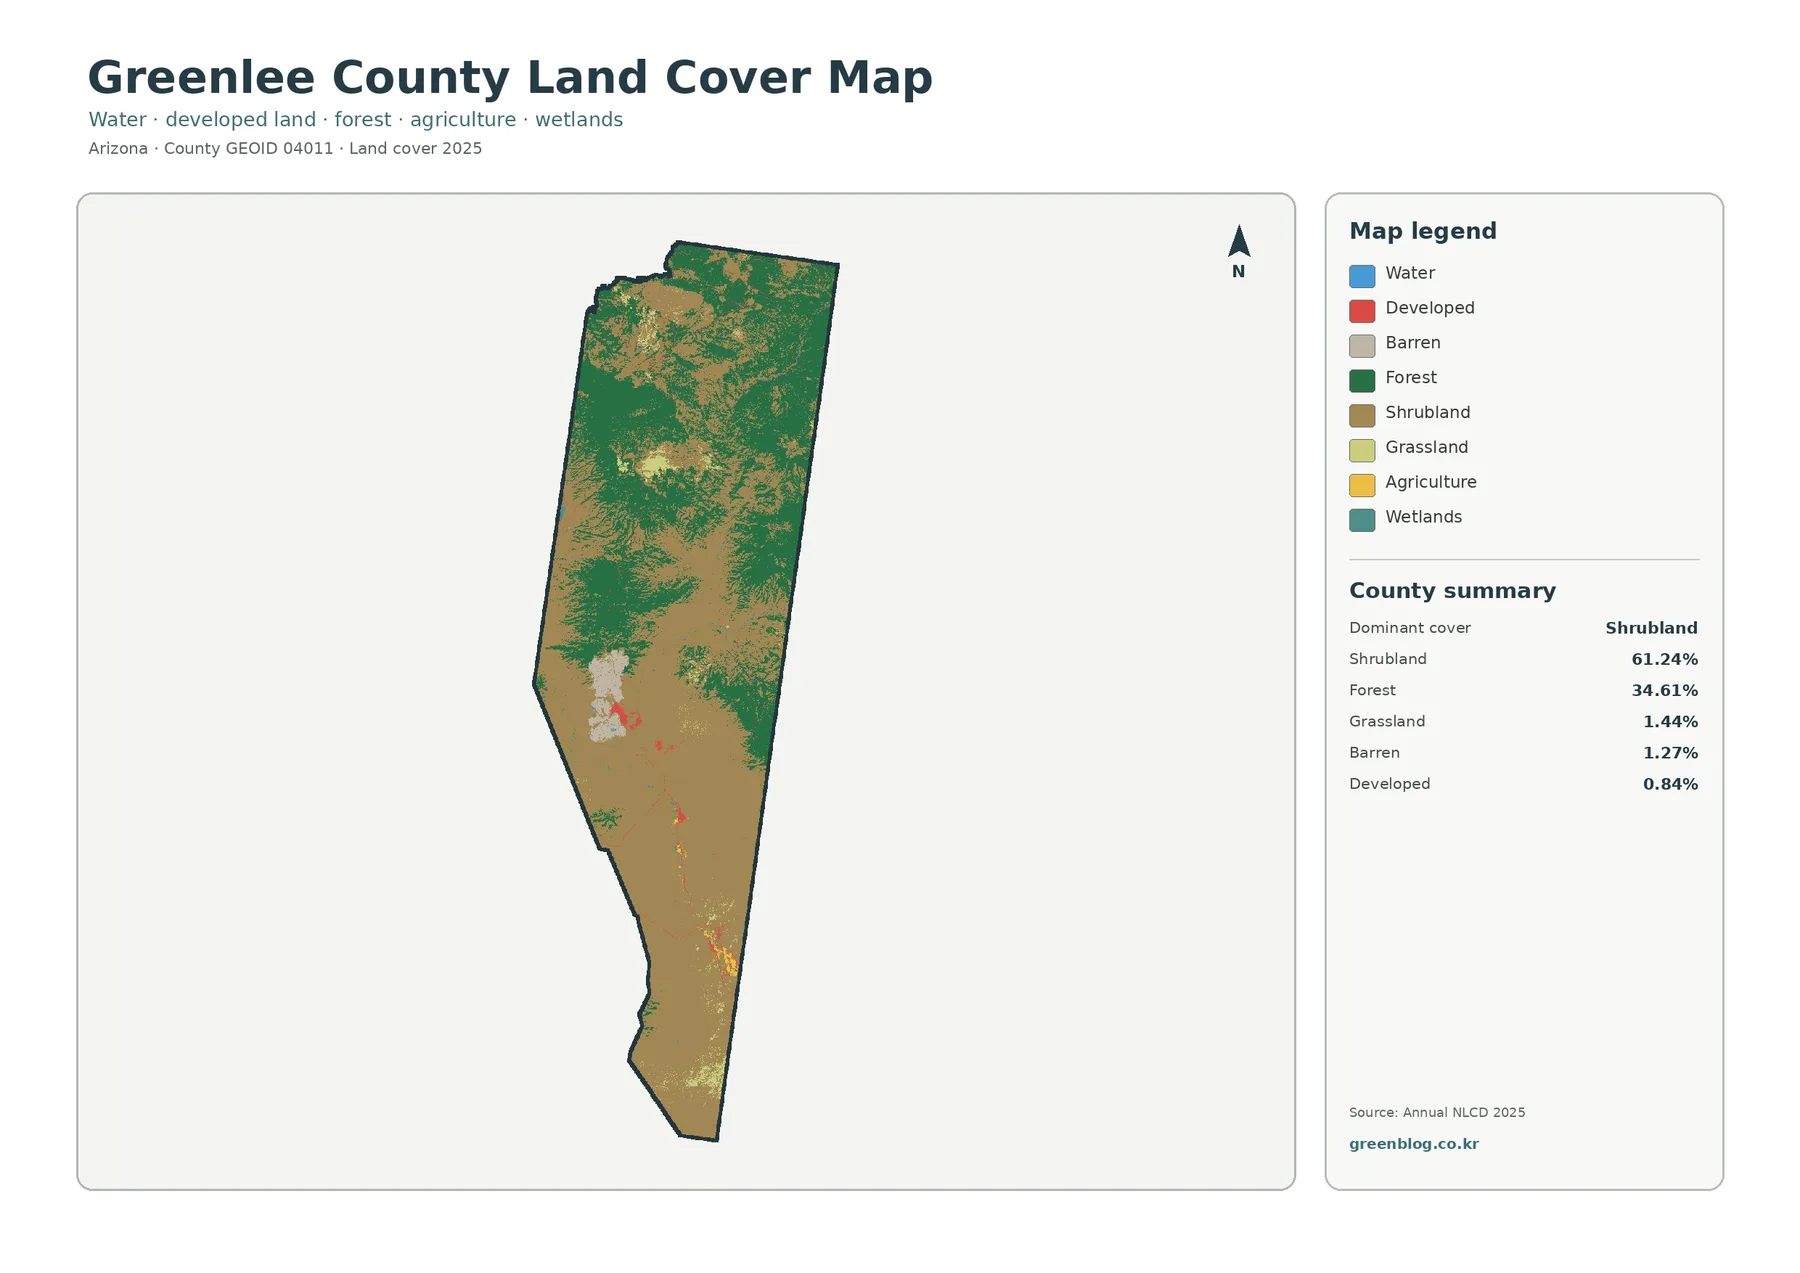
The general map makes the county’s north-south contrast clear. Forest covers much of the north and northwest, while shrubland becomes more extensive through the center and dominates most of the south. The transition is not a straight line. Forest and shrub classes interlock through the middle of the county, creating a broad mixed area before shrubland becomes the main cover farther south.
Shrubland is the largest countywide class at 61.24%, but the map prevents that number from flattening the county into one uniform landscape. Forest still accounts for 34.61% and forms large connected areas in the north. Grassland, barren land, and developed cover are much smaller shares, yet some of those small classes are easy to locate because they occur in compact patches.
The largest barren/developed patch appears west of center and differs sharply from the surrounding forest and shrub colors. County history pages describe the long importance of the Morenci copper district, which provides a useful place-based reference for this part of Greenlee County. The land-cover map itself does not show ownership, mine boundaries, permits, or mineral rights; it only classifies the surface visible in the raster data.
Most mapped 1985–2025 change is forest loss, not new development
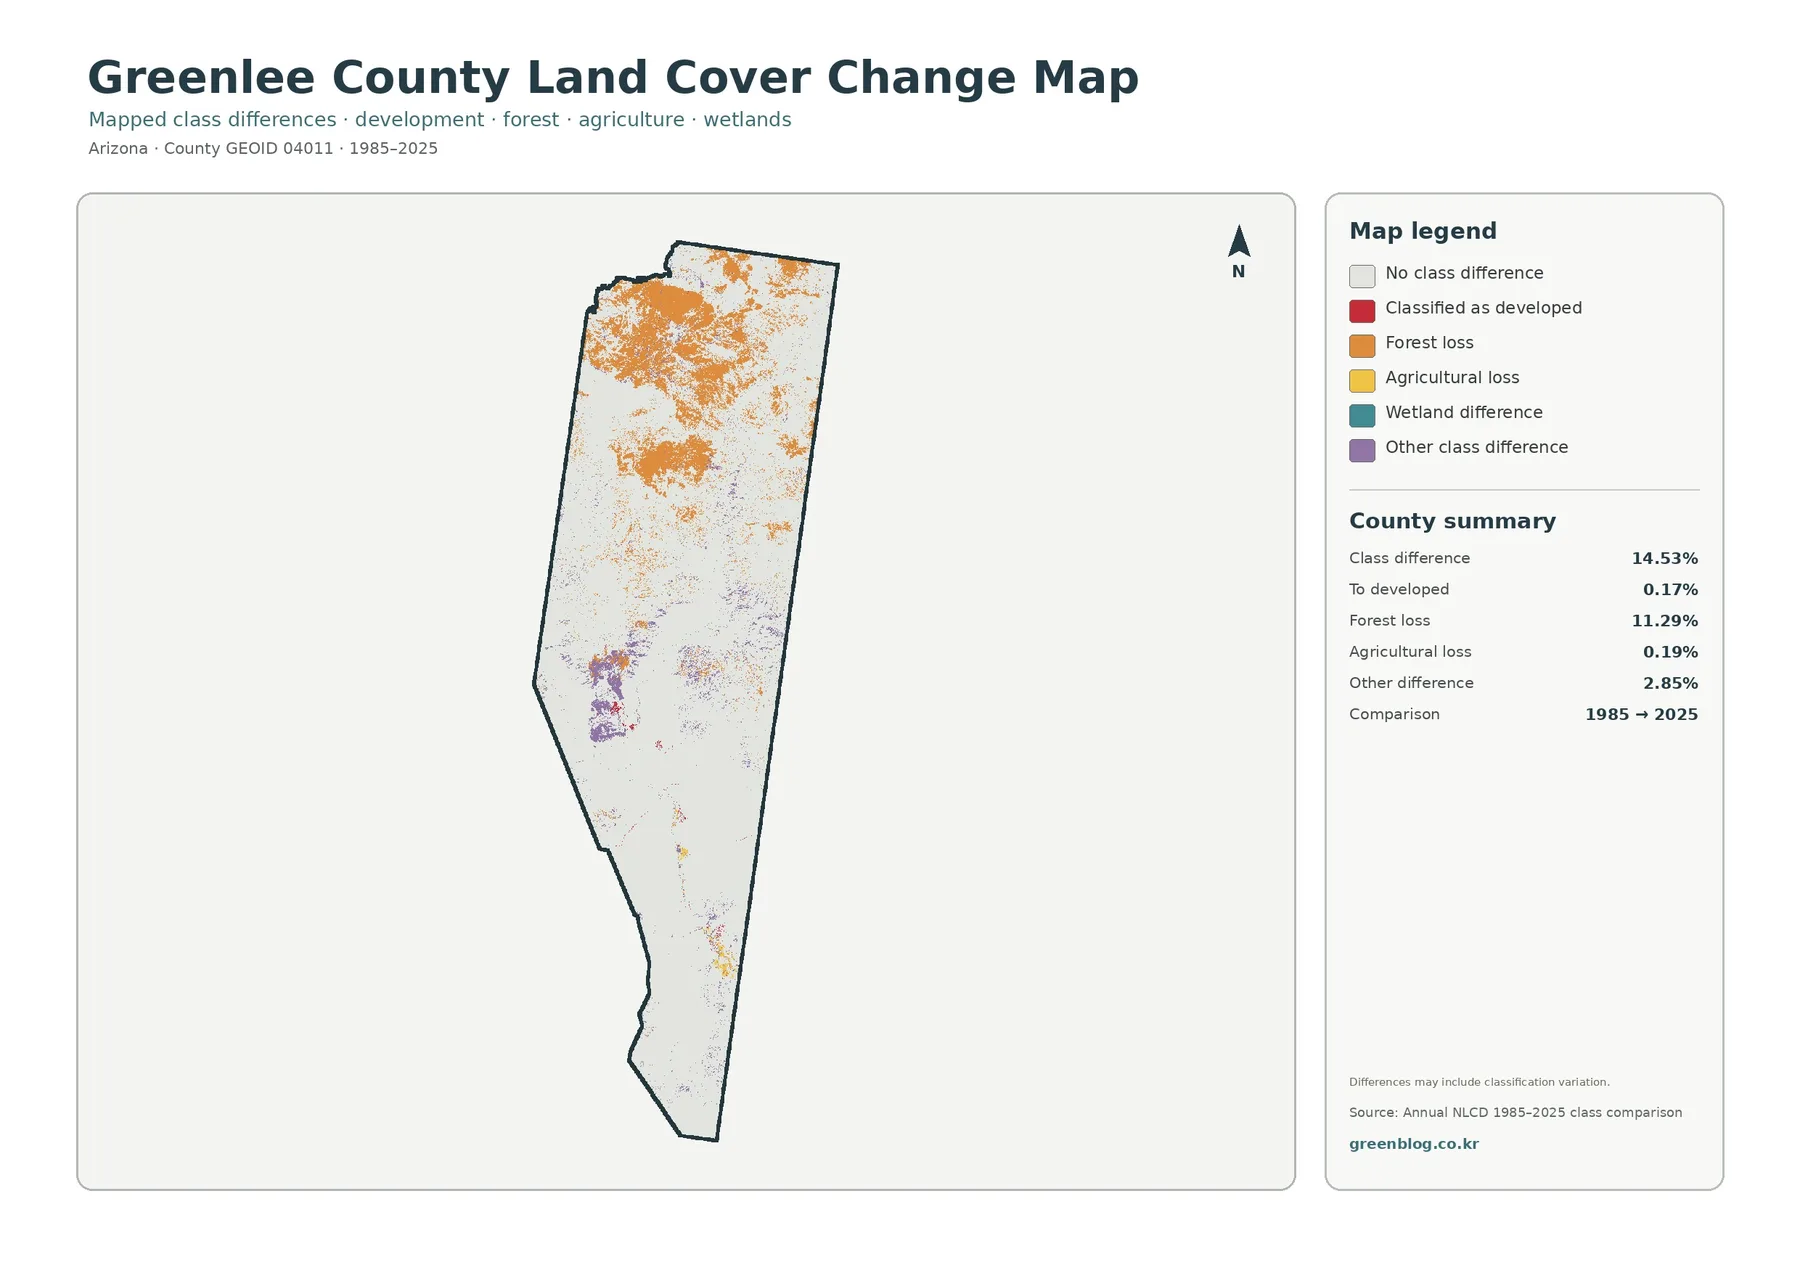
The change map separates total class difference from specific types of change. Its 14.53% figure means that those cells received different land-cover classifications in the 1985 and 2025 comparison. Only 0.17% is labeled as transition to developed. Forest loss is much larger at 11.29%, while agricultural loss is 0.19% and other class difference is 2.85%.
Orange forest-loss marks are especially widespread across the northern forested portion of the county and appear again in smaller patches farther south. Purple other-class differences are concentrated around parts of the west-central disturbed area and scattered elsewhere. Red developed-transition cells are much more limited. The distribution makes it clear that the countywide change percentage cannot be treated as an urban-growth rate.
A forest-loss classification does not identify the cause. Fire, vegetation change, timber activity, drought, mining disturbance, or classification uncertainty would need separate evidence. The map is best used to locate places that changed between the two mapped years and then guide a follow-up review of imagery, fire records, forest-management information, or other local sources.
The simplified forest view shows how little mapped agriculture occupies
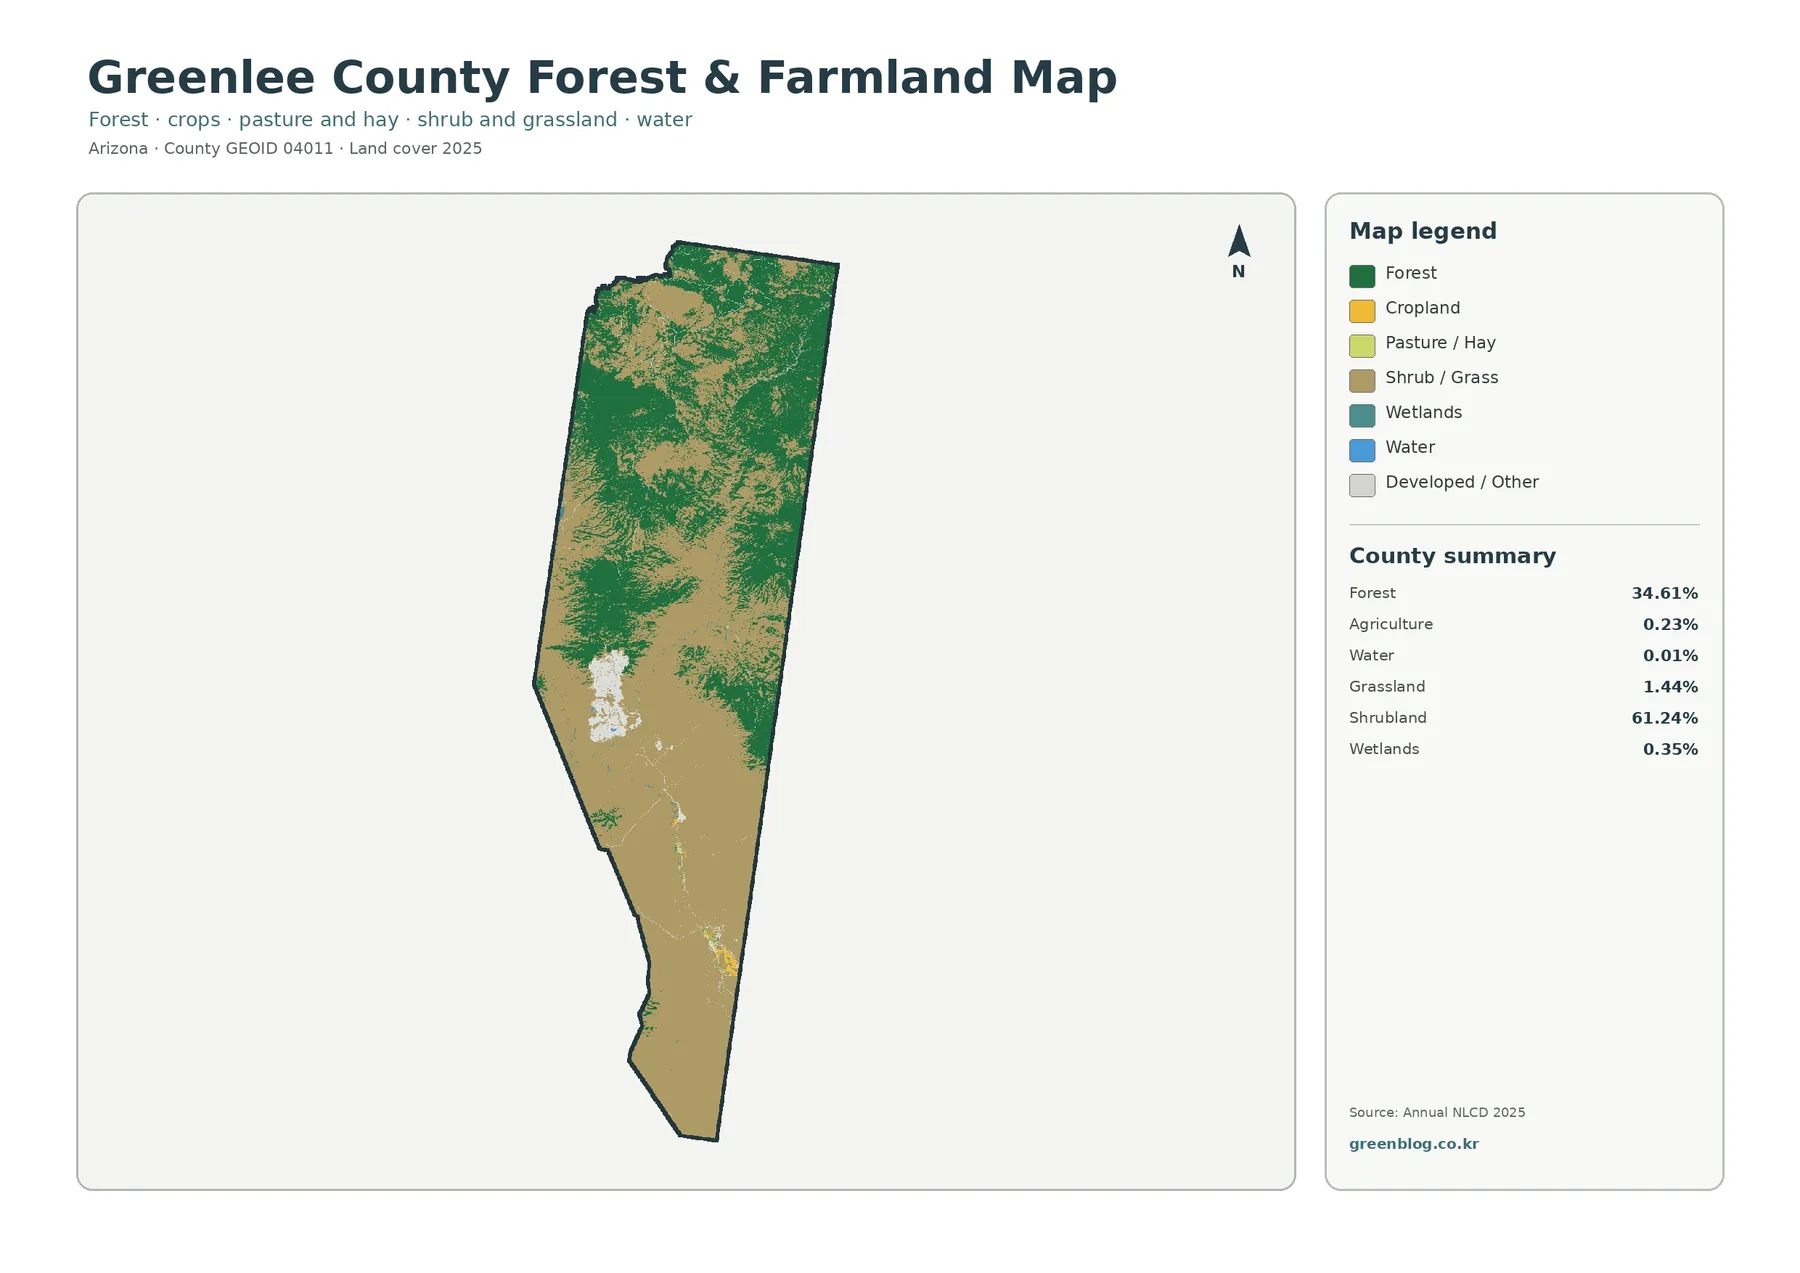
Removing several minor classes from the legend makes the forest geography easier to follow. Green covers broad northern areas, then becomes more broken through the center before shrub and grass classes take over much of the south. The 34.61% forest share is therefore concentrated rather than evenly spread across the county.
Agriculture occupies 0.23% of the mapped area. Small agricultural patches appear mostly in the southern and south-central parts of the county rather than as a broad continuous farming region. That number should not be used to measure the county’s agricultural economy. Land cover records the surface class of raster cells, while farm production, grazing, ownership, and agricultural value require separate statistics.
Water is only 0.01% in the county summary and wetlands 0.35%. Even so, Greenlee County’s official visitor information highlights the Black River, Eagle Creek, Blue River, Gila River, and San Francisco River as local recreation and fishing resources. Narrow river corridors can matter greatly to local geography while contributing very little to a countywide area percentage.
Clifton, Morenci, and the San Francisco River provide useful reference points
Greenlee County describes Clifton as a town set in a rugged mountain canyon shaped by the San Francisco River. The county’s history material also explains the long connection between Clifton, Morenci, and copper mining. These named places help a reader relate the land-cover patterns to recognizable local geography without turning the land-cover classes into administrative or property boundaries.
The county’s Points of Interest page lists rivers and creeks used for fishing and recreation, and it identifies the Duncan Valley as another distinct local setting. Those references are useful when comparing the small agricultural patches in the south with the much larger shrub-dominated landscape. They also explain why a tiny water percentage does not mean rivers are unimportant to residents or visitors.
Keep the source types separate. Land-cover colors describe surface condition. County pages describe towns, rivers, recreation, and history. Property ownership, mining claims, federal land boundaries, and zoning come from still other records. Combining these sources is helpful only when each keeps its own meaning.
Match each map to a specific question
- Countywide cover: use the general map to compare the forested north with the shrub-dominated south and the large west-central barren patch.
- Forest and agriculture: use the simplified map to focus on the 34.61% forest share and the small 0.23% agricultural footprint.
- Built surfaces: use the impervious map to show how a 0.26% county mean can still contain a visible Clifton-Morenci area concentration.
- Time comparison: use the change map to separate total class difference, forest loss, other change, and transition to developed.
For a classroom sequence, the impervious map can be an effective opening because it immediately shows how sparse hard surfaces are. Follow it with the general map to explain what covers the remaining land, then use the forest-and-farmland view for a simpler comparison. The change map works best at the end, once readers already understand the 2025 pattern.
Presentation graphics benefit from fewer, larger maps. If the topic is forest change, pair the general map with the change map. If the topic is settlement and industry, pair the impervious map with the general land-cover view. Keeping the legend readable is more useful than shrinking all four maps onto one slide.
Raster cells simplify small features and the 2025 map has a fixed date
Annual NLCD products divide the landscape into raster cells, roughly 30 meters across for the land-cover classification used here. A single cell can contain road, vegetation, soil, and buildings but still receive one class. Small river edges, narrow roads, mixed development, and small fields can therefore be simplified in the county map.
The 2025 maps represent the classification for that observation year. Later construction, vegetation change, fire effects, or mine disturbance will not appear until reflected in newer source data. Change comparisons also include normal classification variation around boundaries and mixed surfaces, so a small changed pixel should not be treated as final proof of a real-world conversion without checking other evidence.
Download the four Greenlee County land-cover JPG maps
Frequently Asked Questions
Does the land-cover map show land ownership or mining boundaries?
No. It classifies surface cover such as forest, shrubland, barren ground, and developed land. Property ownership, mining claims, permits, and administrative boundaries require separate official records.
Does the 14.53% class difference mean 14.53% of the county was developed?
No. The 14.53% figure includes every cell assigned to a different class in the 1985 and 2025 comparison. Transition to developed is a separate 0.17% category.
What is included in the download?
The archive contains four 2480 × 1754 JPG files: general land cover, forest and farmland, impervious surface/developed land, and 1985–2025 land-cover change.
Map File Information
Greenlee County Land-Cover Map Files
- Included Files: Use only the versions confirmed in the article and supplied images
- File Type: Use the confirmed download contents
- Intended Use: Printing, education, presentations, and map-based projects
Related Maps
- Apache County Arizona Land Cover Map
- Cochise County Arizona Land Cover Map
- Coconino County Arizona Land Cover Map
Sources and reference links
- MRLC Annual NLCD Data — land-cover and impervious-surface data access
- USGS Annual NLCD Land Cover Classification — land-cover class information
- U.S. Census Bureau TIGER/Line Shapefiles — county boundary reference
- Greenlee County Points of Interest — Clifton, rivers, recreation, and local place context
- Greenlee County History — Clifton, Morenci, and mining history
Green Map creates custom-edited map images using open geographic data sources such as geoBoundaries, Natural Earth, OpenStreetMap, and government open data.
These maps are edited visual materials, not raw data files, and are provided for education, documents, presentations, and graphic reference.