Forest is the defining surface across Crawford County in the supplied 2025 data. It covers 70.51% of the county, while agriculture accounts for 19.41% and developed land for 7.45%. Rather than a broad farm grid or one large urban center, the county is dominated by continuous green cover interrupted by openings, narrow developed traces, and several small built clusters. This Crawford County Indiana Land Cover Map set is designed to make those contrasts easy to compare.
Four WebP previews are included on the page: current land cover, forest and farmland, impervious surface, and a 1985–2025 class-difference map. The original 2480 × 1754-pixel JPG versions are available together in one ZIP below. They work well for county profiles, classroom comparison, environmental presentations, and other uses that need a clear countywide view rather than parcel-level detail.
Table of Contents
A county where forest remains the main surface in every direction
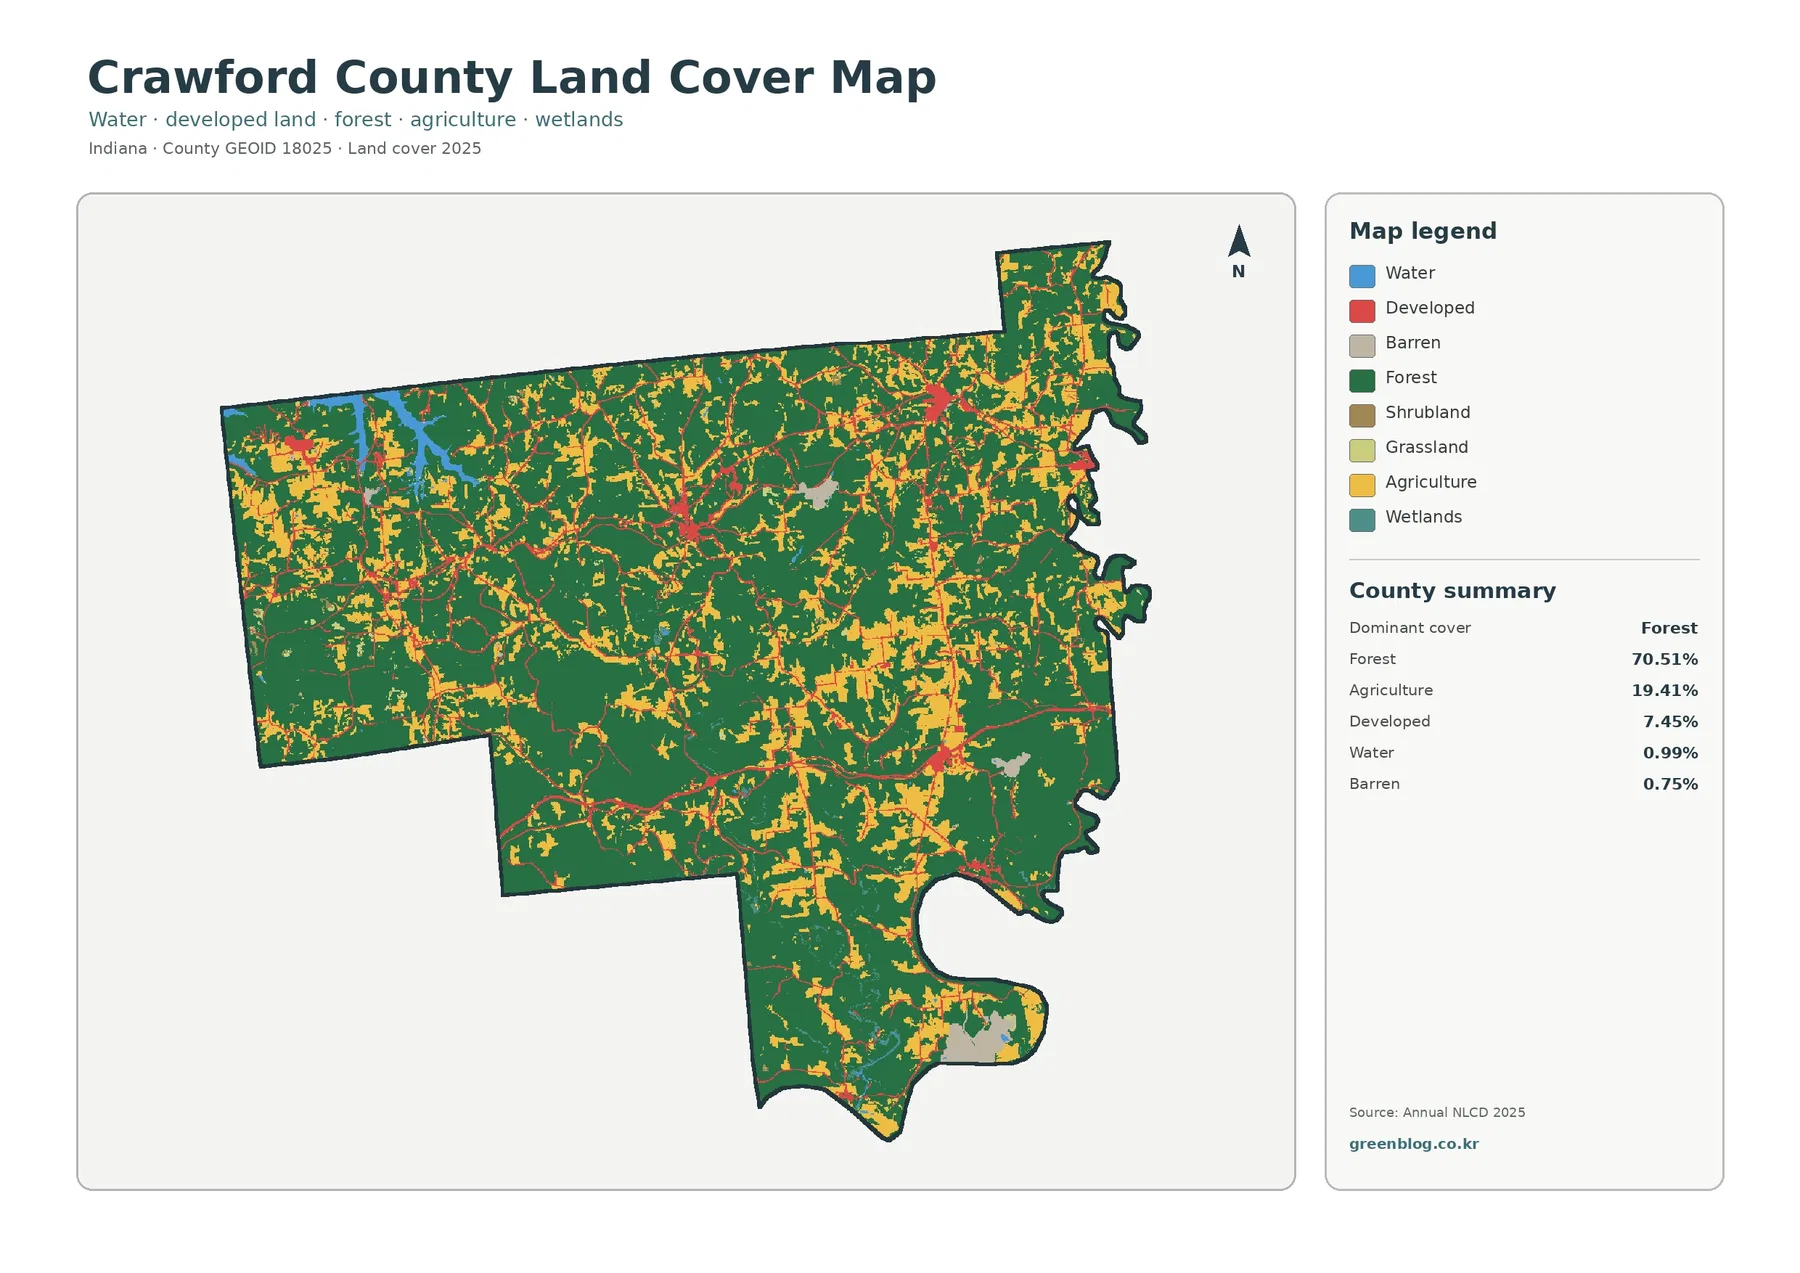
The county summary puts forest far ahead of every other class at 70.51%. Agriculture is second at 19.41%, developed cover is 7.45%, water is 0.99%, barren land is 0.75%, wetlands are 0.36%, grassland is 0.35%, and shrubland is 0.17%. Those numbers match the visual impression: dark green spans much of the west, center, south, and east, while yellow farm areas appear as openings and strips rather than as a nearly continuous agricultural grid.
The agricultural openings are more noticeable in parts of the north and through several central areas, but forest repeatedly separates them. This is useful when comparing Crawford County with Indiana counties farther north, where cropland can occupy most of the map. Here, farmland is an important second class without becoming the visual background. The forest-and-farmland view later in the page removes much of the developed color and makes that relationship easier to see.
Developed land forms several isolated clusters instead of one dominant metropolitan footprint. Red cells also follow thin lines between those clusters, a pattern that can coincide with roads and settlement corridors. The preview does not label roads or municipal boundaries, so the small patches should not be assigned to a town from the land-cover image alone. Crawford County’s official directory lists places such as English, Leavenworth, Marengo, Milltown, and Alton, but a boundary or transportation layer is needed to match each patch precisely.
Water covers less than one percent of the county, yet a branching blue feature in the northwest and water along the irregular southeastern side are visually prominent. Small wetland areas are a different class from open water. A blue cell represents exposed water surface in the classification, while a wetland cell can include water-influenced vegetation or saturated ground. The two classes should not be combined simply because both relate to water.
Land cover is also different from zoning and ownership. Annual NLCD classifies what the ground surface looks like from remotely sensed data. A developed cell can include lawns, trees, soil, and buildings, while an agricultural cell does not identify a farm owner, crop, or legal parcel. The map is useful for county-scale comparison, not for deciding what can be built on a property or where one ownership boundary ends.
The 1985–2025 comparison is mostly an endpoint classification check
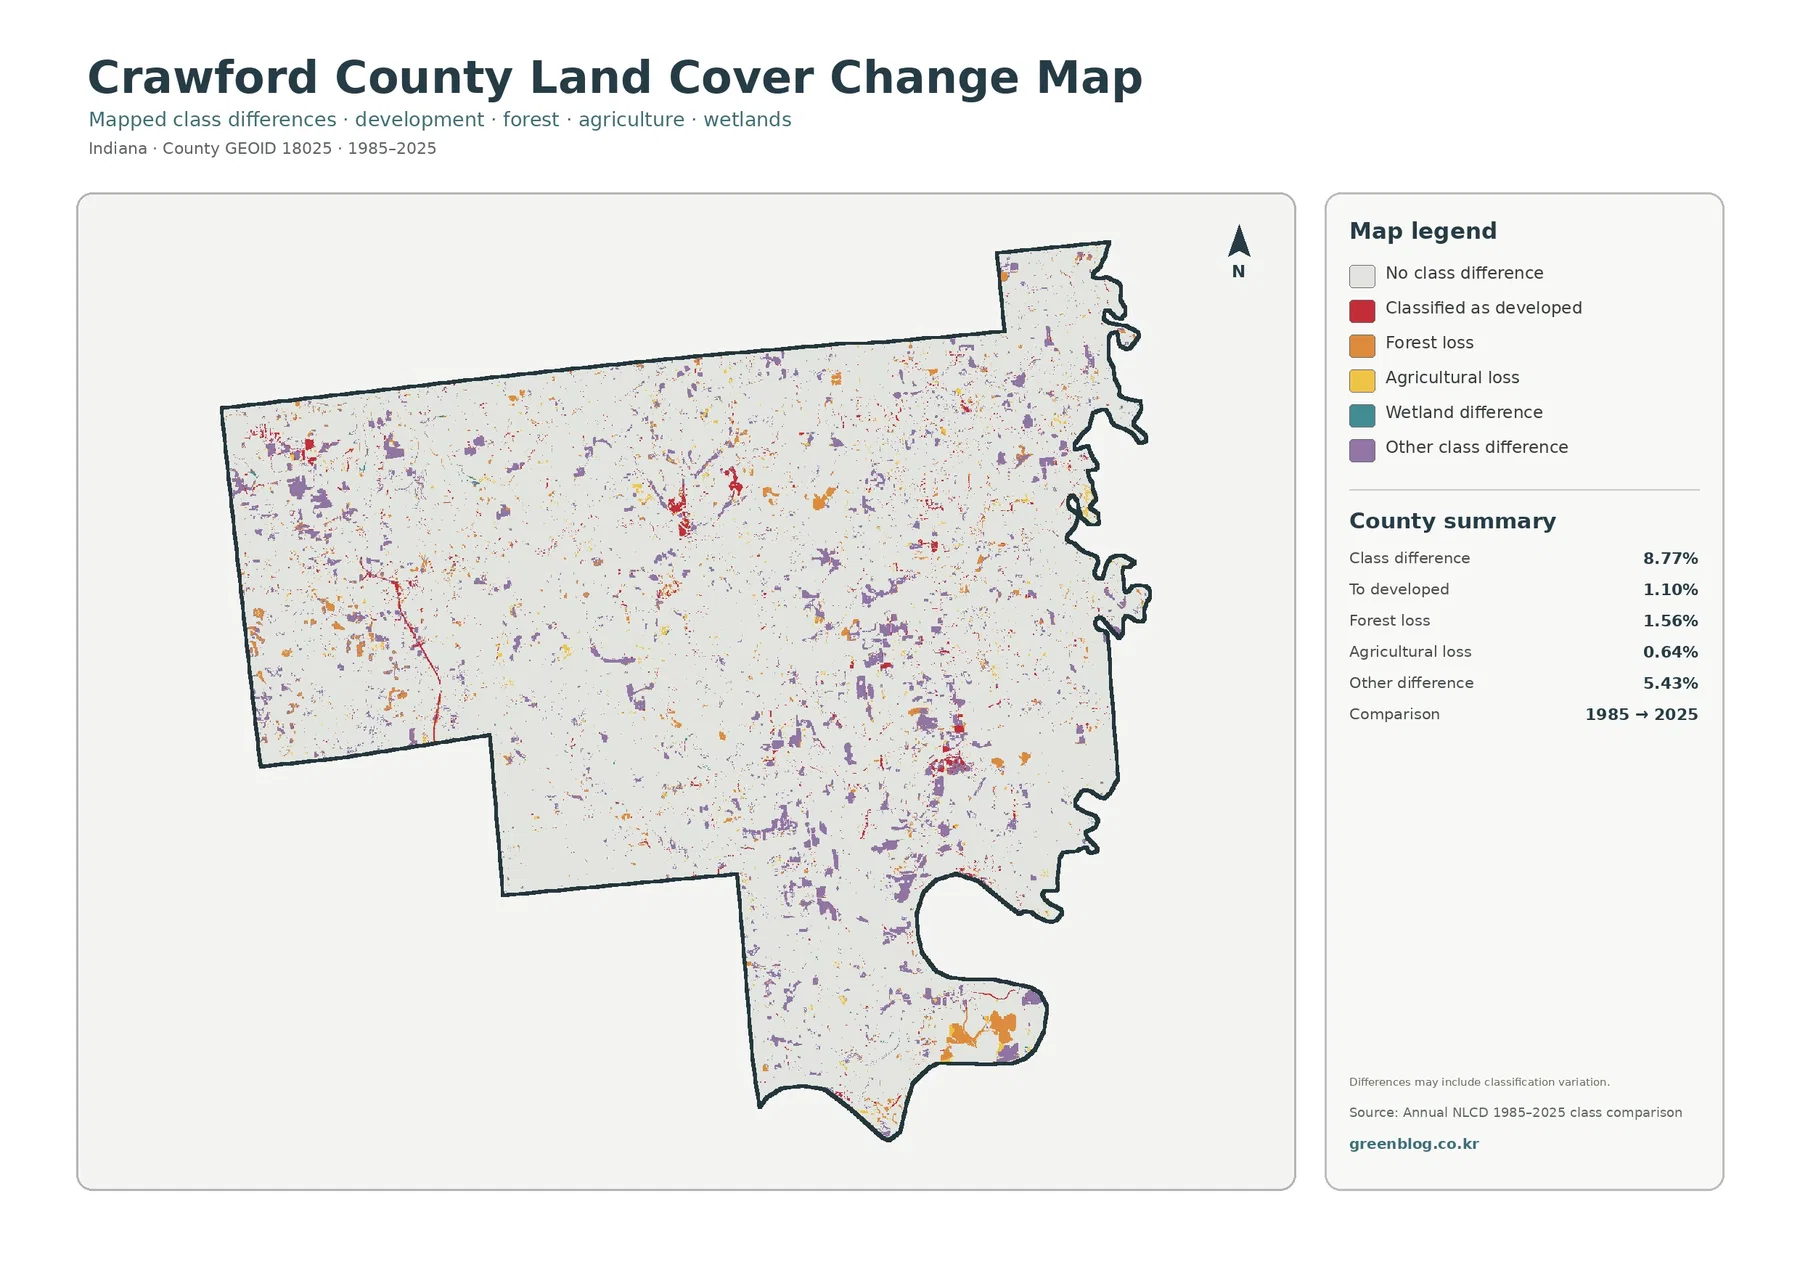
The endpoint comparison reports 8.77% total class difference between 1985 and 2025. The listed components are 1.10% classified as developed, 1.56% forest loss, 0.64% agricultural loss, and 5.43% other class difference. Wetland difference appears in the legend but does not have a separate percentage in the summary, so it should not be calculated as a residual and presented as an official figure.
The largest listed component is other class difference at 5.43%. That matters because the 8.77% total should not be described as development or damage. A cell can receive a different class because the surface actually changed, but mixed pixels, seasonal vegetation, water conditions, or classification variation may also contribute. The map identifies where endpoint labels differ; it does not identify the cause of each difference.
Orange forest-loss cells and red developed-conversion cells are scattered across the county, with somewhat larger concentrations in a few places. Even so, the current map still shows forest as the dominant cover by a wide margin. The comparison cannot tell whether forest declined steadily over four decades, changed and recovered, or shifted at a particular date. Intermediate annual data, aerial photography, timber records, permits, or other local evidence would be needed to answer those questions.
The same caution applies to the 1.10% classified as developed. A red change cell does not provide a construction year or project name. It only means that the 2025 endpoint received a developed class after a different class in 1985. For site-specific history, the change map is a screening layer rather than a substitute for dated imagery and local records.
Forest and farmland become easier to compare when built surfaces fade
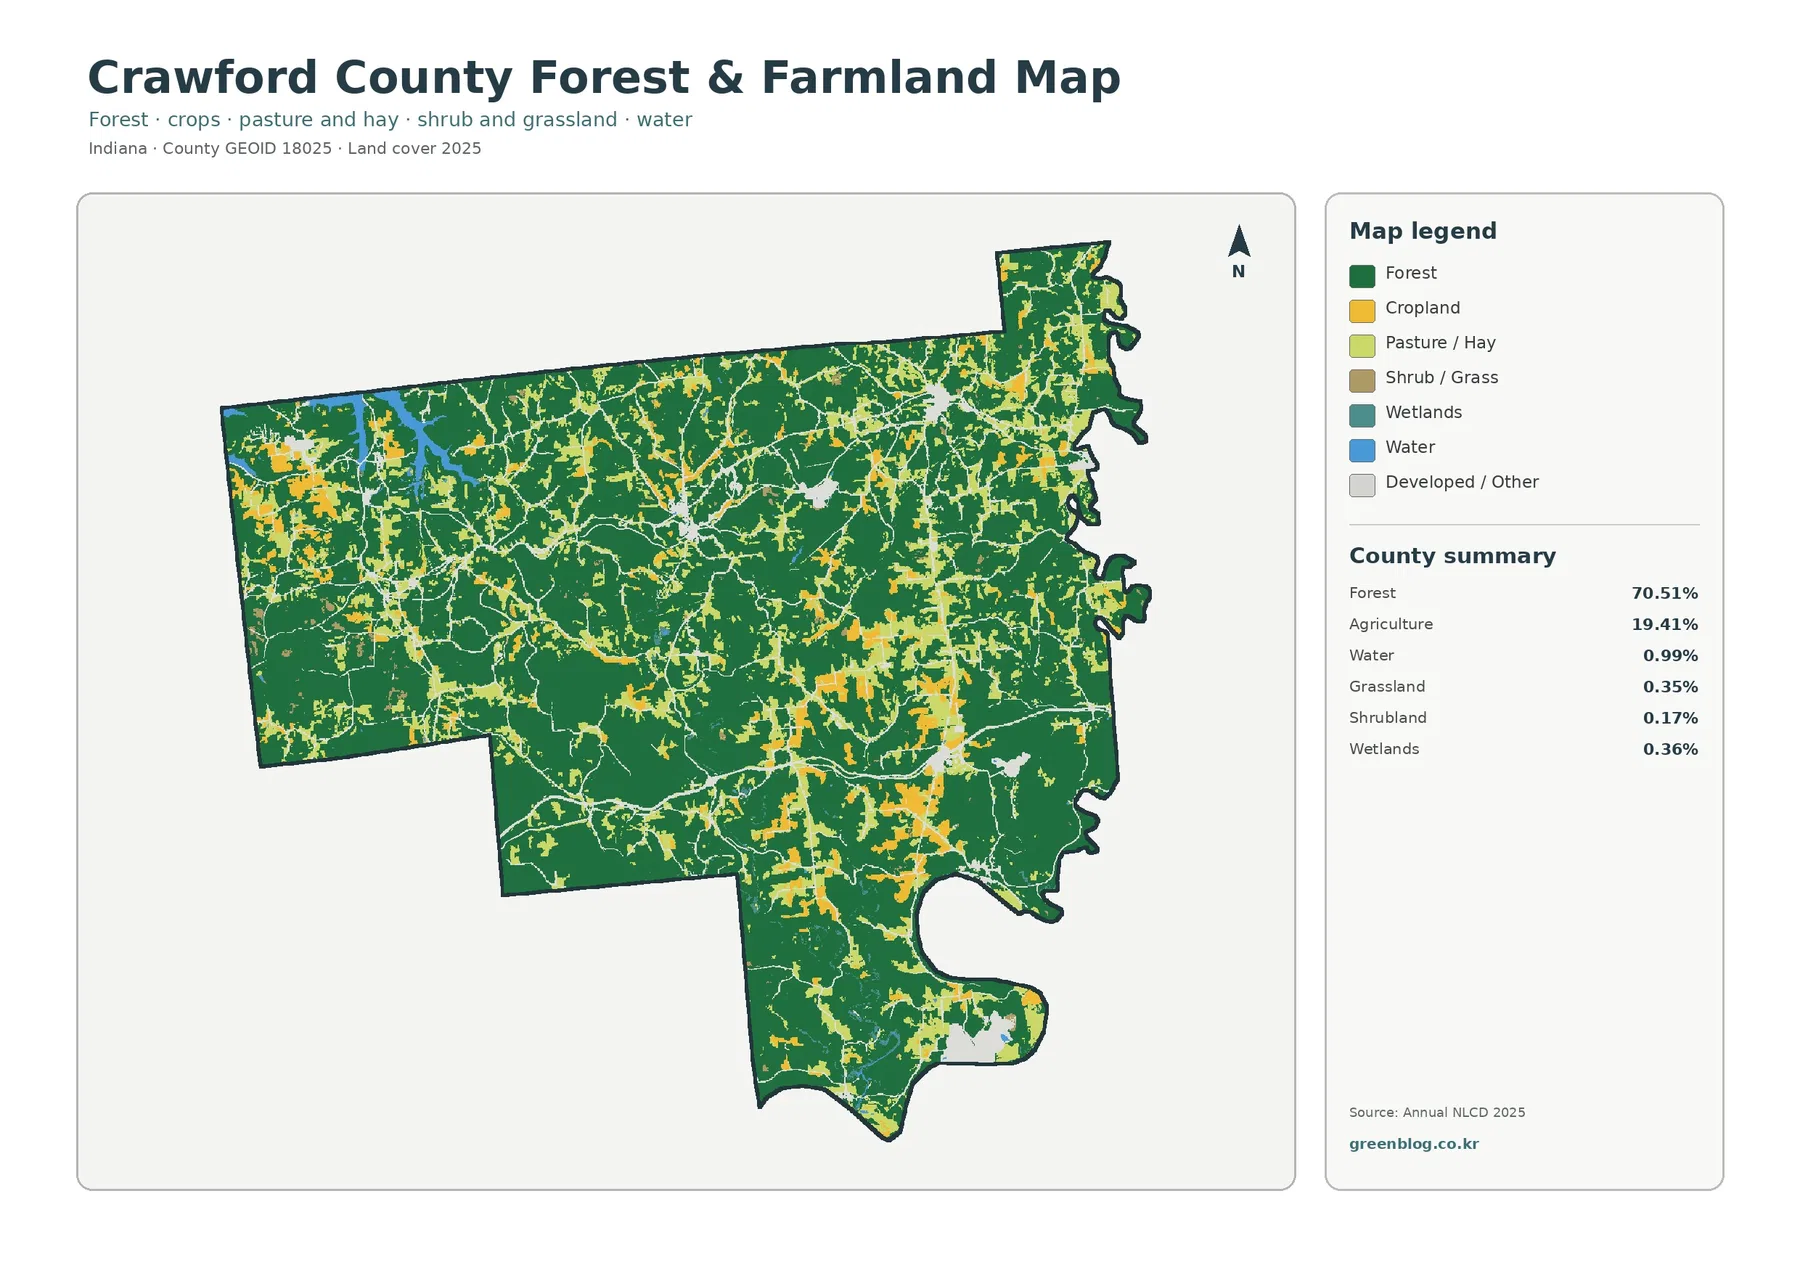
The vegetation-focused view makes the 70.51% forest share especially clear. Large dark-green areas connect across the central and western portions of Crawford County and continue through much of the south and east. Yellow cropland appears in irregular openings, while lighter pasture and hay cover adds smaller pieces around some of those openings. The result is a landscape where agriculture is present throughout the county but repeatedly enclosed or separated by forest.
The boundaries between farm and forest are often irregular rather than straight. That pattern is useful for understanding the county at a broad scale, but it should not be mistaken for surveyed field boundaries. Annual NLCD uses approximately 30-meter cells. Narrow tree lines, small farm lanes, ditches, houses, and mixed edges can be absorbed into whichever class is dominant within a cell.
Indiana DNR provides a useful local reference for why forest is such an important part of the county. Harrison-Crawford State Forest extends across eastern Crawford County and western Harrison County and contains about 24,000 acres of rugged hardwood forest. The land-cover map does not show the state forest ownership boundary, however. Dark-green cells elsewhere in the county may be private forest, federal land, or other wooded property, so public-land questions require the agency’s property map.
Purdue Extension Crawford County also maintains Agriculture and Natural Resources programs for local residents. Those programs provide county-specific context for farming and land management, but they are separate from the 19.41% agricultural land-cover statistic. The map percentage describes classified surface cover in 2025; it does not report crop production, farm income, farm count, or acreage by commodity.
Only a small share of the county is highly impervious
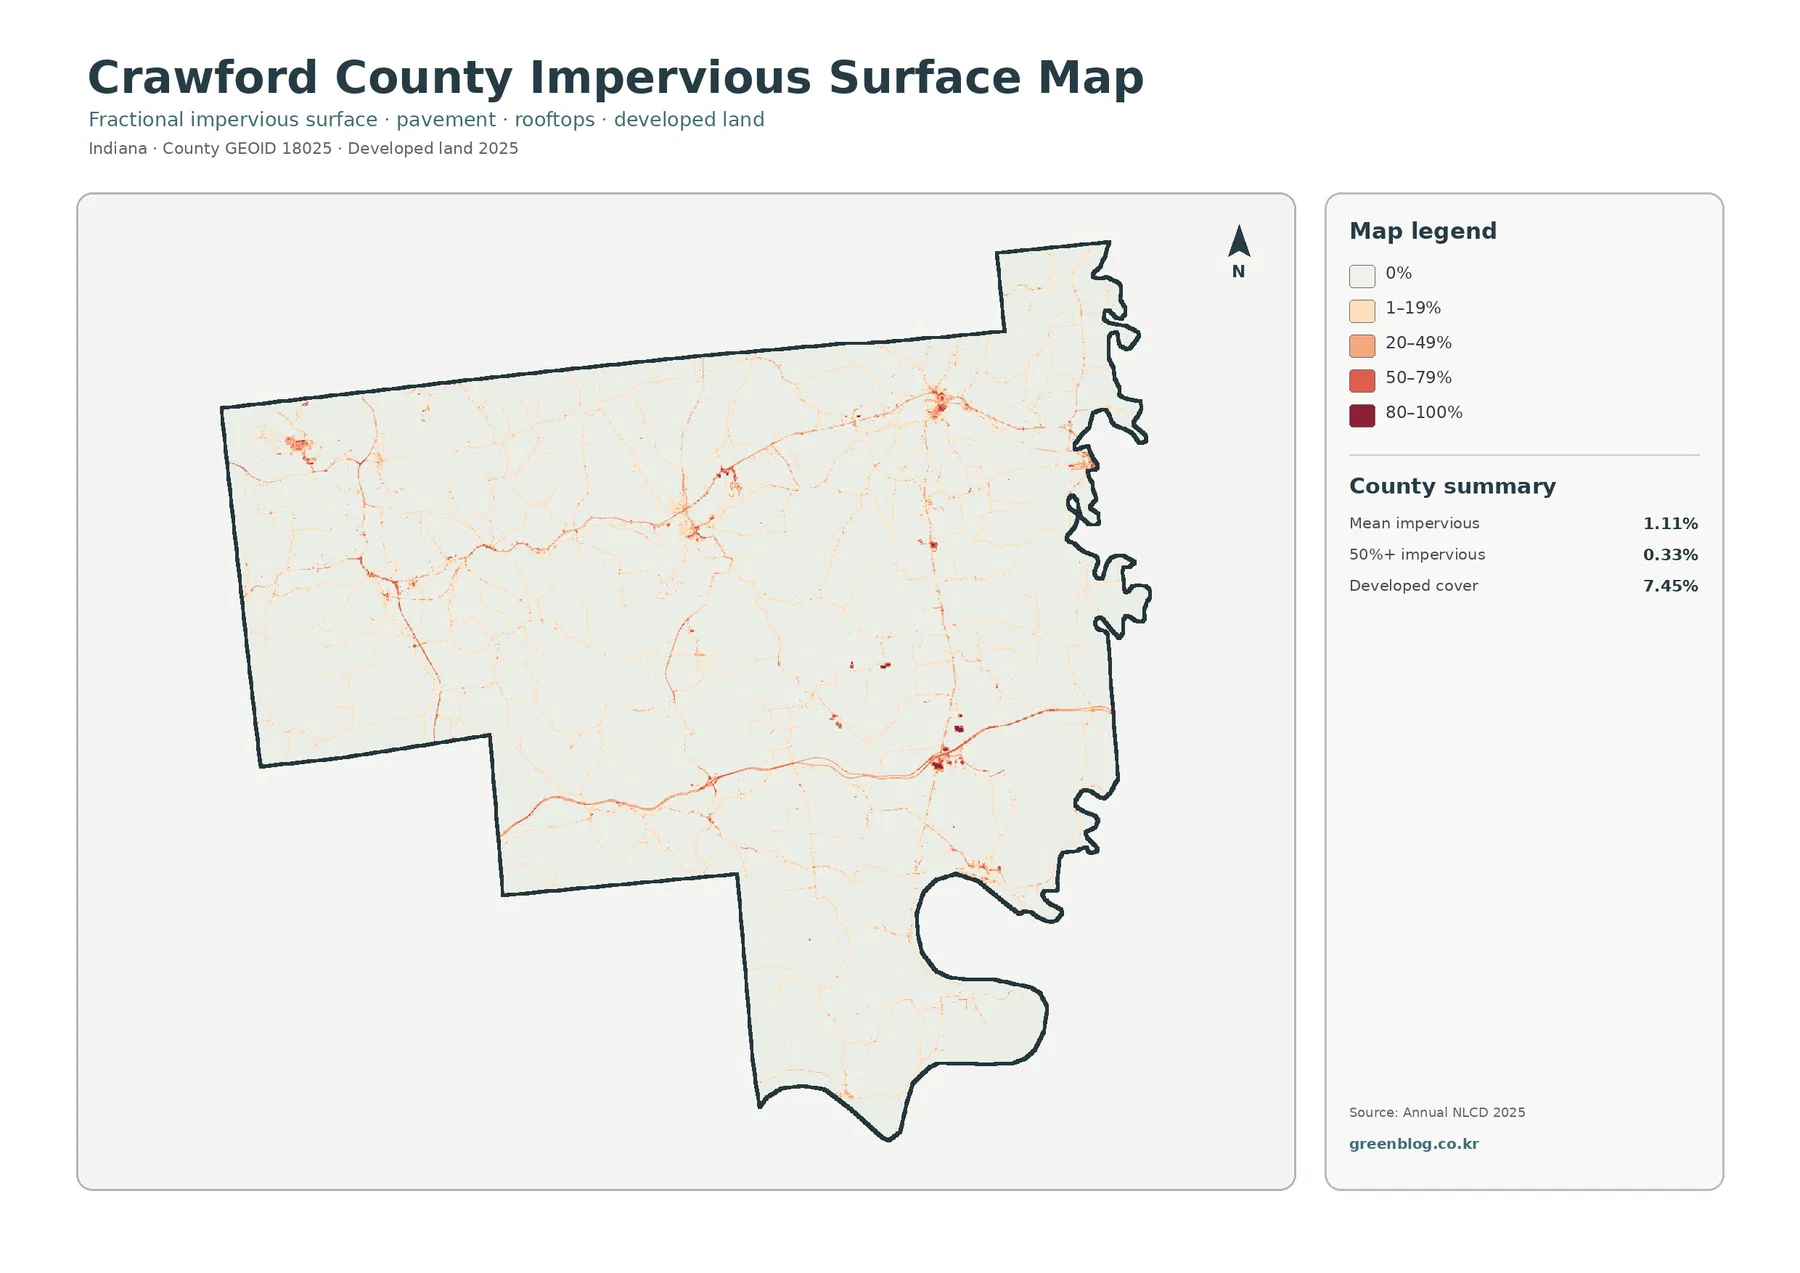
Mean impervious cover is 1.11%, and only 0.33% of the county is mapped at 50% impervious or higher. Those figures are much lower than the 7.45% developed land-cover share. The difference is expected: developed classes can contain lawns, trees, bare soil, and other permeable surfaces around buildings and roads, while impervious cover isolates rooftops, pavement, parking areas, and similar hard materials.
Most of the impervious map is near white, reflecting the county’s large forested and rural area. Small darker clusters appear in the northwest, northeast, center, and southeast, and fine lines connect many of them. Those lines may resemble roads, but no road names or traffic information are printed on the preview. A transportation map is required before attaching a route name or functional class to a specific line.
A countywide mean of 1.11% can hide strong local contrast. A town center may have a much higher hard-surface percentage than the surrounding forest, yet the county average remains low because the rural area is so extensive. For development-intensity comparisons, the location and continuity of darker cells are therefore as important as the average itself.
Impervious cover can also be useful when framing runoff questions, but it is not a flood-risk map. Rainfall, soil, slope, drainage, stream capacity, wetlands, and elevation all affect runoff and flooding. The impervious layer can identify where hard surfaces are concentrated; it cannot determine whether a particular property will flood.
Ohio River and local waterways need a hydrography layer for exact identification
Indiana’s navigable-waterway roster lists the Ohio River, Big Blue River, Little Blue River, Dry Run Creek, and Mill Creek for Crawford County. The state historical marker for Leavenworth also describes the town’s history as an Ohio River port. Those sources provide reliable local water context for the county’s irregular southern and eastern edge, but the land-cover previews themselves do not print waterway names.
That distinction matters when interpreting the blue cells. A visible channel or reservoir shape can be compared with official hydrography, yet it should not receive a name solely from its appearance. Indiana DNR maintains a separate Patoka Lake property page and maps for the large reservoir region. Those materials are better for recreation sites, access points, and exact property details; the land-cover image is better for comparing water with surrounding forest and agricultural openings.
Wetlands require the same separation. The 0.36% wetland class reflects a remotely sensed land-cover category, not a legal wetland determination or permit boundary. Likewise, a water cell is not automatically a navigable-waterway boundary. Regulatory, floodplain, and jurisdictional questions should use the current datasets and procedures from the responsible agencies.
How to choose a map without confusing the four measures
For a general county profile, start with the 2025 land-cover map because it puts forest, agriculture, development, water, and the smaller classes in one frame. It immediately communicates that Crawford County is forest-dominant. The forest-and-farmland view is the better second image when the question concerns agricultural openings, wooded continuity, or the way working land is distributed through a heavily forested county.
Use the impervious map when the subject is hard surface rather than the broader developed class. It explains why developed cover can be 7.45% even though mean impervious cover is only 1.11%. Use the 1985–2025 layer only after the current pattern is clear. That order reduces the chance that a reader will mistake red change cells for current developed land or interpret every difference cell as permanent loss.
Each product uses generalized raster cells rather than parcel polygons. Zooming in makes the cells larger on screen but does not create missing detail. A narrow road, tree line, small pond, clearing, and building can share a cell, and the assigned class is a simplified representation of that mixed surface. Property-level decisions therefore need higher-resolution imagery, current parcels, surveys, and sometimes field inspection.
The current map is tied to the supplied 2025 observation year. Construction, vegetation recovery, timber activity, farming changes, storms, or water conditions after that observation may not appear. The change layer is also an endpoint comparison, not a complete animation of every event from 1985 through 2025. Both are strongest when used as county-scale reference graphics rather than as final evidence for a site-specific decision.
Using the original JPG set for class, print, and county comparison
The four maps can support several different explanations without repeating the same image. A classroom lesson can compare a forest-dominant southern Indiana county with a farm-dominant county. A county profile can use the current land-cover image for the main overview and add the impervious image to show how limited the hard-surface footprint remains. A presentation about change can pair the current map with the endpoint-difference layer while clearly separating present cover from historical classification difference.
Each original JPG measures 2480 × 1754 pixels. The package does not mark the files as meeting an A3 high-resolution reference, so a test print is recommended before using them at large poster size. The WebP images on the page are convenient previews, while the JPGs in the ZIP are the better choice for saving, inserting into documents, or testing print layouts.
These maps should not be treated as zoning maps, parcel surveys, forest-ownership maps, flood insurance products, wetland-jurisdiction maps, or engineering plans. For example, Harrison-Crawford State Forest has an official DNR property boundary that is not drawn here. Keeping each dataset within its purpose makes the land-cover graphics more useful and avoids giving the colors legal meaning they do not have.
Frequently Asked Questions
Does the 70.51% forest share mean most of Crawford County is public forest?
No. The 70.51% figure is the share of 2025 land-cover cells classified as forest, regardless of ownership. Harrison-Crawford State Forest is one important public forest in the county, but the map does not draw ownership boundaries. Private woodland and other forested property can appear in the same dark-green class.
Why is developed cover 7.45% when mean impervious cover is only 1.11%?
Developed land-cover classes can contain vegetation and other permeable surfaces around homes, roads, and facilities. Impervious cover isolates hard surfaces such as roofs, pavement, and parking areas, so its countywide mean is much lower in a county with extensive forest and rural land.
Is the 8.77% 1985–2025 class difference the amount of land that was damaged?
No. It is the share of cells that received different endpoint classifications. The listed forest-loss component is 1.56%, developed conversion is 1.10%, agricultural loss is 0.64%, and other class difference is 5.43%. Determining the actual cause and timing of a change requires intermediate imagery and local records.
Sources and Reference Data
- MRLC Annual NLCD Data – official access point for annual land-cover and comparison products
- USGS Annual NLCD Land Cover Classification – definitions and guidance for land-cover classes and the 30-meter raster framework
- U.S. Census Bureau TIGER/Line Shapefiles – official county-boundary reference for Crawford County
- Indiana DNR – Harrison-Crawford State Forest – official information on the state forest extending into eastern Crawford County
- Purdue Extension Crawford County – local Agriculture and Natural Resources programs and county extension information
- Indiana NRC – Navigable Waterways by County – official county roster including the Ohio River and other Crawford County waterways
Map File Information
The ZIP contains four original JPG maps for comparing Crawford County’s forest-dominant 2025 cover, agricultural openings, hard surfaces, and 1985–2025 class differences.
- Included Files: Four original JPG land-cover maps
- File Type: JPG files in one ZIP archive
- Intended Use: Printing, education, presentations, and map-based projects
Related Maps
- Adams County Indiana Land Cover Map
- Allen County Indiana Land Cover Map
- Bartholomew County Indiana Land Cover Map
Green Map creates custom-edited map images using open geographic data sources such as geoBoundaries, Natural Earth, OpenStreetMap, and government open data. These maps are edited visual materials, not raw data files, and are provided for education, documents, presentations, and graphic reference.