Riverside County stretches across a landscape where developed land is highly concentrated rather than evenly spread. The 2025 map shows a large urbanized cluster in the west, a second developed belt through the Coachella Valley, and a much more sparsely developed eastern half dominated by shrubland. Shrubland accounts for 68.01% of the county, while developed cover is 11.16%. The four maps on this page separate current land cover, forest and farmland, impervious surface, and mapped class differences between 1985 and 2025.
The WebP images are quick previews. A download box farther down the page provides the four original JPG maps together in one ZIP. Land cover describes what is physically covering the ground in the mapped imagery—such as shrub vegetation, grass, forest, crops, water, wetlands, barren ground, or developed surfaces. It does not show parcel ownership, zoning, permitted land use, or whether a site can be developed.
Table of Contents
Impervious surface separates the western city cluster from the open desert most clearly
The countywide mean impervious surface is 4.36%, and 4.12% of the county is mapped at 50% or greater imperviousness. Those averages are modest compared with a dense urban county, but they hide strong local concentrations. The western end contains the largest continuous areas of medium and high impervious values, corresponding broadly to the Riverside–Corona–Moreno Valley side of the county. Darker cells are much less common across the central and eastern desert.
A second concentration runs through the Coachella Valley. On the impervious map it appears as a narrower band of orange and red cells set within a much larger pale desert background. This makes the Palm Springs-to-Indio area stand out even though it occupies only a small share of the county’s total land area. Farther east, most cells return to very low impervious values, with only small local clusters.
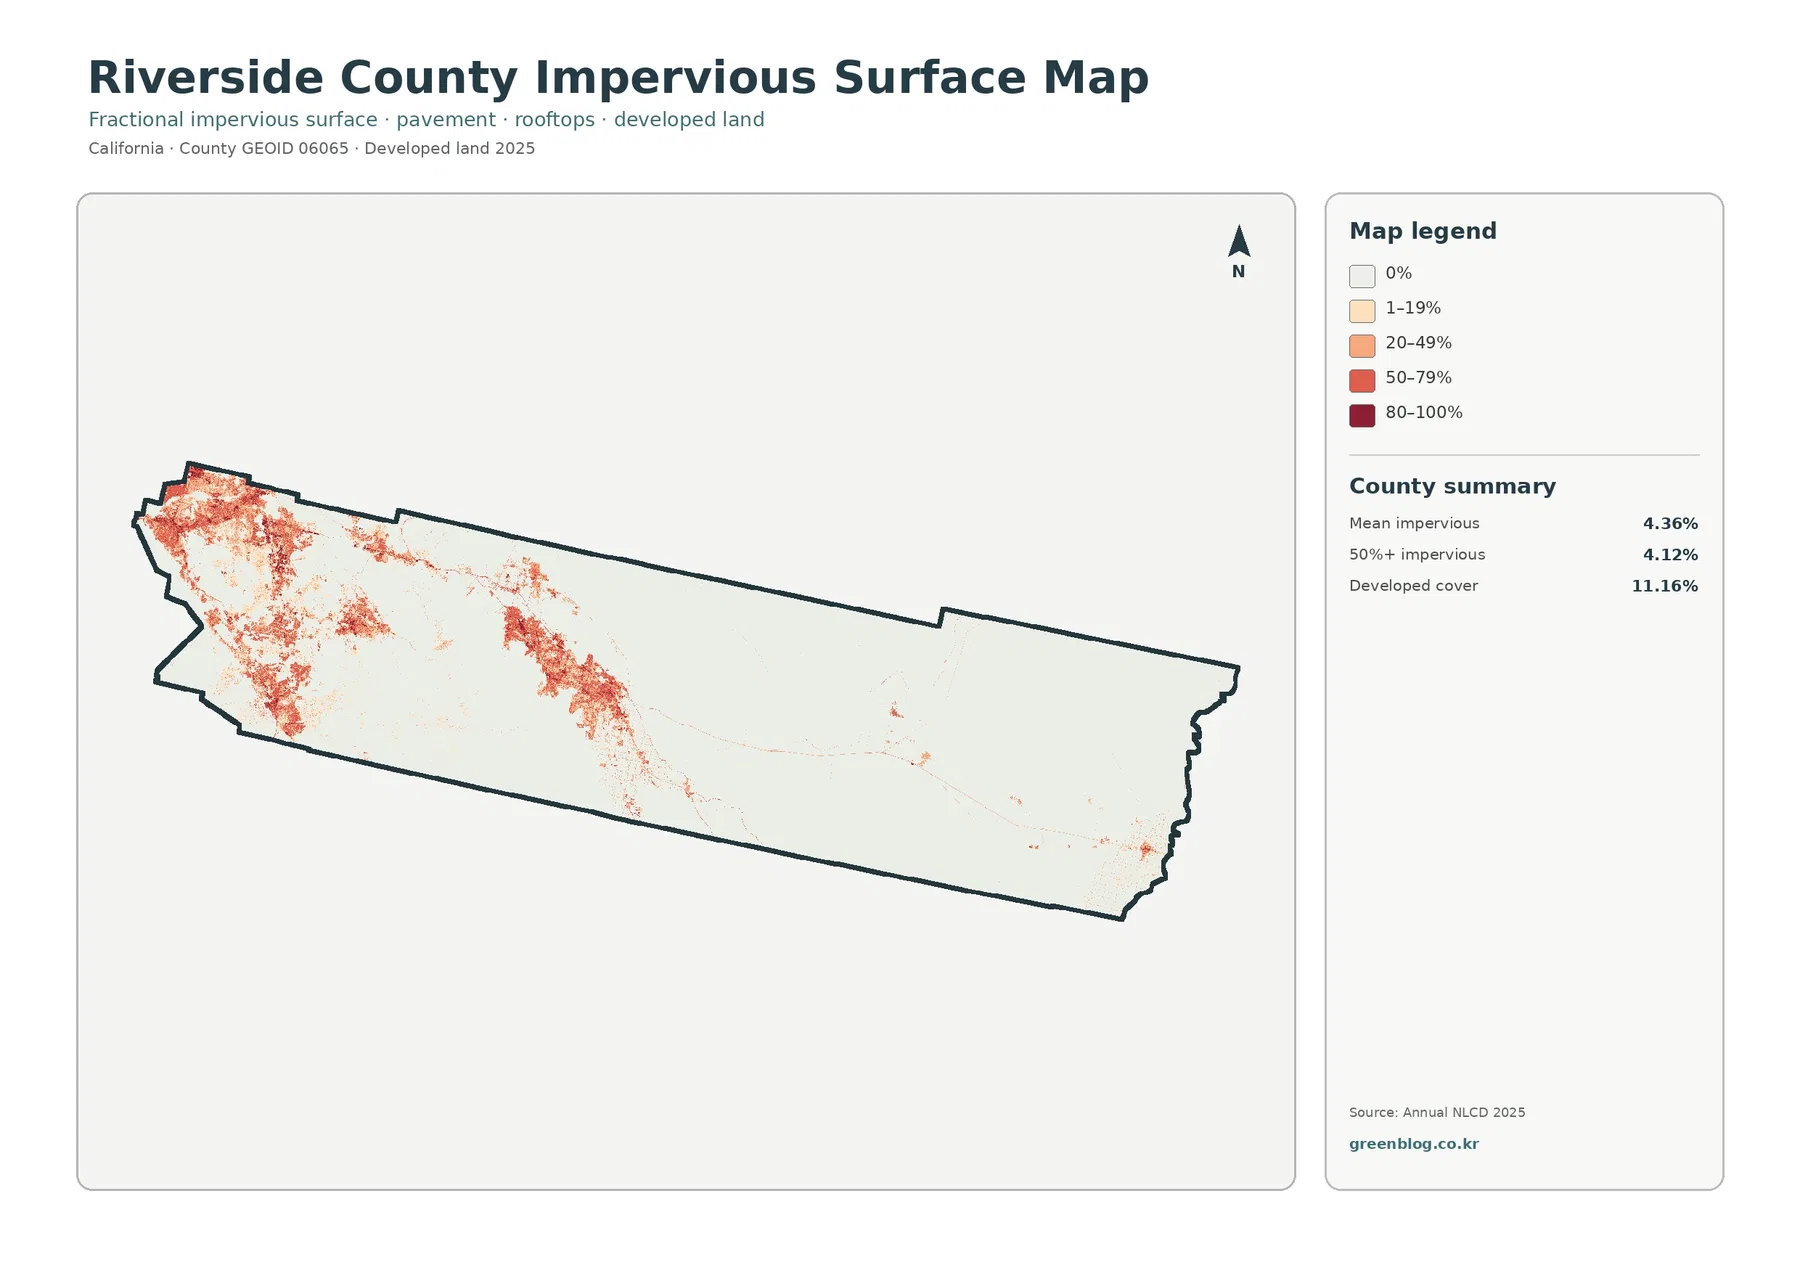
Developed cover and impervious surface should not be treated as interchangeable statistics. Developed land is a broader land-cover class and totals 11.16% in the 2025 summary. A developed cell can contain lawns, trees, exposed soil, and other permeable surfaces in addition to buildings and pavement. Imperviousness estimates the hard-surface fraction within the landscape, so its countywide mean is expected to be lower.
High imperviousness also does not by itself identify a flood-risk area. Drainage depends on rainfall, slope, soil, channels, stormwater infrastructure, and many other conditions. This map is best used to compare where hard surfaces are concentrated, not to replace a floodplain or drainage study.
The current land-cover map is dominated by 68.01% shrubland
Shrubland is the largest class by a wide margin at 68.01%. Barren land is 8.44%, grassland 5.08%, agriculture 3.62%, and forest 1.89%. The forest-and-farmland summary also lists water at 1.21% and wetlands at 0.58%. Together, these values describe a county in which desert and semi-desert cover occupies most of the central and eastern area while urban and agricultural classes are concentrated in a few corridors and valleys.
The map makes the east-west contrast especially easy to see. Broad tan-brown shrubland fills much of the middle and east, with gray barren patches mixed through desert terrain. The western end contains a far more complex mosaic of developed land, grass, shrubland, small water bodies, and isolated forest patches. A long developed band reappears in the south-central part of the county through the Coachella Valley.
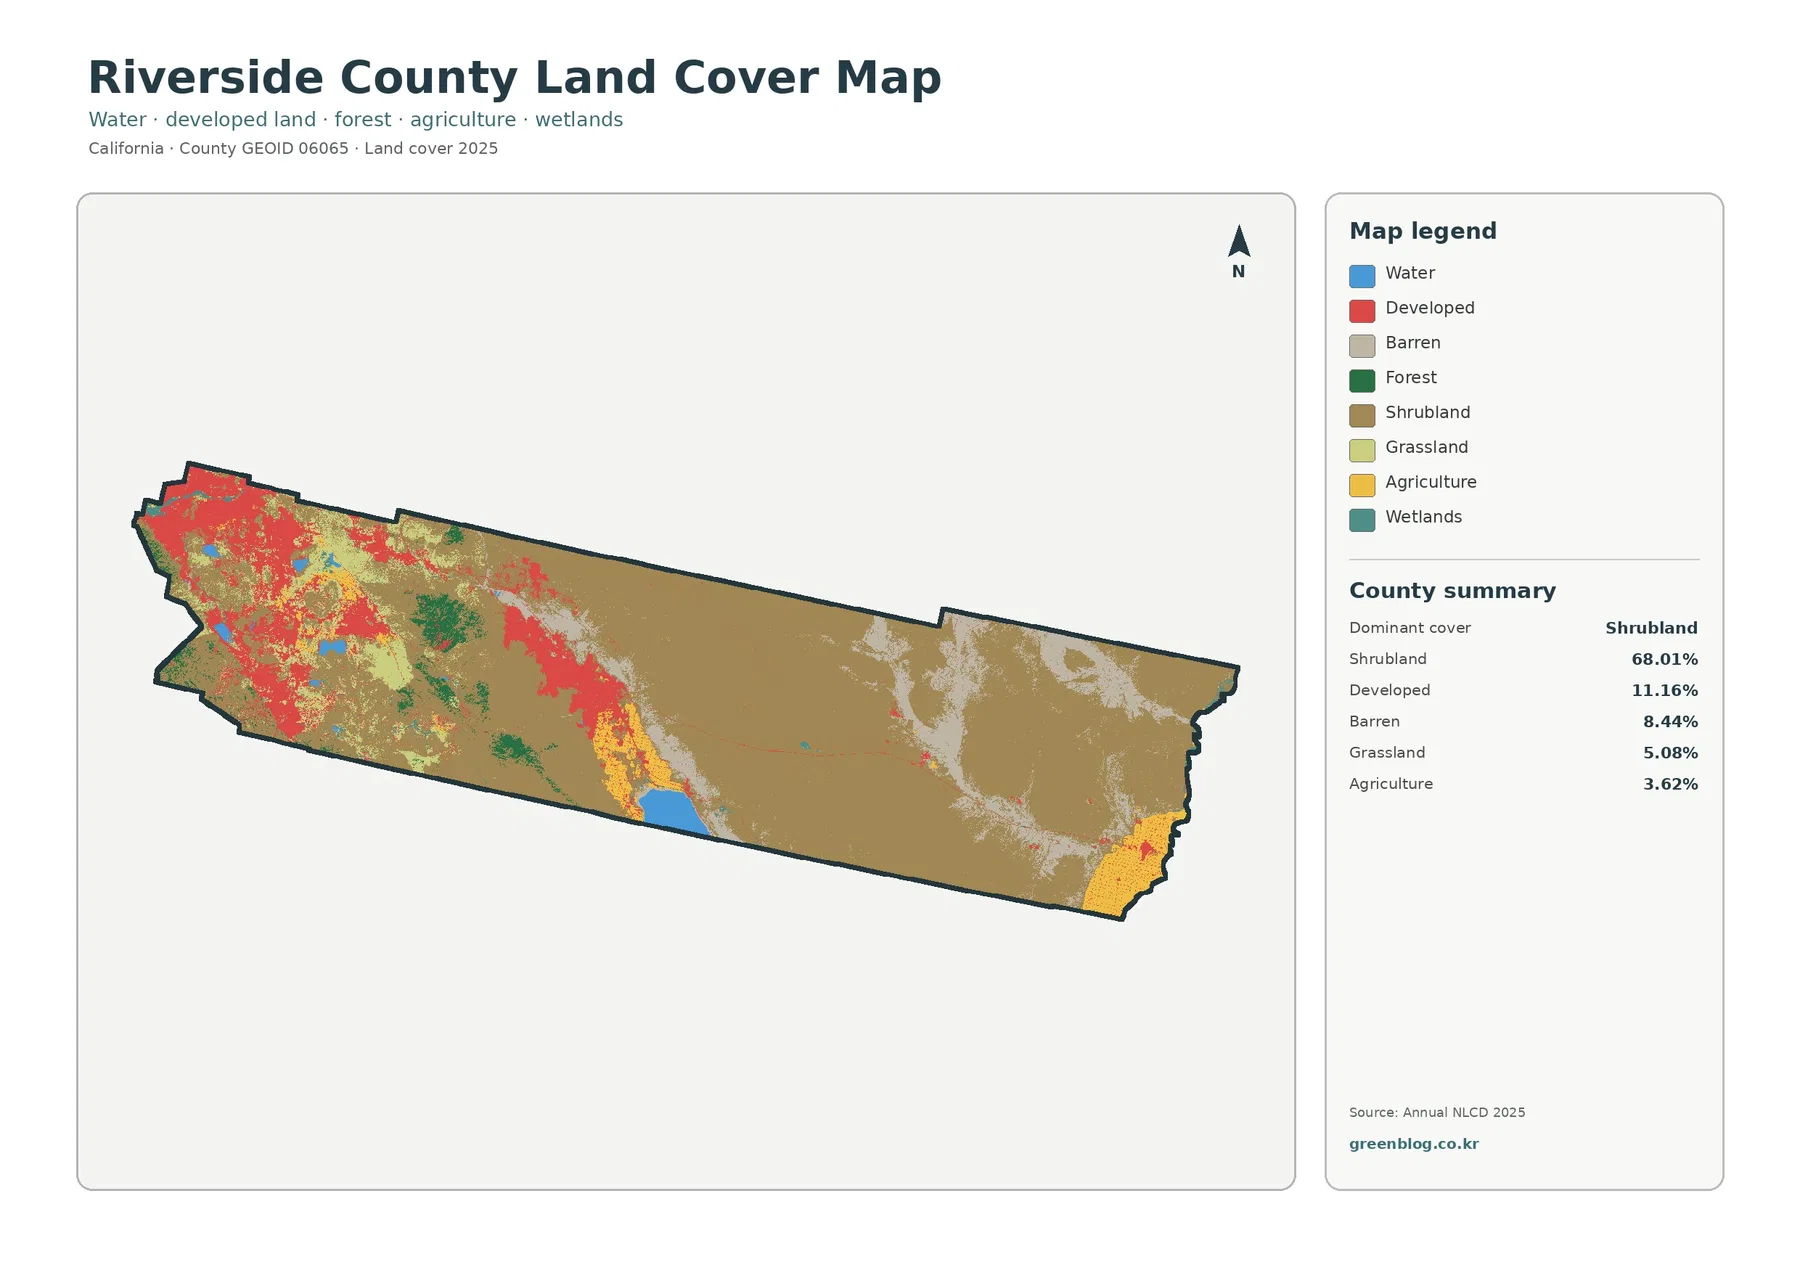
The 68.01% shrubland figure should not be interpreted as unused or vacant land. It is a surface-cover classification. A shrubland cell may fall on public land, private land, conserved habitat, military land, or an area governed by a particular planning designation. Riverside County’s General Plan addresses land use and open space separately, so a planning map is required for legal or policy questions.
Barren land is also a physical cover category rather than a statement about value or development potential. In this map it forms irregular light-gray areas within the larger shrub-dominated desert. Some barren cells are associated with naturally sparse terrain, but the map alone does not identify the process that produced each patch.
Forest is scarce countywide but forms recognizable mountain clusters
Forest covers only 1.89% of Riverside County in the 2025 summary. That small percentage does not mean trees are spread uniformly at a very low density. The forest-and-farmland map shows green clusters concentrated in western and central mountain areas, while the broad eastern desert has very little mapped forest. A countywide percentage therefore needs to be read together with location.
The simplified forest-and-farmland view is useful because developed and miscellaneous cover is muted. Green forest patches become easier to separate from the much larger shrub-and-grass background. In the western half, some forest lies close to developed areas; farther east, shrubland and barren cover dominate so strongly that forest becomes rare.
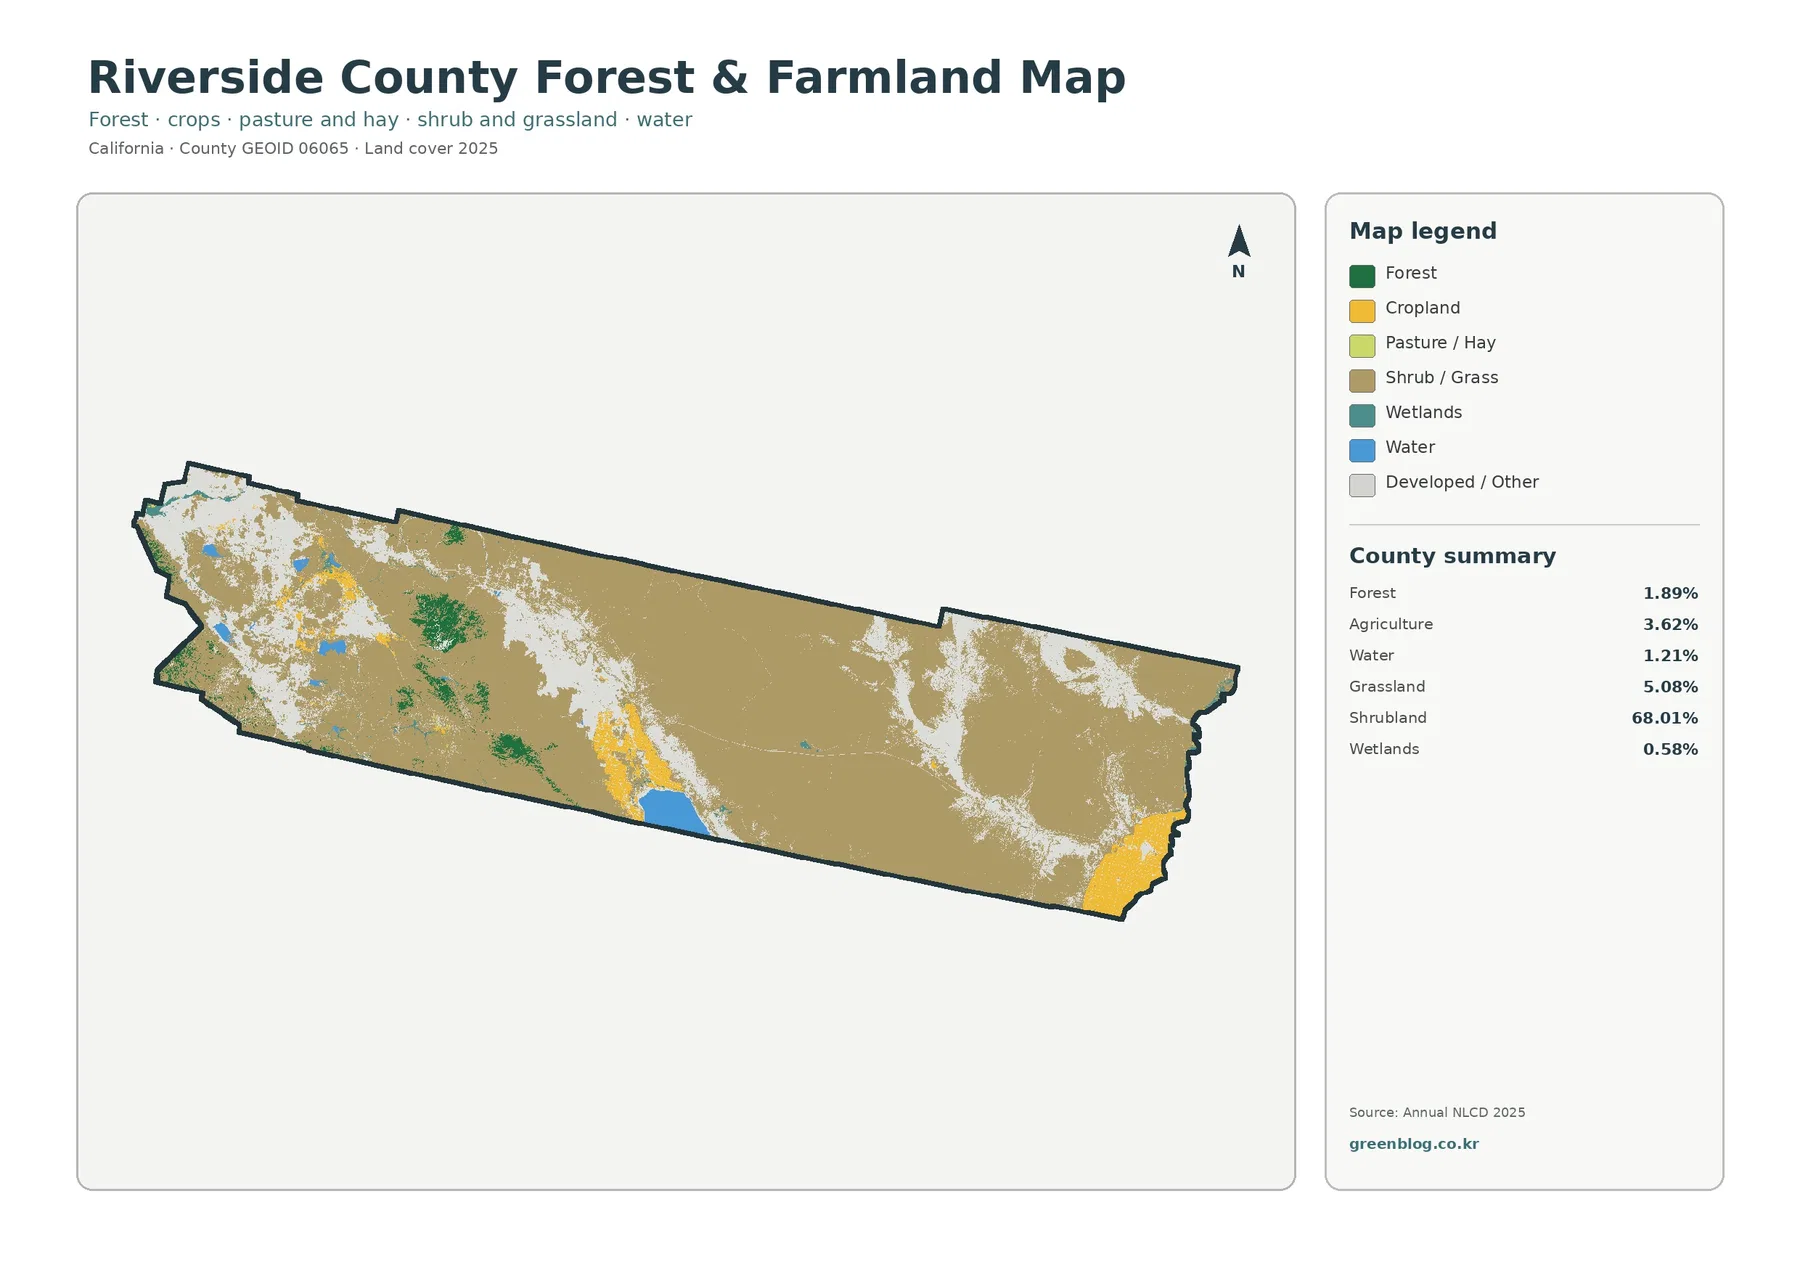
A green forest cell is not an ownership boundary. It does not mean that the cell is part of a national forest, a county preserve, or another protected unit. It indicates that tree cover was the mapped land-cover class for that raster cell. Ownership and management require separate public-land or parcel data.
Agriculture appears in several distinct valleys instead of one countywide farm belt
Agriculture accounts for 3.62% of the county, yet its yellow map pattern is conspicuous because it is concentrated. A large agricultural zone appears in the southeastern Coachella Valley near the northern edge of the Salton Sea. Another strong patch sits at the far eastern end of the county around the Blythe and Palo Verde Valley area. Smaller agricultural areas also occur in the western half.
This distribution matches the broader county agricultural geography documented by the Riverside County Agricultural Commissioner, whose publications include district material for the Riverside/Corona area, San Jacinto/Temecula Valley, Coachella Valley, and Palo Verde Valley. The land-cover percentage is not a production statistic, however. It measures surface classification in the 2025 map rather than crop value, harvested acreage, or legal farmland designation.
In the Coachella Valley, developed and agricultural cover sit close together. The developed belt is stronger toward the northwest, while agricultural cover becomes more prominent toward the southeast and near the Salton Sea. The Coachella Valley Water District provides useful background on irrigation in this agricultural region, but the land-cover map does not show canals, water-right boundaries, or irrigation service areas.
At the far eastern end, yellow agricultural cover stands out sharply against surrounding shrubland and barren terrain. This makes the Palo Verde Valley area easy to locate on a countywide view even without city labels. The pattern is useful for presentation and regional comparison, but individual yellow cells should not be treated as parcel-level farm boundaries.
Water and wetlands occupy small percentages but provide strong geographic reference points
Water is 1.21% and wetlands are 0.58% in the forest-and-farmland summary. The largest blue feature along the south-central boundary is associated with the northern part of the Salton Sea. Several smaller water bodies are visible in the west. Because the county is otherwise dominated by shrub and barren cover, these blue areas provide useful landmarks for orienting the other classes.
Wetlands appear as small teal patches and are easier to miss at the full-county scale. They are best examined by zooming in around water edges and low-lying areas. A mapped wetland cell is a land-cover classification, not a regulatory wetland determination. Project permitting or jurisdictional questions require the appropriate field and agency information.
For watershed or environmental-education work, compare the same location across the general land-cover and forest-and-farmland maps. One shows the full developed-versus-natural pattern, while the other reduces visual competition and makes water, wetlands, forest, agriculture, and shrub-grass cover easier to compare.
The 1985–2025 map shows 17.22% class difference, including 5.58% mapped to developed
The change map compares broad land-cover classes at two endpoints, 1985 and 2025. The summary reports class differences across 17.22% of the county. Cells mapped to developed account for 5.58%, forest-loss category cells for 1.20%, agricultural-loss cells for 1.24%, and other class differences for 9.10%. These values are different from the current 2025 cover percentages because they describe endpoint differences rather than current area.
Red cells classified as developed are especially visible across the western urban area and along the Coachella Valley. Their distribution partly overlaps places that now show stronger impervious surface, but the two maps answer different questions. The change map identifies a difference between endpoint classes; the impervious map estimates hard-surface fraction in 2025.
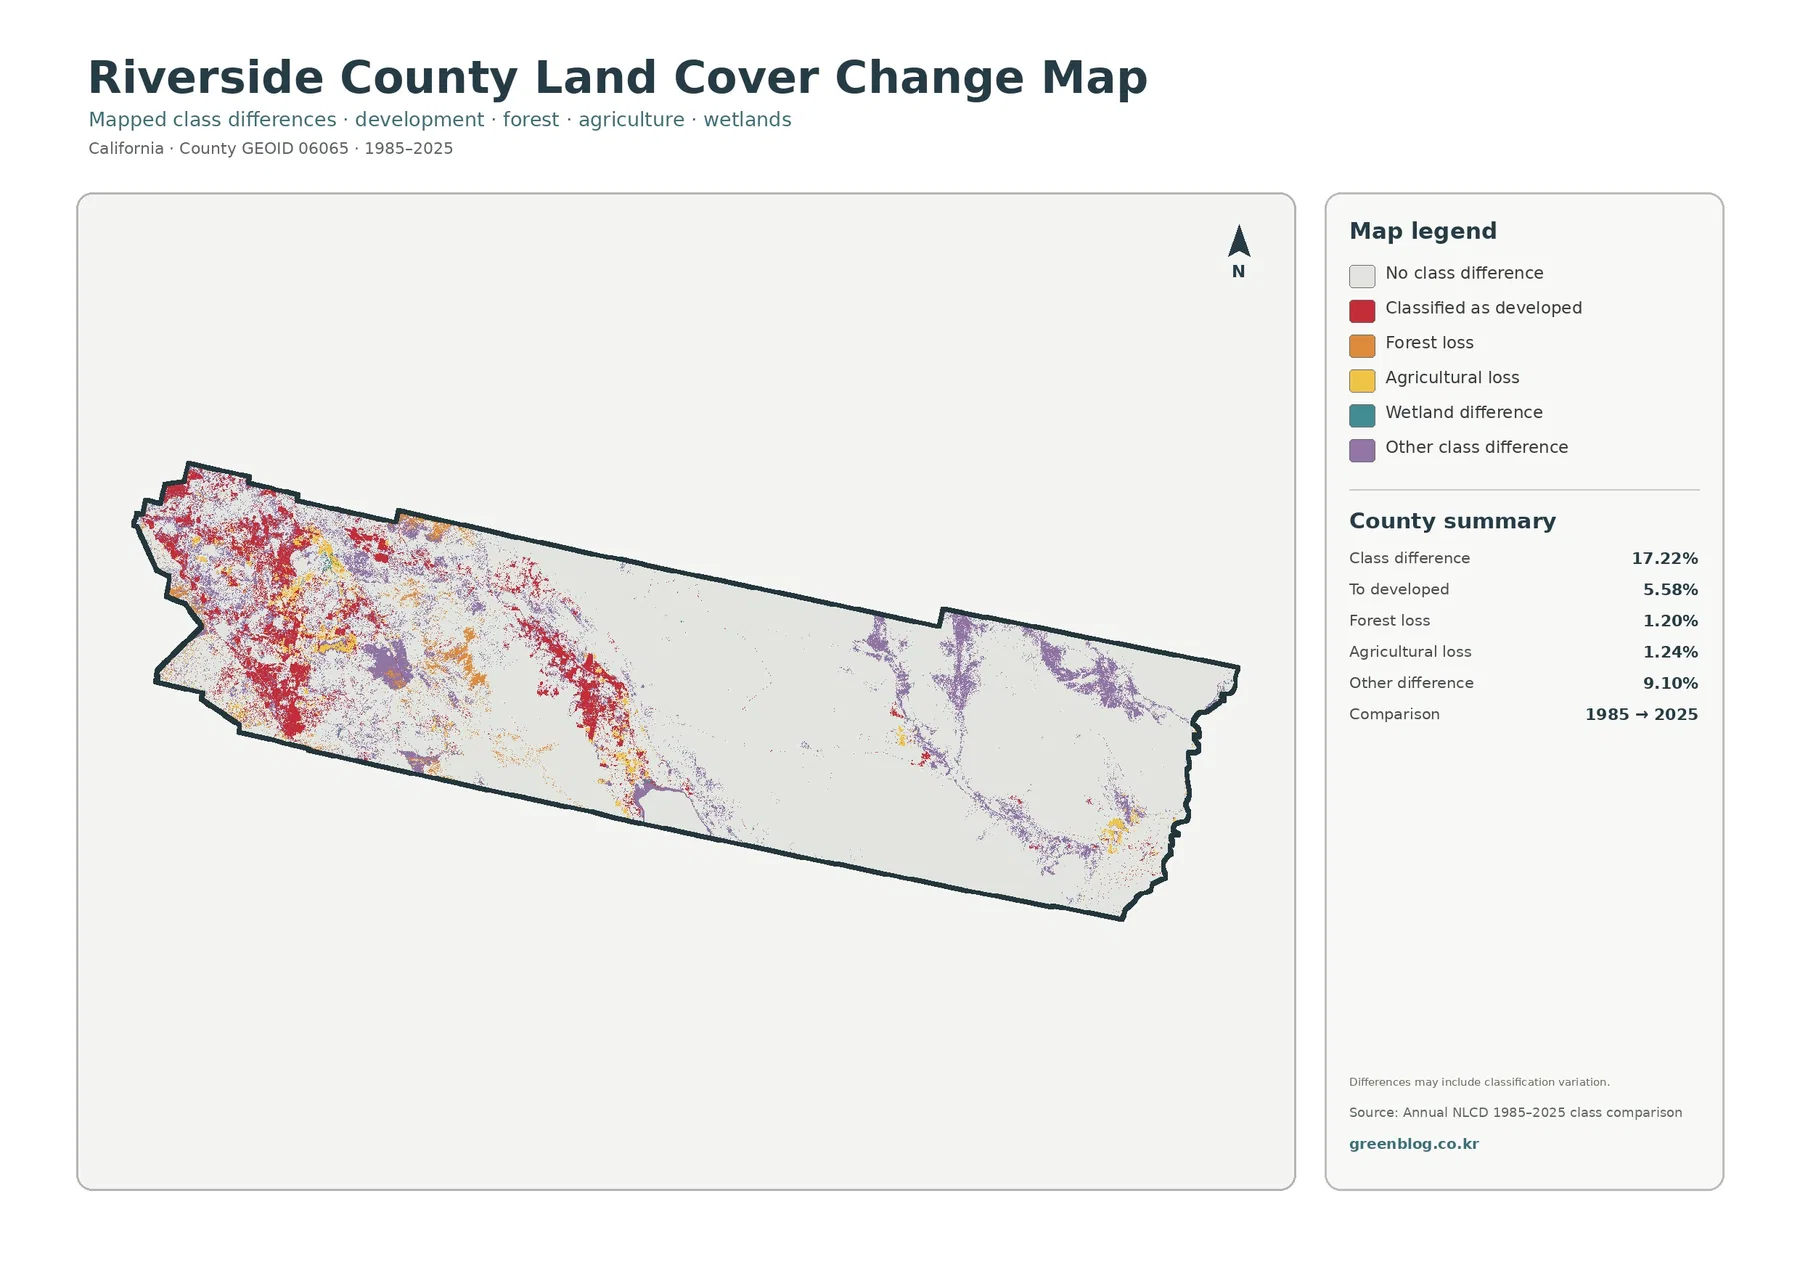
Purple “other difference” cells are widespread in parts of the central and eastern desert. The legend does not assign one single process to those cells, so they should not be labeled as a specific land-use conversion without additional evidence. Intermediate Annual NLCD years, aerial imagery, and local records are better tools for investigating why a particular location changed class.
The map itself warns that differences may include classification variation. Seasonal vegetation condition, mixed pixels, image conditions, and classification methods can move a cell between broad classes even when the real-world change is subtle. A white cell also does not prove that nothing happened during the forty-year period; it means the two endpoint classes match in this comparison.
A practical reading order keeps current cover separate from mapped change
Start with the current land-cover map and locate the county’s dominant shrubland. Then identify the western developed cluster, the Coachella Valley developed belt, the agricultural areas near the Salton Sea and at the eastern end, and the small forest concentrations. Once those features are familiar, the other maps become easier to interpret because each one removes or emphasizes a different part of the same county.
Use the forest-and-farmland map when the question is about vegetation or agriculture. Use the impervious map when the question is where pavement and rooftops are concentrated. Only after those current conditions are clear should the 1985–2025 map be used to discuss class differences. This sequence helps prevent a change category from being mistaken for a current land-cover percentage.
For classroom or presentation use, pairing two maps is often more effective than showing all four at once. The general cover map plus impervious surface explains the contrast between urbanized and desert areas. The general cover map plus forest-and-farmland emphasizes agriculture and mountain vegetation. The current map plus the change map is the clearest pair for discussing endpoint differences.
Map File Information and JPG download guidance
The download ZIP contains four Riverside County JPG maps: the general 2025 land-cover map, the forest-and-farmland map, the impervious-surface/developed-land map, and the 1985–2025 land-cover-change map. They can be saved separately for reports, classroom materials, printed references, or slide presentations. Keeping the four images together also makes it easier to compare the same county boundary across different themes.
Keep the legend and date visible when placing the JPG maps into a document. The current land-cover, forest-and-farmland, and impervious maps use 2025 data, while the change map compares 1985 with 2025. Cropping away those labels can make later reuse confusing because the four maps describe different variables and, in the change map, a different time relationship.
These JPGs are finished reference graphics, not raw GIS datasets. They are appropriate when the goal is to illustrate broad county patterns, but they are not intended for measuring an exact parcel boundary or recalculating raster statistics. For analytical work, use the original Annual NLCD and boundary datasets listed in the sources.
Raster resolution and classification limits matter most along mixed edges
Annual NLCD land cover is raster data, with each cell assigned a representative class. At roughly 30-meter scale, a single cell can contain more than one real surface: shrubs and bare soil, houses and yards, cropland and irrigation features, or a road beside vegetation. The mapped class simplifies that mixture. Edges of urban areas, agricultural fields, small wetlands, and mountain vegetation are therefore more generalized than a parcel or site survey.
Imperviousness is also generalized at cell scale. A narrow road may share a cell with desert vegetation, and a low-density neighborhood may include substantial permeable ground around rooftops and streets. The 4.36% mean is useful for county-scale comparison, but it should not be used as the hard-surface percentage for an individual property.
Endpoint change adds another layer of uncertainty because it compares classifications from two years. The 17.22% class-difference figure is useful for finding areas worth further review, but it should not be reported as if every changed cell represents a permanent conversion. Intermediate-year data and local evidence are needed to establish timing and cause.
Finally, land cover is not land-use regulation. A shrubland cell is not automatically conservation land, a developed cell does not define a zoning district, and an agriculture cell is not proof of a legally designated farm parcel. Riverside County planning documents, parcel records, and resource maps answer those administrative questions.
Frequently Asked Questions
Why does western Riverside County look so developed when shrubland is 68.01% countywide?
The percentage is calculated over the entire county, including the very large central and eastern desert areas. Developed land is concentrated in the west and in the Coachella Valley, so it can dominate a local view even though shrubland covers far more total area. Countywide percentages and local concentration need to be read together.
Why is developed cover 11.16% while mean impervious surface is only 4.36%?
Developed cover is a broad land-cover category that can include homes, roads, lawns, trees, soil, and other surfaces within developed settings. Imperviousness estimates only the hard-surface share such as pavement and rooftops. Because developed areas contain both permeable and impermeable surfaces, the mean impervious percentage can be much lower than the developed-cover percentage.
Does 17.22% class difference mean 17.22% of the county permanently changed land use?
No. It means the broad mapped land-cover class differs between the 1985 and 2025 endpoints for that share of the county. The map notes that classification variation may be included. Real development or vegetation change can contribute, but mixed pixels and classification differences can also matter. Intermediate Annual NLCD years and local records are needed to determine cause.
Map File Information
Download the four original Riverside County land-cover JPG maps together in one ZIP file.
- File Type: ZIP containing four JPG files
Related Maps
- Alameda County California Land Cover Map
- Alpine County California Land Cover Map
- Amador County California Land Cover Map
Sources and references
These sources support interpretation of the Annual NLCD classes and provide official context for Riverside County boundaries, planning, agriculture, and Coachella Valley irrigation. They serve different purposes, so land-cover information should be combined with planning or parcel sources only when the question requires it.
- MRLC Annual NLCD Data — annual land-cover and related datasets
- USGS Annual NLCD Land Cover Classification — classification legend and land-cover definitions
- U.S. Census Bureau TIGER/Line Shapefiles — county boundary reference data
- Riverside County General Plan — official county land-use and open-space planning documents
- Riverside County Agricultural Commissioner Publications — county and district agricultural reports
- Coachella Valley Water District Agricultural Irrigation & Drainage — official background on Coachella Valley agricultural irrigation
Green Map creates custom-edited map images using open geographic data sources such as geoBoundaries, Natural Earth, OpenStreetMap, and government open data.
These maps are edited visual materials, not raw data files, and are provided for education, documents, presentations, and graphic reference.