Rabun County is one of the most forest-dominated counties in this map series. Forest covers 87.39% of the supplied 2025 classification, while developed land accounts for 6.58%, agriculture 3.57%, and water 1.63%. Most hard surfaces follow a narrow north-south settlement pattern through Clayton and nearby communities, while a chain of large mountain lakes occupies the southwest. This Rabun County Georgia Land Cover Map makes that contrast between wooded mountains, valley towns, and lake communities immediately visible.
The page includes four WebP views for current land cover, vegetation, impervious surface, and the 1985–2025 endpoint comparison. Four original 2480 × 1754 JPG maps are available in one ZIP for county profiles, mountain-landscape lessons, lake context, planning reference, and presentations.
Table of Contents
Clayton is the main hard-surface center along the north-south valley
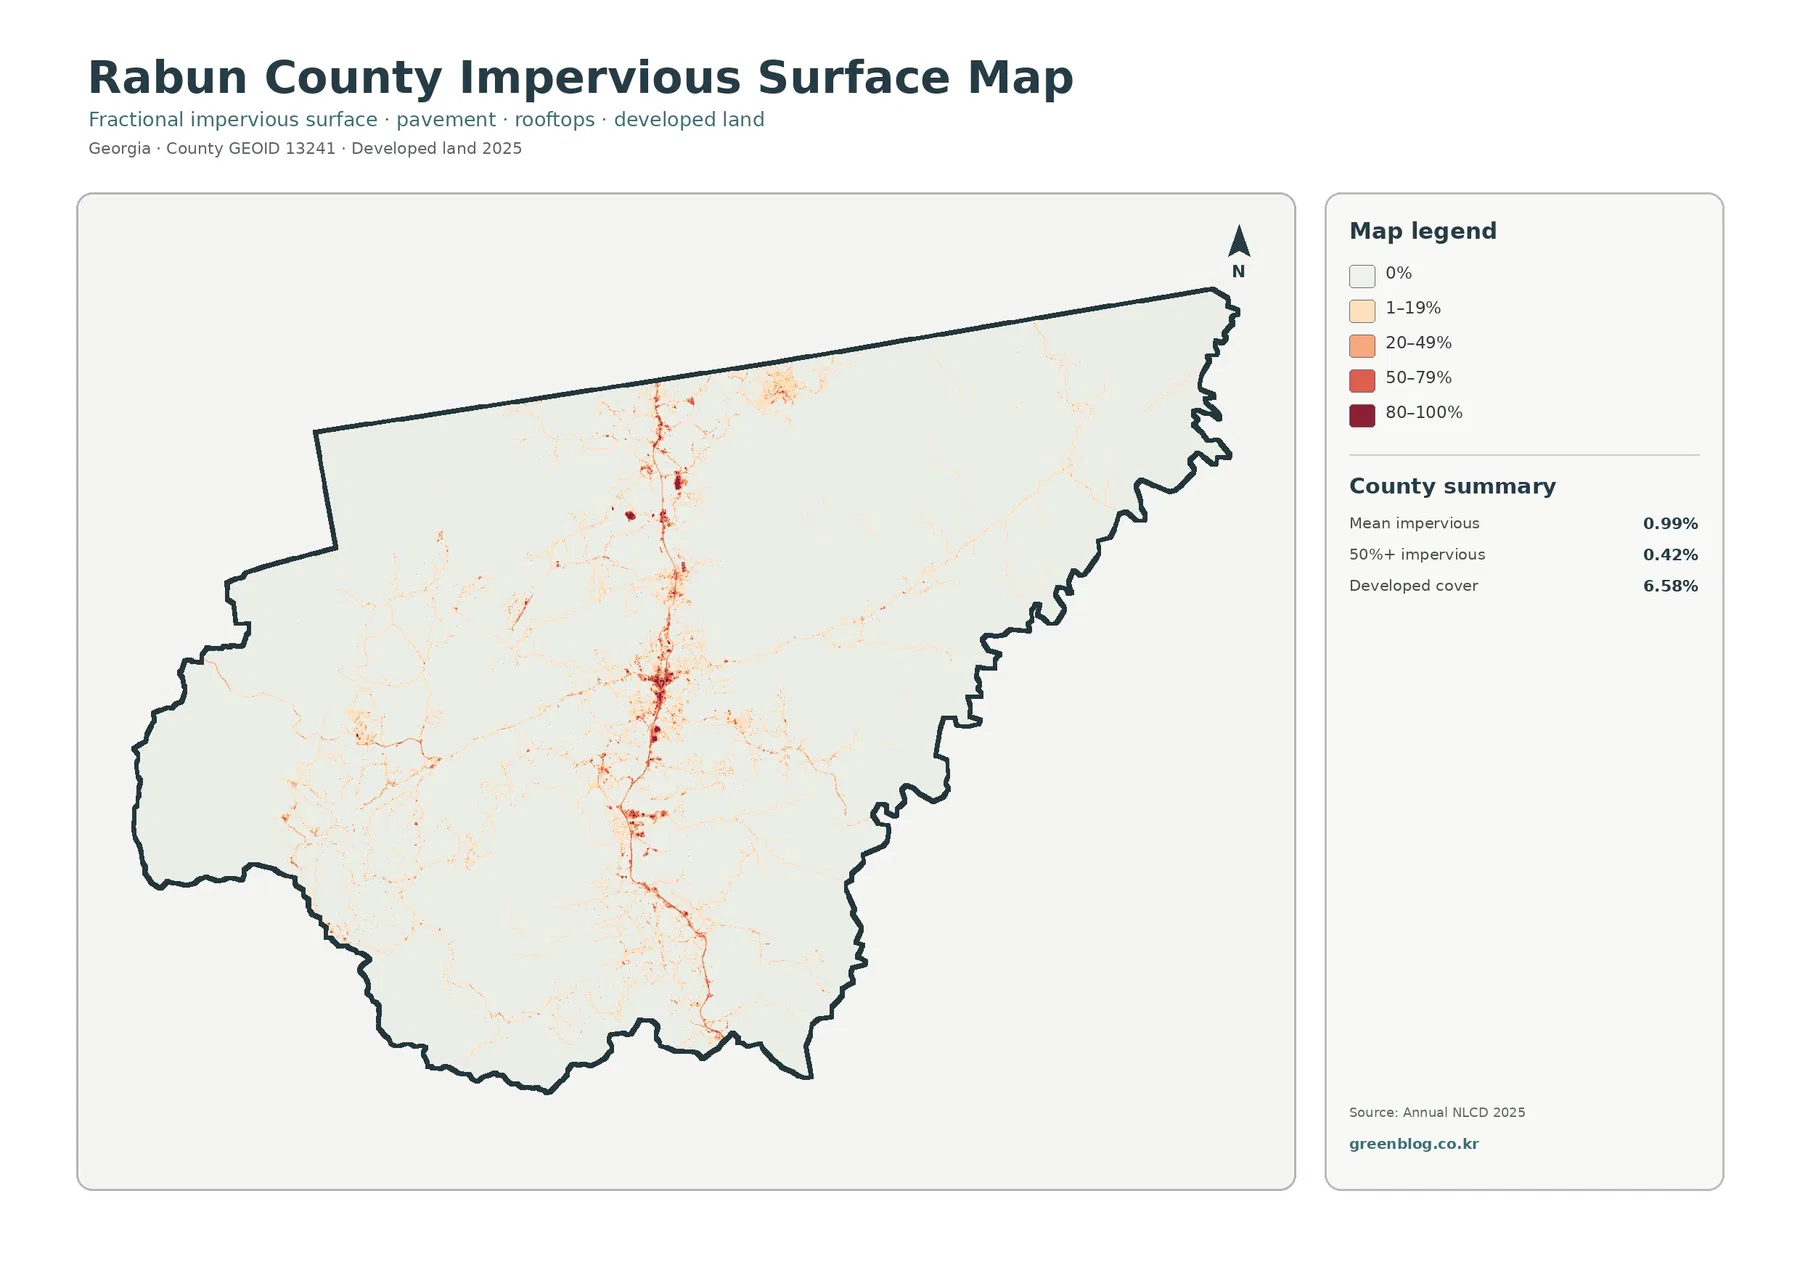
The strongest hard-surface cluster sits near the middle of the county. Rabun County’s 2024 joint comprehensive plan identifies Clayton as the county seat and largest city and describes US Highway 441 as the main north-south arterial through the valley. The map matches that county geography: a compact center is surrounded by thinner developed traces running north and south.
North of Clayton, the corridor reaches Mountain City and Dillard; south of it are Tiger and Tallulah Falls. The planning documents describe several Rabun communities as aligned with the US 441 travel corridor through the mountains. Development is therefore concentrated in the available valley settlement areas instead of spreading evenly over the county.
Mean impervious cover is only 0.99%, and 0.42% of Rabun County reaches 50% impervious surface or higher. Developed land covers 6.58%, a broader class that can include yards, trees, grass, and exposed ground around buildings and roads. The impervious layer isolates the relatively small amount of roof, pavement, and parking surface.
Forest occupies nearly nine-tenths of the county
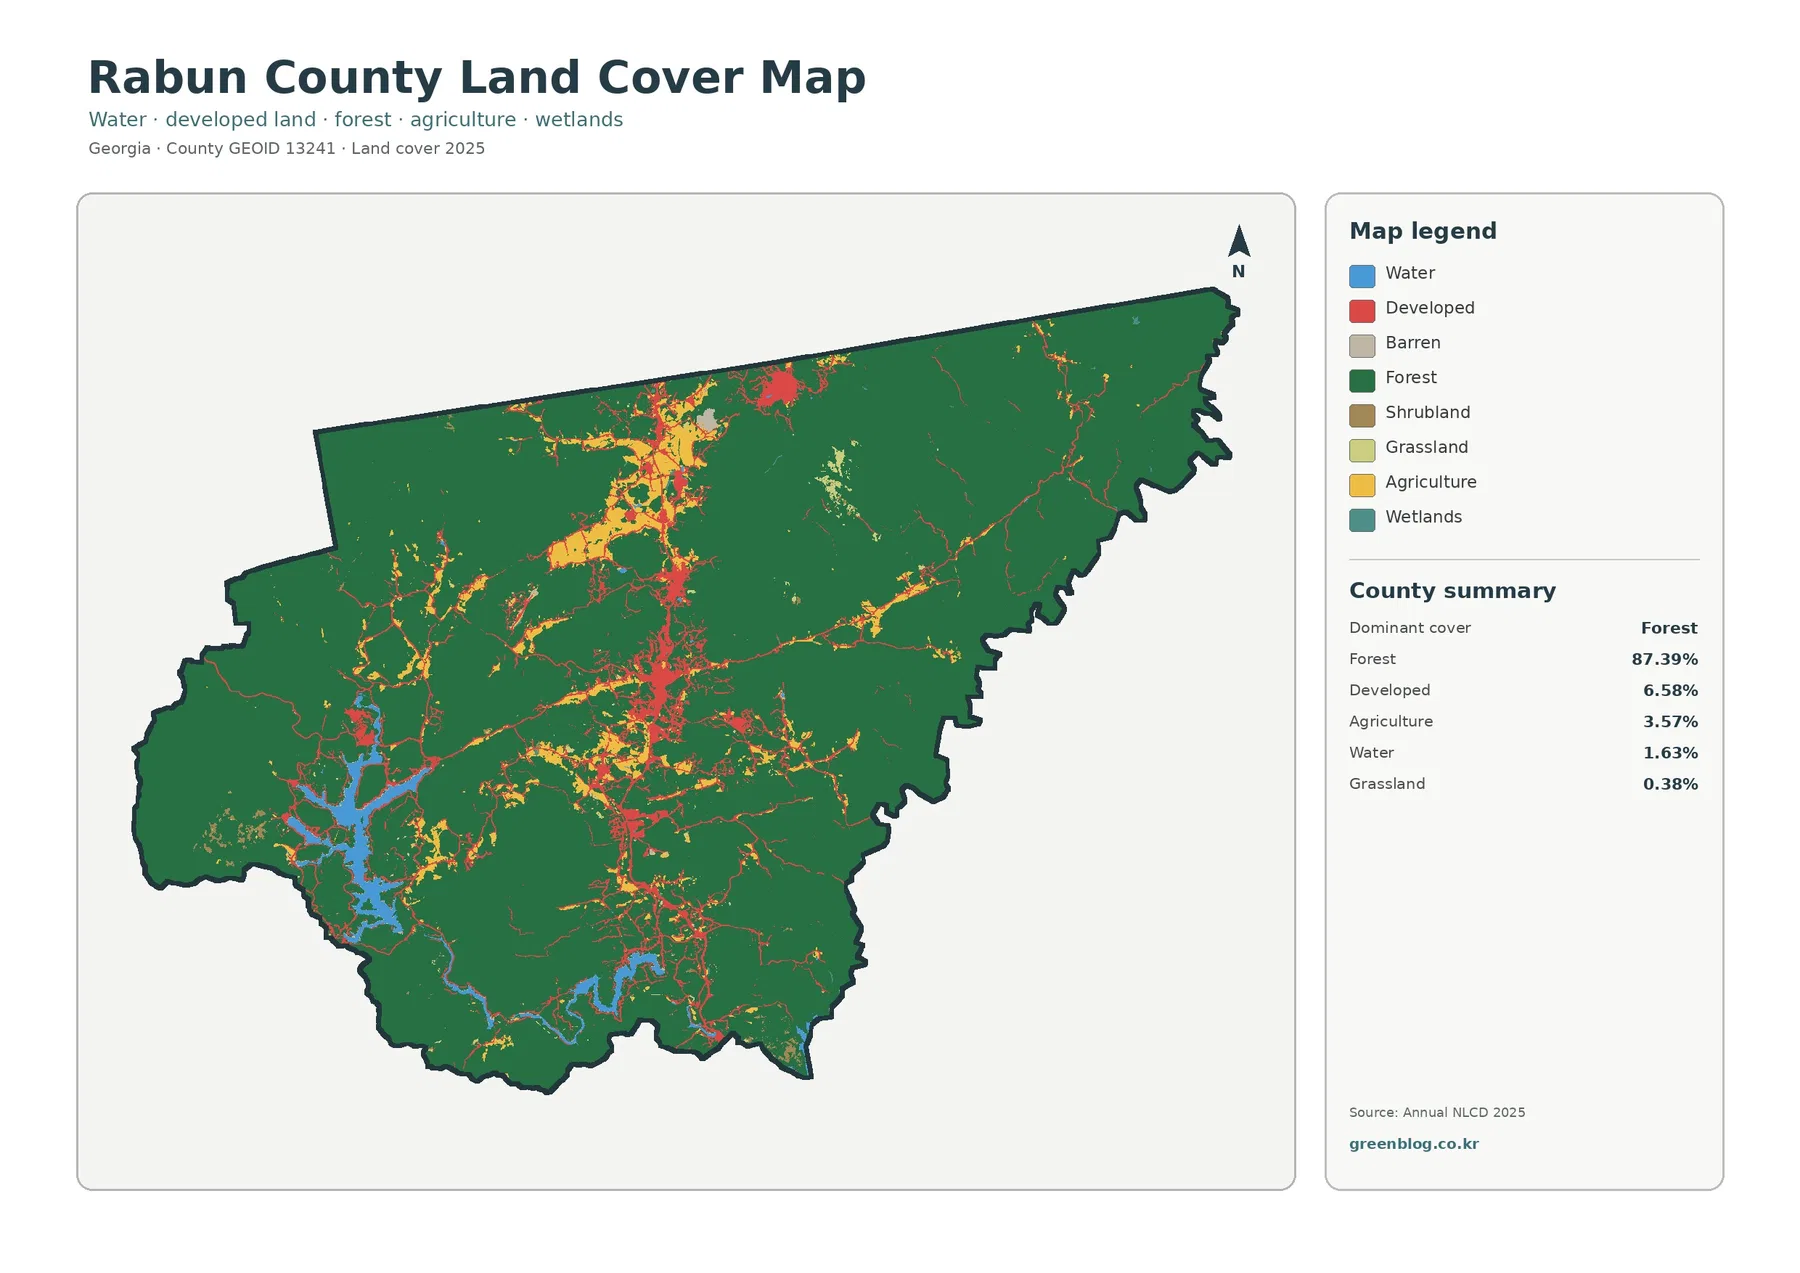
Forest covers 87.39%, dominating the east, northeast, west, and south and remaining extensive even near the main communities. Large green blocks continue from one end of the county to the other, interrupted mainly by the central valley corridor, roads, small agricultural openings, and the southwestern lakes.
Rabun County’s own community page emphasizes natural recreation, naming three major lakes, Tallulah Gorge, and the Wild and Scenic Chattooga River among its defining assets. That local description fits a land-cover map where forest, rather than farmland or suburban development, controls the countywide appearance.
Agriculture is only 3.57%, water 1.63%, and grassland 0.38%. The vegetation summary also lists shrubland at 0.27% and wetlands at 0.08%. Those percentages are small enough that broad claims about farm country, open grassland, or wetland landscapes would misrepresent Rabun County.
The southwestern lake chain creates a second kind of settlement pattern
Large blue water bodies stand out in the southwest and south-central portion of the map. Georgia Power’s North Georgia Lakes program includes Lake Burton, Seed Lake, and Lake Rabun in this area, along with other mountain reservoirs in the region. These verified lake names provide useful geographic context for the county’s clustered water cover.
Development around the lakes differs from Clayton. Instead of a compact central town and a straight north-south corridor, built surfaces near the water appear in smaller pieces that follow irregular shorelines and connecting roads. Forest remains close to the water almost everywhere, so lake communities appear embedded in woodland rather than surrounded by a broad urban surface.
Georgia Power separately regulates many shoreline improvements on its North Georgia lakes, including docks, seawalls, dredging, and some vegetation work. A developed raster cell therefore says nothing about future building rights or shoreline permission. Those questions depend on ownership, county rules, and lake-management requirements.
Agriculture is concentrated in small valley openings rather than broad plains
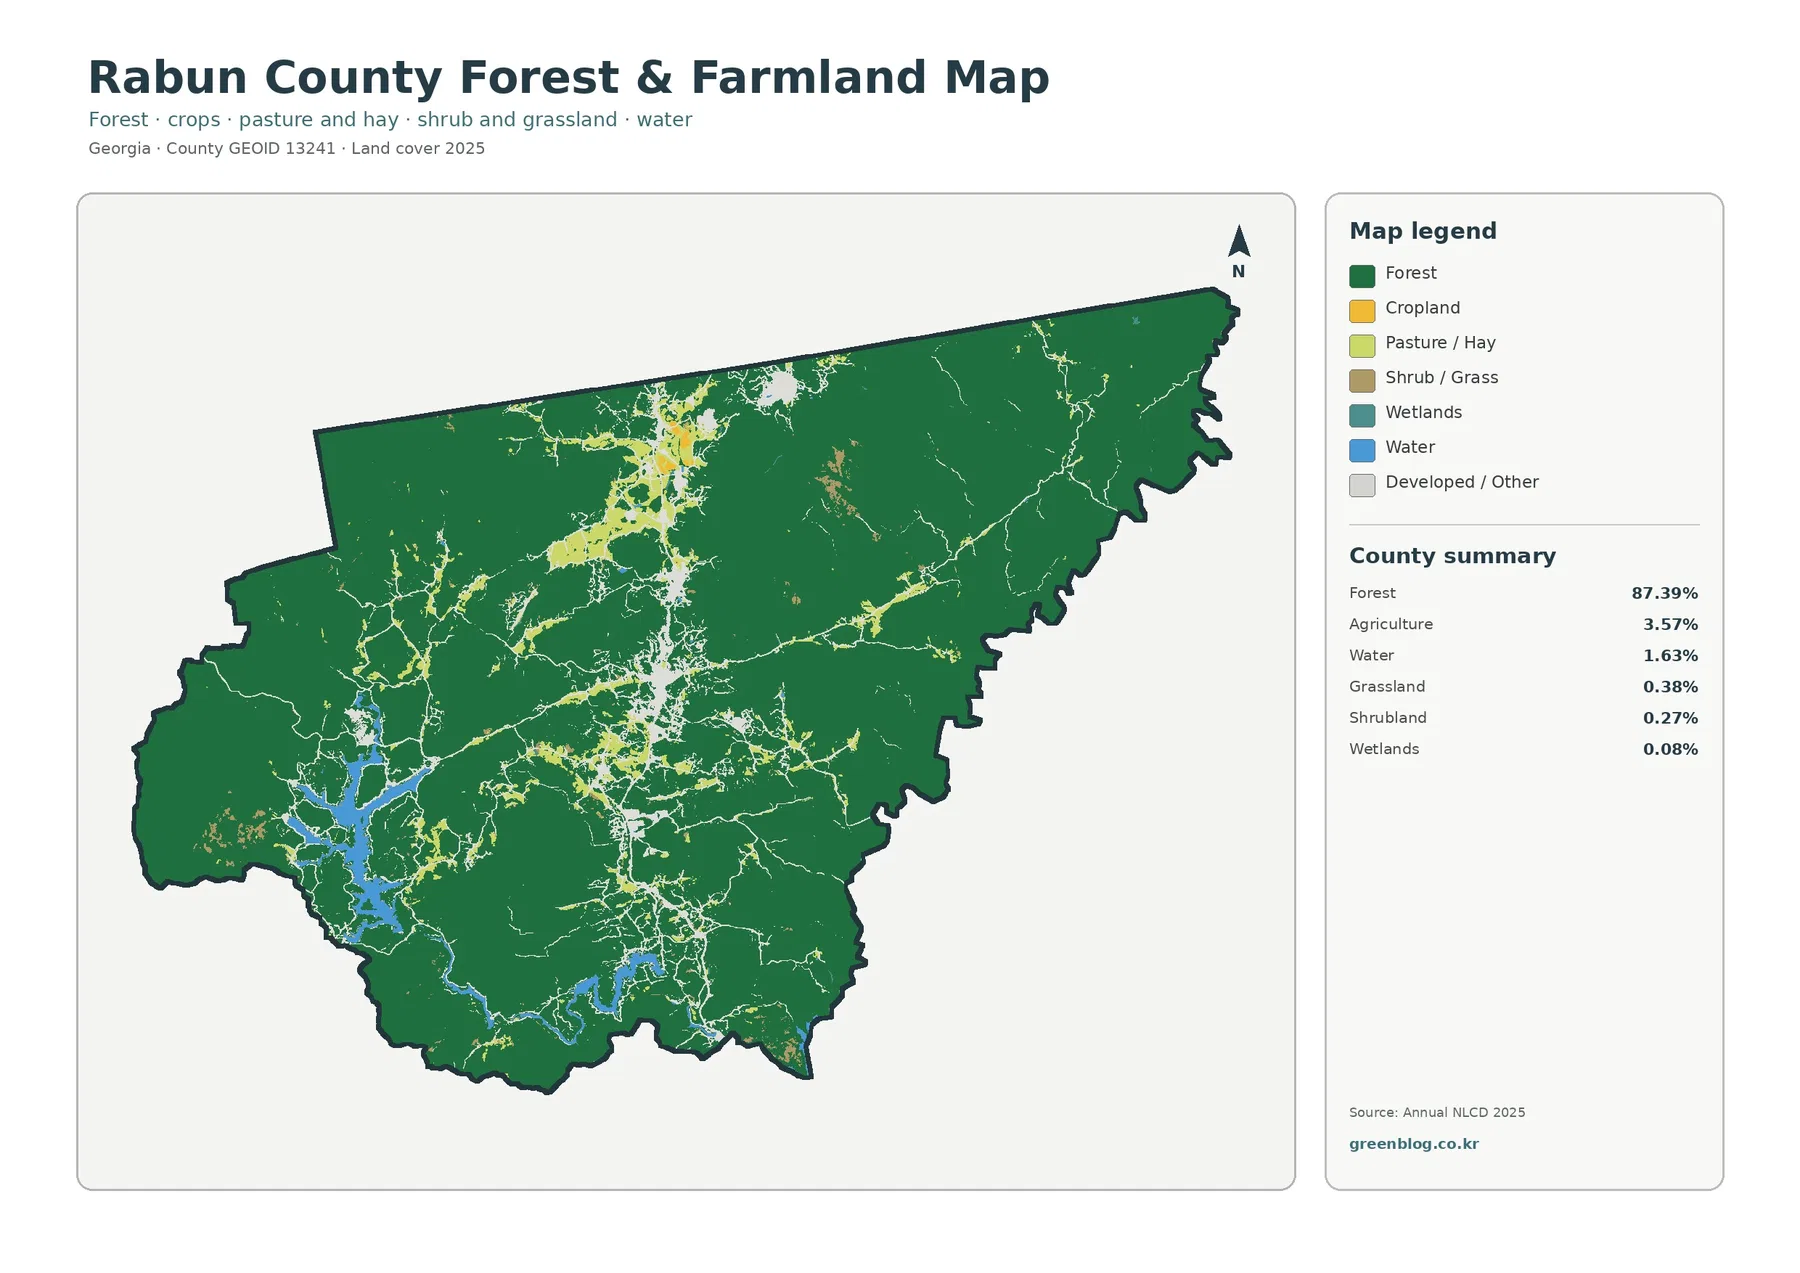
Removing most developed color makes the agricultural openings easier to locate. The largest yellow areas are near the north-central valley around the Dillard-Mountain City side of the county, with additional patches around Clayton, Tiger, and a few western valleys. They are small islands of open land inside a much larger forest matrix.
Rabun County Extension supports agriculture and natural-resource management with consultations, site visits, and diagnostic soil and water testing. Its 2025 impact report records 199 soil and water tests and more than 3,000 participants in Agriculture and Natural Resources programming. That local activity matters even though agriculture occupies a small percentage of the map.
The raster cannot identify a particular crop, pasture, vineyard, or farm boundary. A 30-meter cell may contain trees, a field edge, a driveway, and a building while displaying one predominant class. Farm-specific questions require more detailed agricultural and parcel information.
The 1985–2025 endpoint comparison records only 8.22% class difference
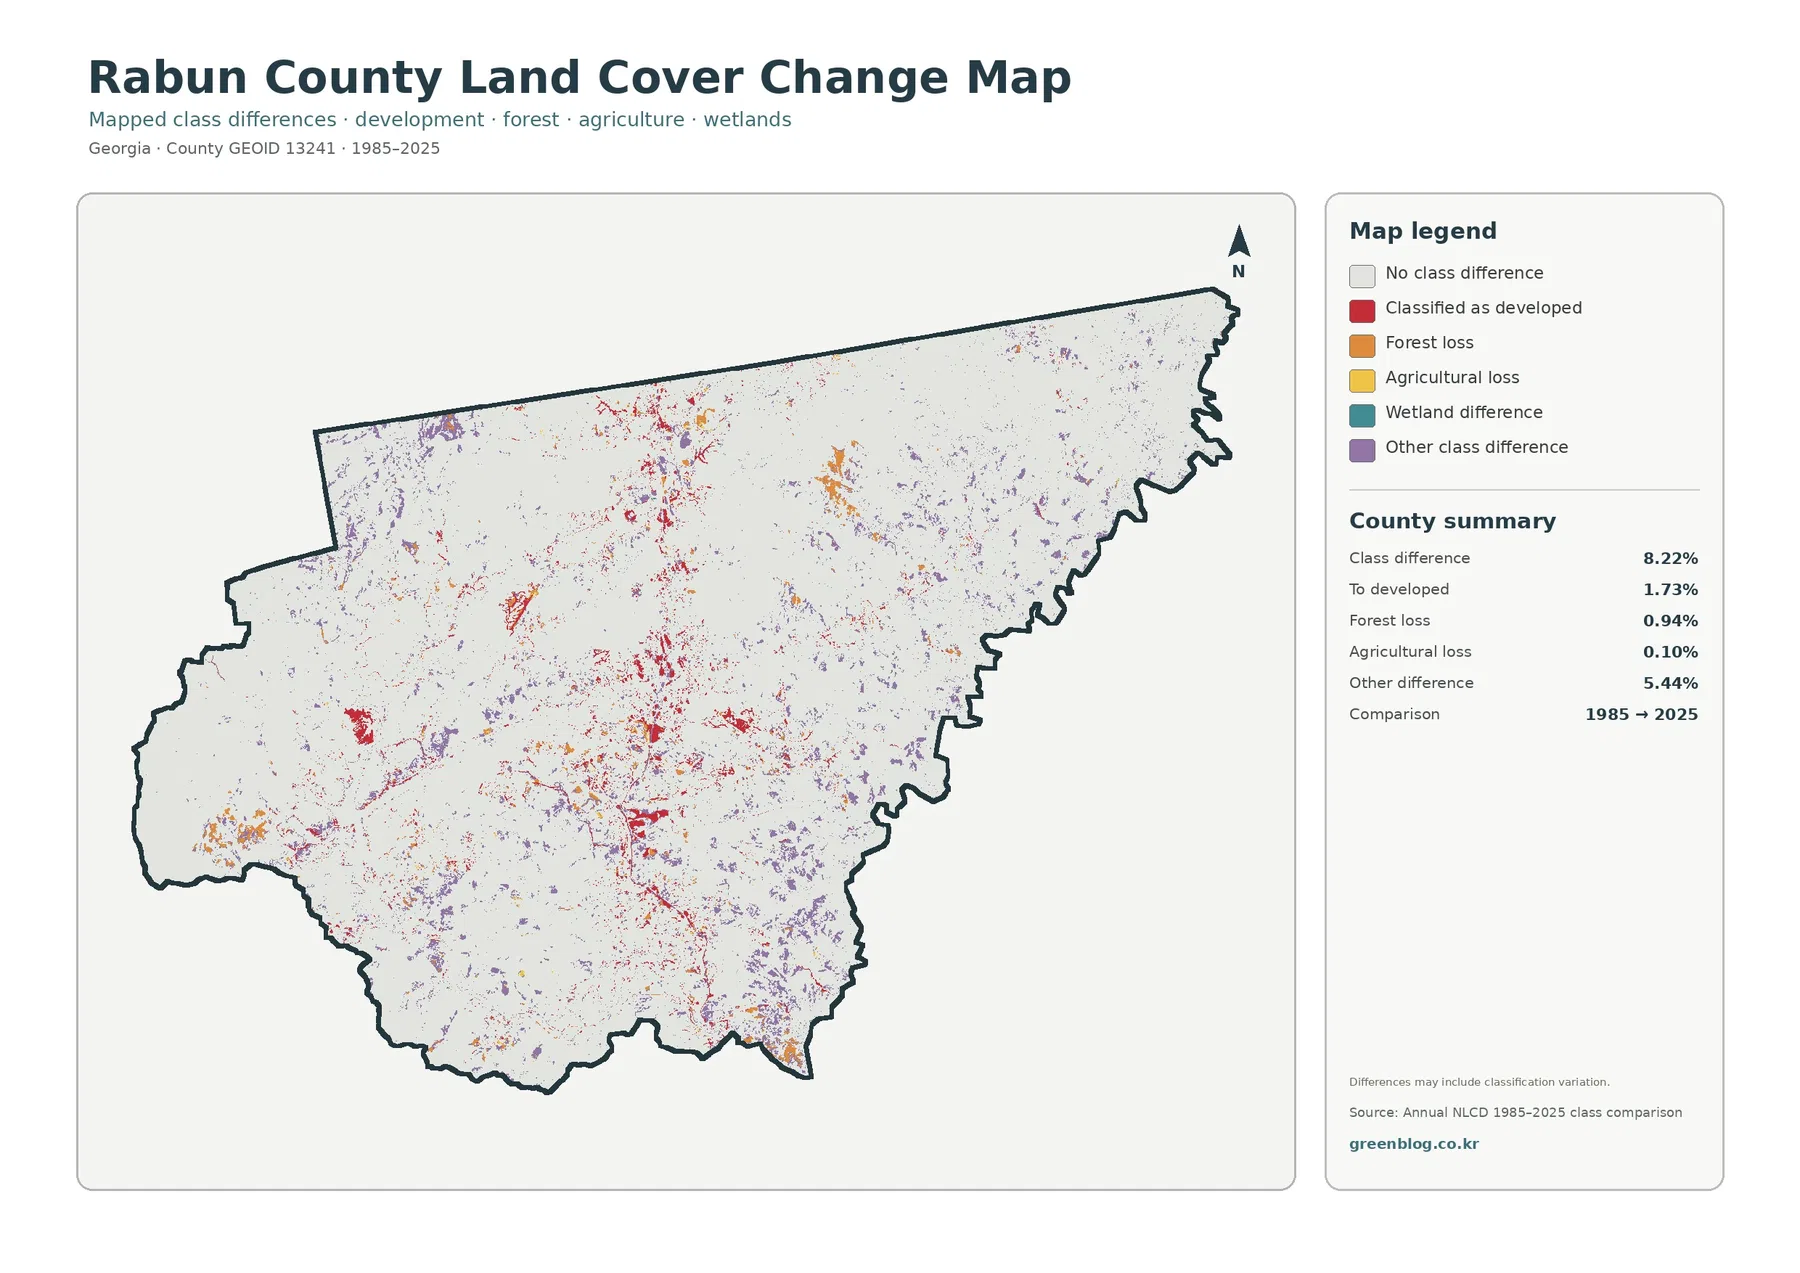
The total endpoint class difference is 8.22%. This number counts raster cells assigned different classes in 1985 and 2025. It is not a damage rate, and it cannot be subtracted from the current 87.39% forest share to reconstruct an earlier forest percentage.
The printed summary lists 5.44% other difference, 1.73% classified to developed, 0.94% forest loss, and 0.10% agricultural loss. Developed-change red is most noticeable around the main settlement corridor and several lake or road areas. Other-difference purple is more dispersed through the forested county.
Wetland difference appears in the legend without a separately printed percentage. The missing value should not be reconstructed by subtraction. Classification variation may also contribute to some patches, so intermediate imagery and local development or forestry records are needed before assigning a cause.
Land cover is different from forest ownership, zoning, and lake rules
Green forest does not identify national forest, state park, or private ownership. Red developed land does not define Clayton, Dillard, Mountain City, or another municipal boundary, and blue water does not establish shoreline access rights. These maps classify surface cover rather than legal jurisdiction.
Annual NLCD also generalizes the landscape into 30-meter cells. Narrow roads, small buildings, steep valley bottoms, and irregular shorelines can look simplified or mixed. Parcel boundaries, building permits, zoning, lake improvements, and exact transportation alignments require current county, Census, Georgia Power, or other official records.
Choosing the four JPG maps for Rabun County
Start with the 2025 countywide map when the goal is to show forest dominance, Clayton’s valley position, and the southwestern lakes together. The vegetation view is better for locating small agricultural openings. Choose the impervious map for Clayton and the US 441 settlement corridor, and reserve the endpoint map for a separate discussion of 1985–2025 class differences.
Each JPG measures 2480 × 1754 pixels and suits reports, lessons, and presentations. The package does not mark the files as A3 high-resolution assets, so test a proof before large-format printing.
Frequently Asked Questions
What is the dominant land-cover class in Rabun County?
Forest is the largest class in the supplied 2025 summary at 87.39%. Developed land follows at 6.58%, agriculture at 3.57%, and water at 1.63%.
Why is developed land 6.58% while mean impervious cover is only 0.99%?
Developed classes can include trees, lawns, yards, and exposed ground around buildings and roads. The impervious layer measures harder surfaces such as roofs, pavement, and parking areas.
Does the 8.22% endpoint difference measure forest clearing?
No. It counts all cells with different class labels in 1985 and 2025. The summary separately lists 1.73% classified to developed, 0.94% forest loss, 0.10% agricultural loss, and 5.44% other difference.
Sources and Reference Data
- MRLC Annual NLCD Data – official access to annual land-cover and comparison products
- USGS Annual NLCD Land Cover Classification – definitions for forest, developed land, agriculture, water, and related classes
- U.S. Census Bureau TIGER/Line Shapefiles – authoritative county, place, and transportation layers for comparison
- Georgia DCA – Rabun County Joint Comprehensive Plan – official planning context for Clayton, Dillard, Mountain City, US 441, and the other Rabun communities
- Georgia Power – North Georgia Lakes – official Lake Burton, Lake Rabun, Seed Lake, recreation, and shoreline-management context
- UGA Extension – Rabun County Impact – county-specific agriculture, natural-resource, soil, and water program information
Map File Information
The ZIP contains four original JPG maps for comparing Rabun County's 87.39% forest cover, Clayton and the US 441 corridor, Lake Burton, Seed Lake, and Lake Rabun context, impervious surfaces, and 1985–2025 class differences.
- Included Files: Maps described in this article
- File Type: ZIP archive available from the download link below
- Intended Use: Printing, education, presentations, and map-based projects
Related Maps
- Appling County Georgia Land Cover Map
- Atkinson County Georgia Land Cover Map
- Bacon County Georgia Land Cover Map
Green Map creates custom-edited map images using open geographic data sources such as geoBoundaries, Natural Earth, OpenStreetMap, and government open data. These maps are edited visual materials, not raw data files, and are provided for education, documents, presentations, and graphic reference.