The Navajo County Arizona Land Cover Map set covers a long north-to-south county where shrubland dominates most of the mapped area while forest becomes much more prominent in the south. The 2025 summary assigns 79.31% of the county to shrubland and 14.82% to forest, with grassland, developed land, barren ground, agriculture, water, and wetlands occupying much smaller shares.
Four views are provided for different questions: overall land cover, forest and farmland, fractional impervious surface and developed land, and mapped class differences from 1985 to 2025. The four original JPG files are available together in the download near the end of the page, separate from the WebP previews used in the article.
Table of Contents
Why shrubland defines the countywide picture
At county scale, the broad tan shrubland class controls the visual character of the map. It covers nearly all of the central portion and remains extensive through much of the north. Forest breaks that continuity in two very different ways: scattered green patches occur in the northern part, while a much larger and more continuous forest area occupies the south.
Grassland accounts for 3.41% and appears most clearly in the lower-middle part of the county, where it creates a lighter transition between the huge shrub-dominated interior and the greener southern section. Developed cover is only 1.23%, and barren land is 0.66%. Those values help explain why urban or bare-ground colors remain small accents rather than large blocks on the general map.
Land cover should not be confused with zoning or ownership. A shrubland cell describes the surface category assigned to that location in the land-cover product; it does not tell the reader whether the land is private, tribal, federal, developable, protected, or subject to a particular planning designation. The map is best used to understand broad surface patterns at county scale.
The 2025 land-cover view: a strong north–south contrast
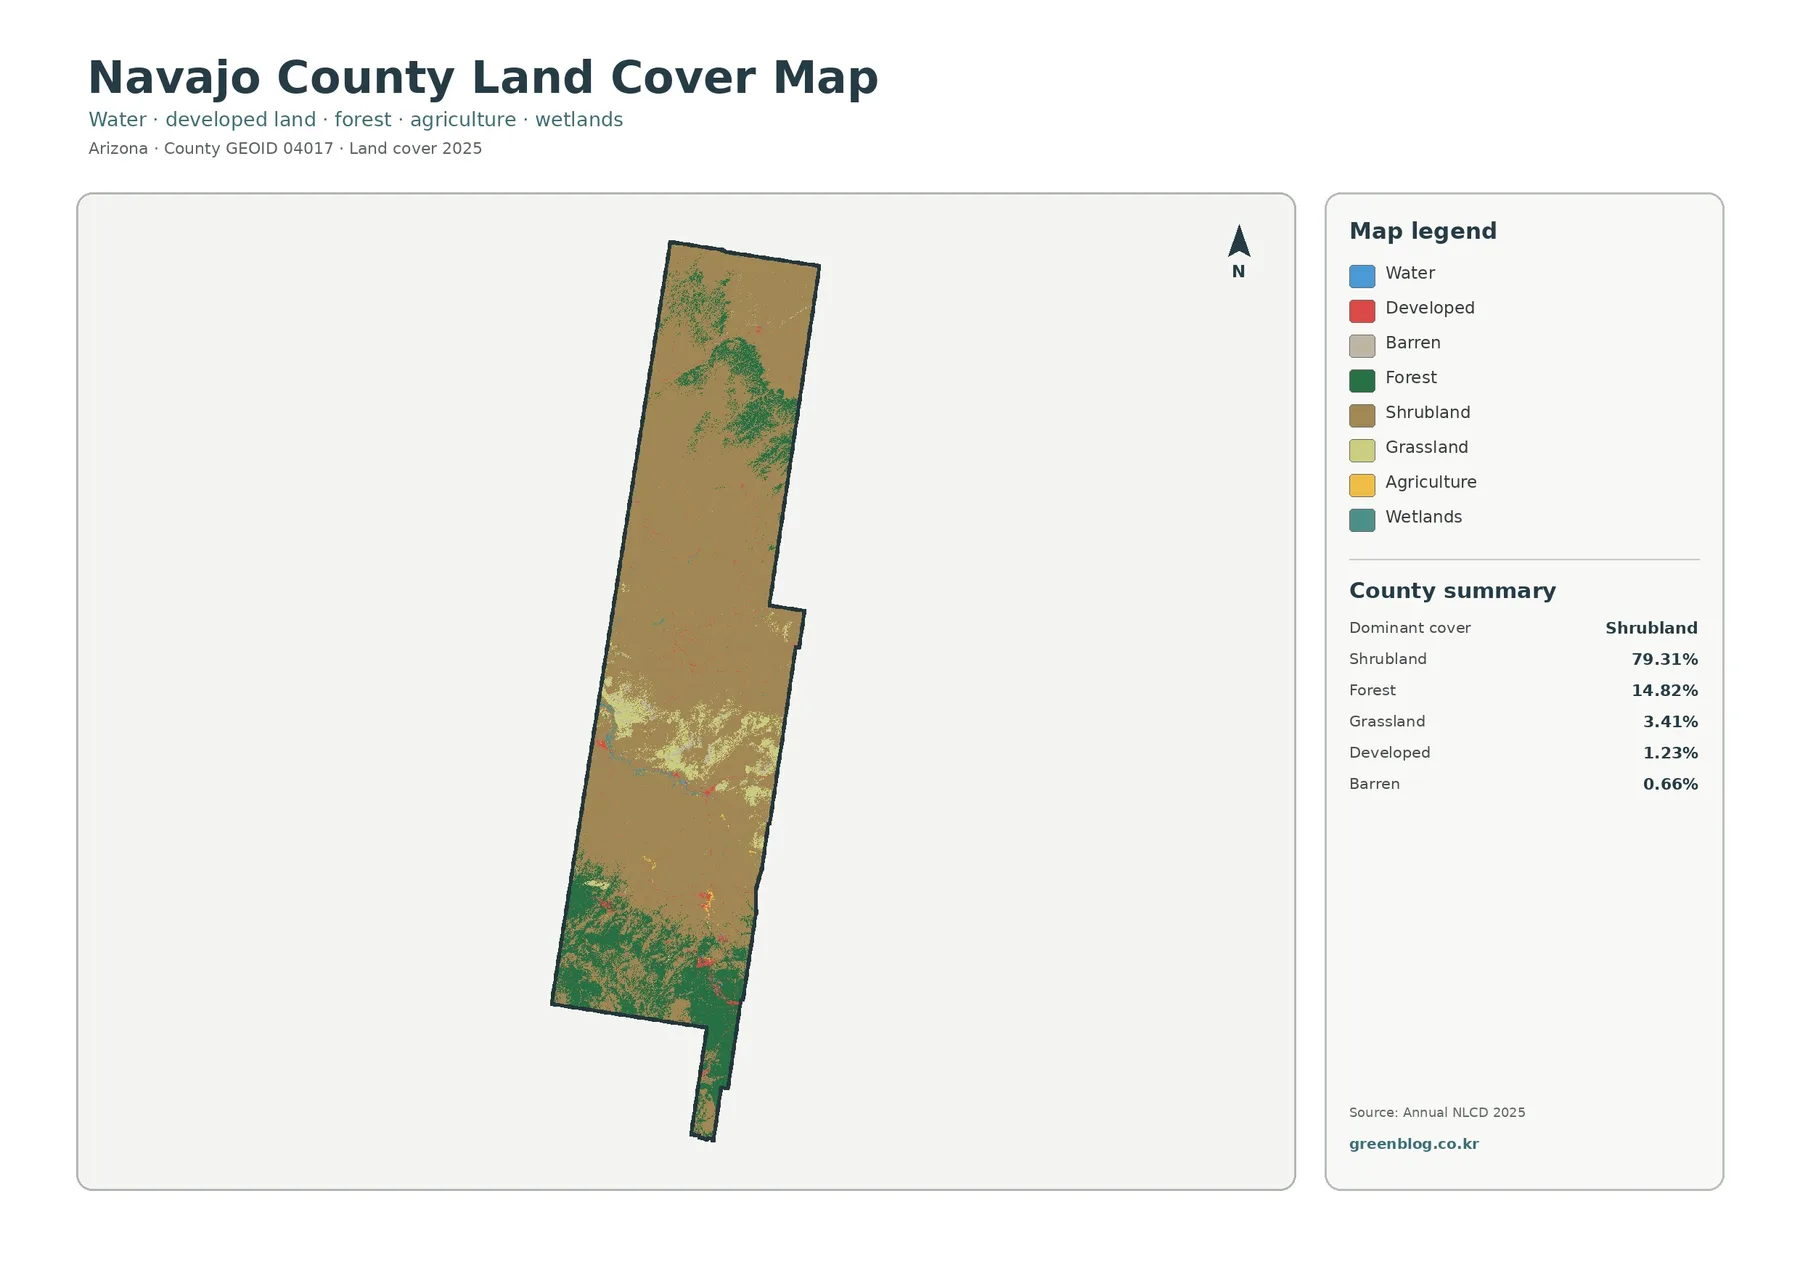
The full land-cover map gives the clearest first look at that contrast. Shrubland stretches through the long central body of the county and continues toward both ends. In the far south, however, forest becomes the main visible cover over a broad area. A few red developed clusters stand out against the otherwise natural-color palette, but they occupy only a small share of the county.
The lower-middle section contains a noticeable concentration of grassland mixed with shrubland and smaller forest patches. Wetlands and water are present but visually narrow and fragmented. Agriculture is also mapped, yet it is too limited to create a large continuous agricultural district. This is important because a statewide or regional description of Arizona agriculture would not describe the pattern visible inside this county.
The legend identifies water, developed land, barren ground, forest, shrubland, grassland, agriculture, and wetlands. Reading these as groups rather than as a long list makes the map easier to use. Shrubland and forest provide the large background contrast, grassland forms a secondary transition, and the remaining classes identify smaller features that become easier to see when the map is enlarged.
Forest and farmland become easier to separate
The forest-and-farmland view simplifies the same county by emphasizing vegetation and agricultural classes. Forest is 14.82%, agriculture is 0.10%, water is 0.02%, grassland is 3.41%, shrubland is 79.31%, and wetlands are 0.44%. The small agricultural share is especially useful context because isolated crop or pasture pixels can look more important on a zoomed image than they are countywide.
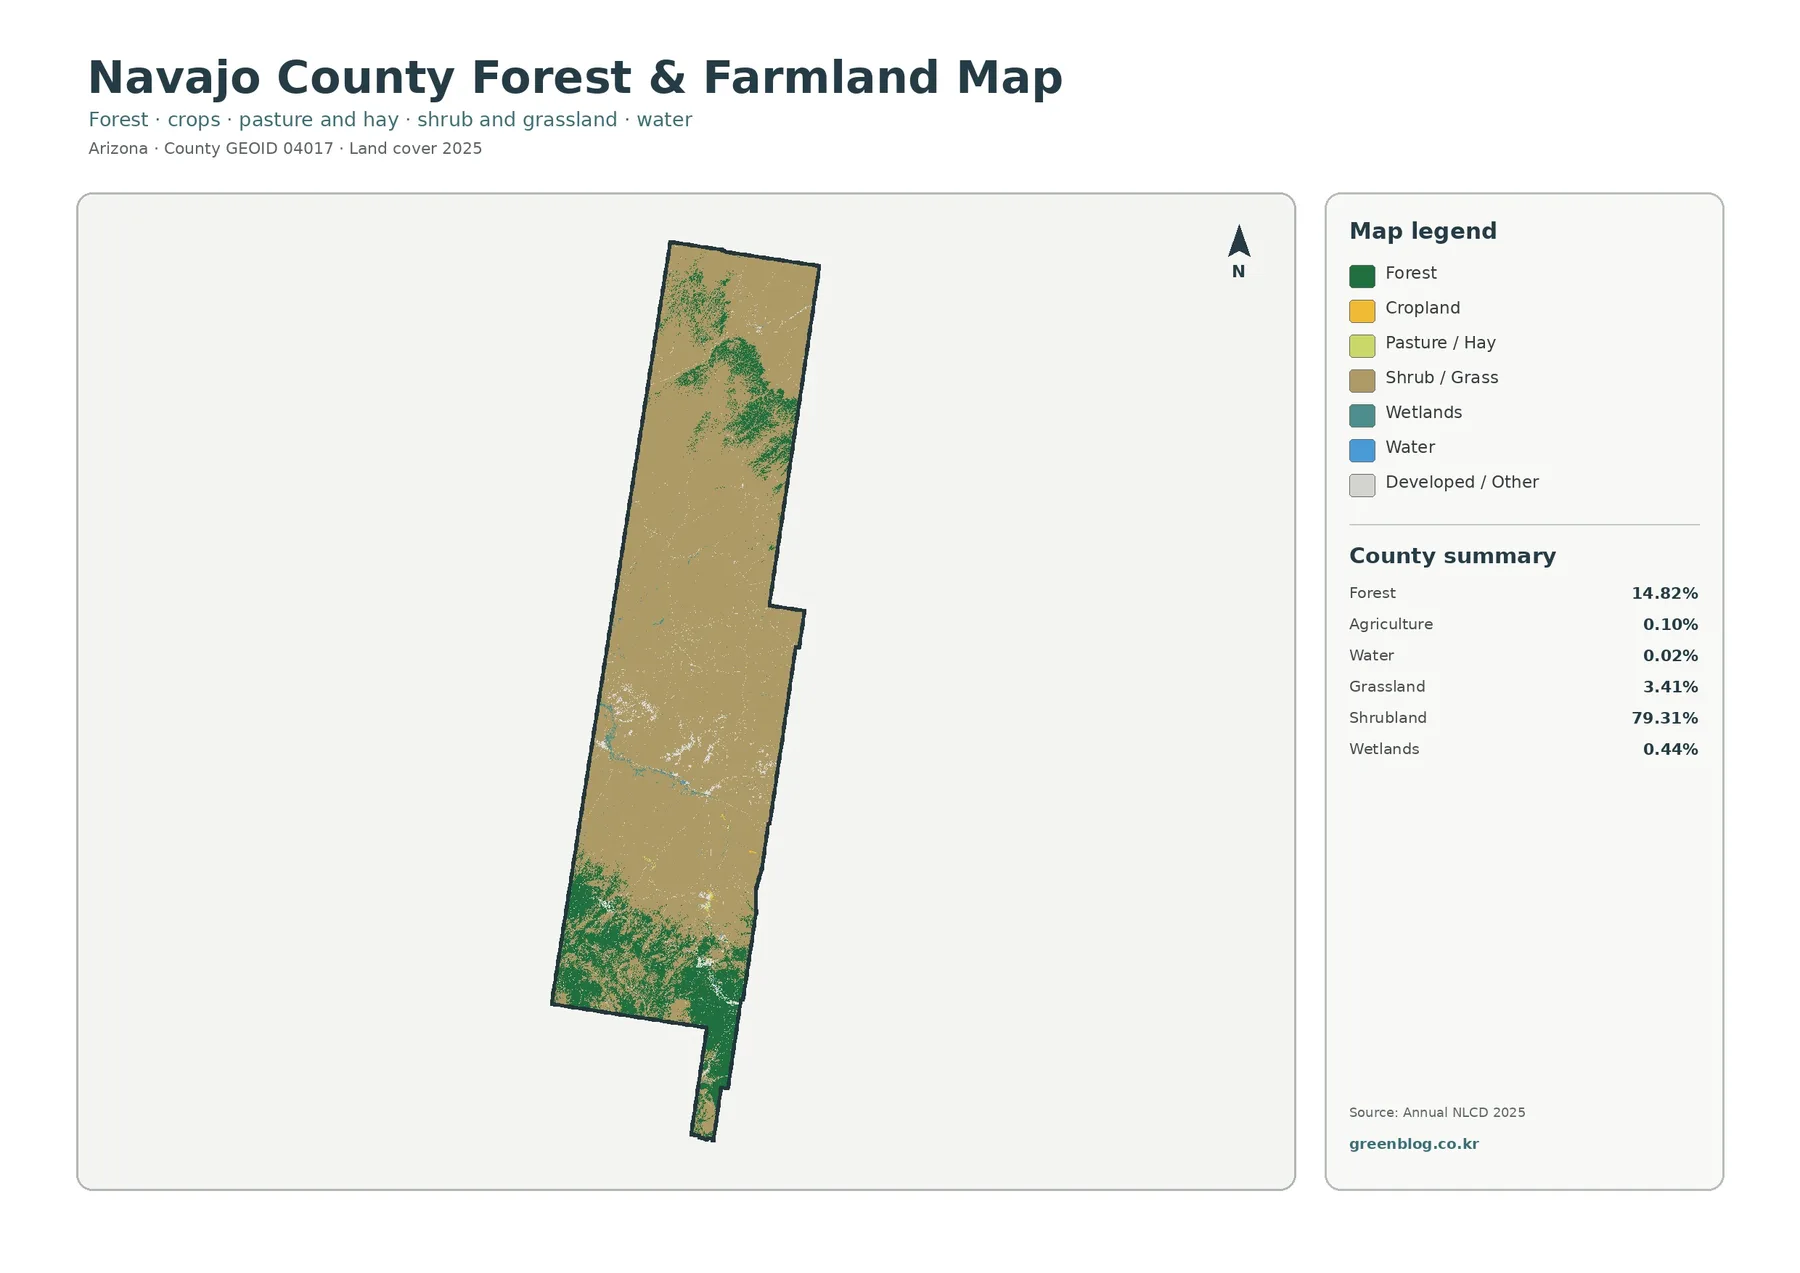
The south contains the strongest continuous forest pattern, while the central and northern areas remain largely in the shrub-and-grass category. Northern forest is more broken, appearing as separate patches rather than one broad green mass. This difference is easier to recognize here than on the general map because several minor developed and barren classes have been grouped out of the way.
Wetlands appear as narrow teal features and small patches, especially in the middle-to-lower part of the county. Water is even less common at 0.02%. Because both categories are small, a reader should avoid judging them only from countywide percentages. Their position may matter for a local comparison even when their share of total area is tiny, but this map does not define regulatory wetland boundaries or water rights.
Very little of the county is covered by hard surface
Fractional impervious surface measures the share of a raster cell covered by hard materials such as pavement or rooftops. Navajo County has a mean impervious value of 0.23%, while only 0.06% of the county falls in the 50%-or-greater impervious category. Developed cover is 1.23%, which is a related but different land-cover measure.
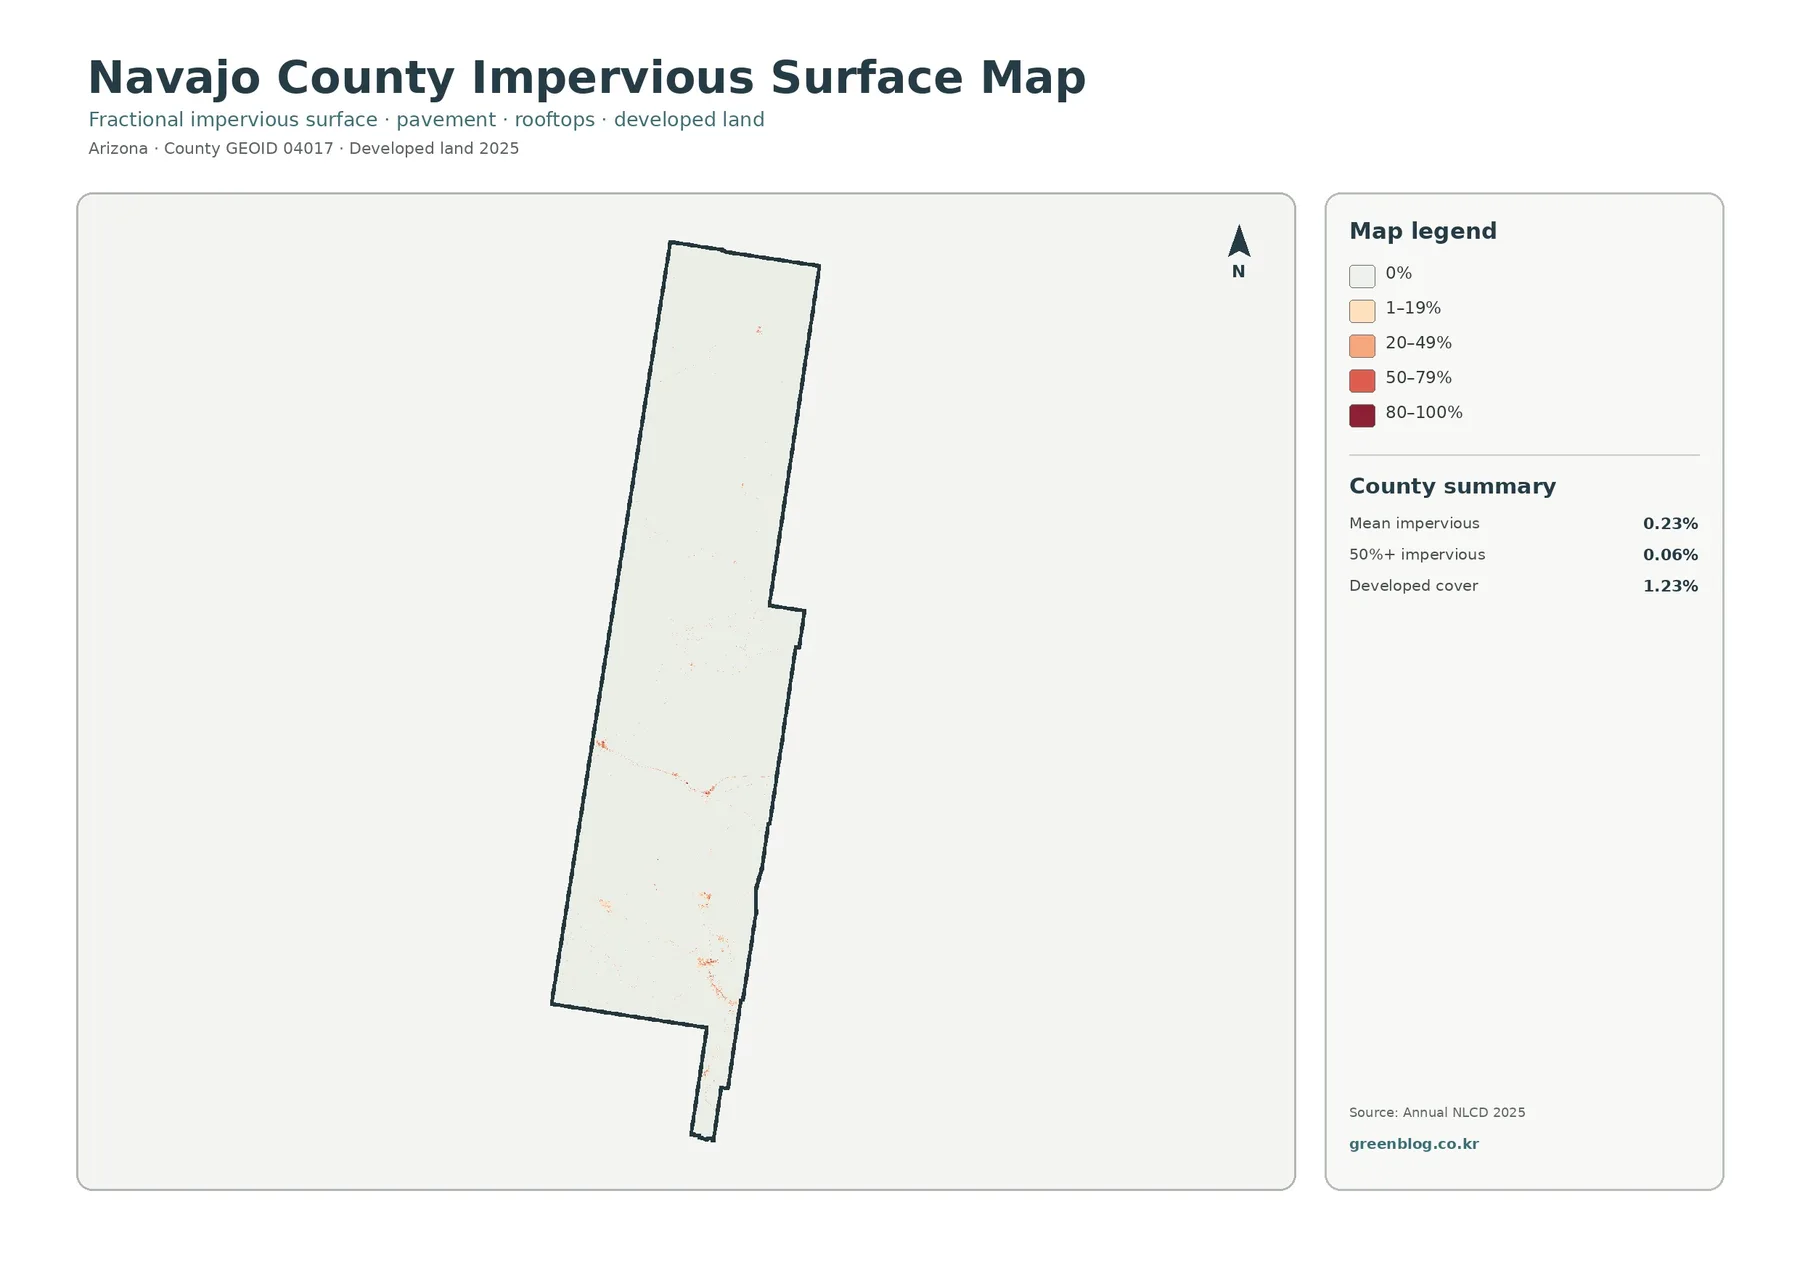
Most of the county is nearly white on this view because impervious surface is absent or very low. The most visible orange and red clusters occur in the lower half, with a few much smaller marks farther north. The map therefore works well for showing concentration: hard surface is not spread evenly across Navajo County but appears in limited clusters against a very large low-impervious area.
It is normal for the developed-cover percentage and the mean impervious percentage to differ. Developed land is a categorical land-cover class, while fractional impervious data estimate how much of each cell is actually covered by a hard surface. A low-density developed cell may contain buildings and roads along with substantial vegetation or open ground, so it does not need to be 100% impervious.
What changed between 1985 and 2025
The change product compares mapped classes at two endpoints rather than presenting a year-by-year history. It reports class differences across 4.95% of the county. Forest loss is the largest summarized category at 3.48%, followed by other class differences at 0.99%, areas classified as developed at 0.40%, and agricultural loss at 0.03%.
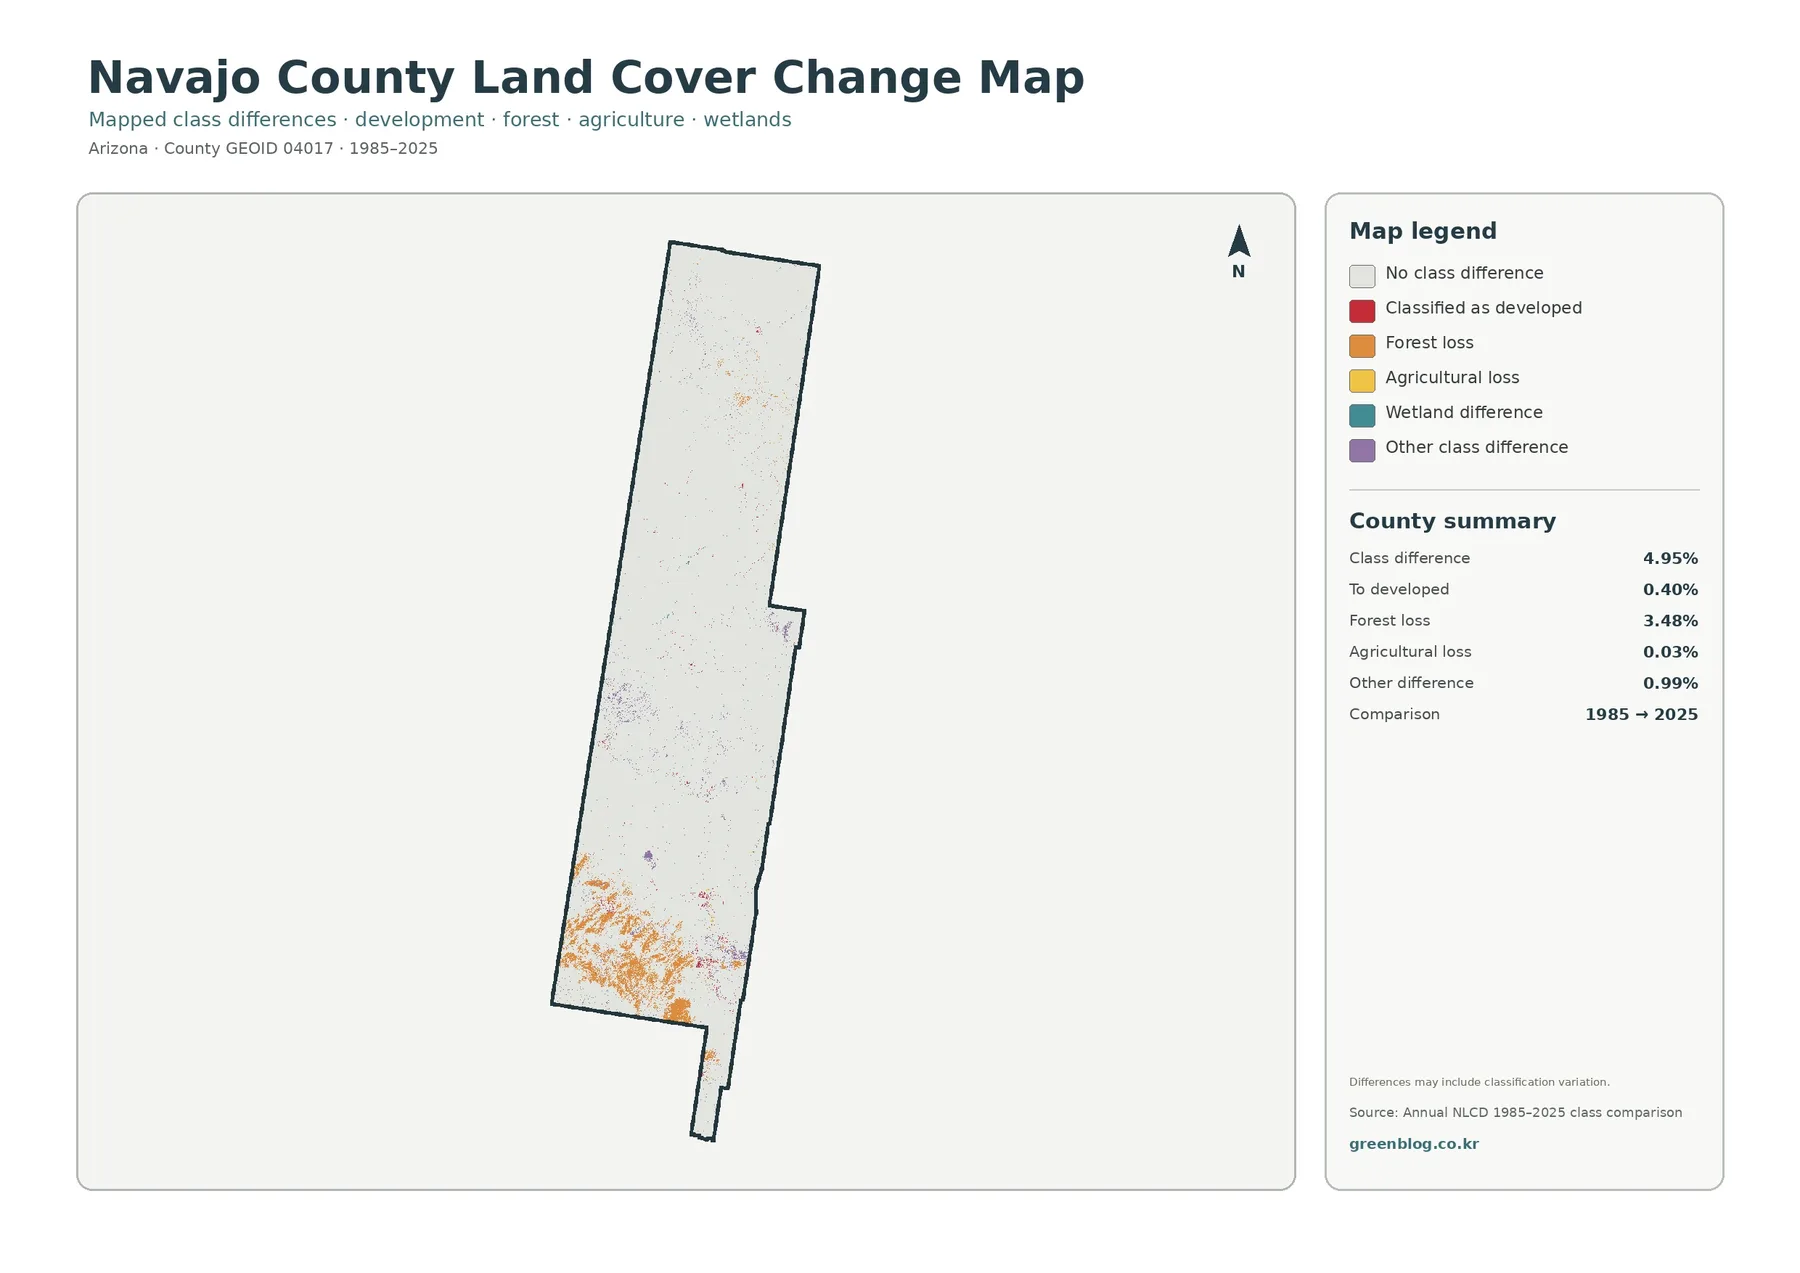
The southern forested section contains the largest concentration of orange forest-loss pixels. Elsewhere, change marks are much more scattered. Red areas classified as developed remain small and localized, while purple “other difference” pixels appear in several separate groups. The pattern does not support the idea of a single countywide transformation; most of the mapped area is still shown as having no class difference between the two comparison dates.
Wetland difference has its own legend category, but the summary panel does not provide a separate percentage for it. It would be misleading to calculate a value by subtracting the other rounded percentages, so this article treats wetland difference as a mapped category without assigning an invented number. The map also warns that differences may include classification variation, an important caution when interpreting small or isolated changes.
How to compare the four views without mixing their meanings
A useful reading sequence starts with the 2025 general map to locate the broad shrub, forest, and grass pattern. The forest-and-farmland view can then narrow the question to vegetation, agriculture, water, and wetlands. After that, the impervious map separates hard surface from the wider developed-land category. The change map should come last because it asks whether the class differs from 1985, not simply what covers the ground today.
The southern part of the county is a good example. It is strongly forested on the current map, yet it also contains the largest concentration of forest-loss pixels on the comparison map. Those facts are compatible: forest can remain the dominant current cover while some cells have changed away from a forest class since 1985. Current condition and historical class difference are different measurements.
The broad central shrubland offers the opposite comparison. It dominates the present-day map but contains relatively few highlighted changes over much of its area. That does not prove that every ecological condition remained unchanged. It only means the selected land-cover classes at the map’s raster scale were more often the same at the two endpoints.
County planning context adds an important caution
Navajo County adopted an updated comprehensive plan in January 2025. Its land-use goals include development that is sensitive to the natural environment, preservation of open spaces and natural features, and keeping major floodways as open space or in a natural state. Those policy statements are not land-cover classes, but they show why broad surface information can be useful as background for planning discussions.
The county’s official overview also describes a region with varied natural resources, including water and forest products, and identifies Navajo Nation, the Hopi Tribe, and the White Mountain Apache Tribe as Native American communities within the county. None of those jurisdictional boundaries is drawn on the supplied land-cover maps. A colored patch should therefore never be assigned to a landowner or jurisdiction unless a separate authoritative boundary layer confirms it.
This distinction matters because land cover, land use, ownership, and zoning answer different questions. A forest class says something about the surface detected by the land-cover dataset. A comprehensive-plan category addresses future or desired land use. A parcel map identifies property boundaries. Combining those topics can be useful, but they should remain separate layers rather than being inferred from one map.
Practical ways to use the map set
For classroom work, the simplest exercise is to compare percentages with visible area. Students can start with shrubland at 79.31% and forest at 14.82%, then locate where those classes actually occur. Smaller categories such as grassland at 3.41%, developed cover at 1.23%, agriculture at 0.10%, and water at 0.02% demonstrate how a class can be important locally even when its countywide share is small.
For environmental or planning presentations, the four maps should be selected according to the question rather than displayed as interchangeable illustrations. The general map is best for overall composition. The forest-and-farmland map clarifies vegetation and open-land categories. The impervious view highlights hard-surface concentration, and the change image focuses attention on locations where the classified surface differs from 1985.
A report can also use the set as a comparison sequence. Choose one part of the county, note its present class, check whether forest or agriculture is emphasized there, inspect the fractional impervious category, and finally look for a change mark. Repeating the same geographic comparison across all four images is more informative than treating each map as a separate decorative graphic.
Scale, mixed pixels, and other limits
Annual NLCD is raster data, which means the landscape is represented by grid cells rather than parcel outlines. A single cell can contain more than one real-world surface. When forest, shrub, pavement, and bare soil occur close together, the assigned class or fractional value generalizes that mixture. This is one reason small boundaries on the ground should not be copied directly from the image.
Classification date is another limitation. The 2025 map describes the mapped condition for that product year, not a live view of the county. Construction, wildfire, vegetation recovery, land management, or other changes after the observation period will not appear until they are captured in a later dataset. The 1985–2025 comparison likewise does not explain why a cell changed class.
These maps are not parcel surveys, zoning maps, flood determinations, wetland delineations, or building-permit records. Property research and regulatory decisions require the appropriate Navajo County, state, tribal, or federal source. The county GIS and planning pages can provide separate authoritative layers that answer questions the land-cover images were not designed to resolve.
Download the four original JPG maps
The download archive contains one original JPG for each map discussed on this page: general land cover, forest and farmland, impervious surface and developed land, and 1985–2025 land-cover change. Each source image is 2480 × 1754 pixels. The package preserves that original supplied resolution rather than enlarging or re-encoding it as a higher-resolution A3 file.
Frequently Asked Questions
What is the dominant land-cover class in Navajo County?
Shrubland is the dominant 2025 class at 79.31%. Forest is second at 14.82% and is most extensive in the southern part of the county.
How much of the county is developed or impervious?
Developed cover is 1.23%. Mean fractional impervious surface is 0.23%, and only 0.06% of the county is mapped at 50% or greater impervious surface.
What is the largest mapped 1985–2025 change category?
Forest loss is the largest summarized category at 3.48%. Total class difference is 4.95%, and the map notes that some differences may include classification variation.
Can this map be used to determine zoning or property boundaries?
No. Land cover describes the mapped surface, while zoning, ownership, parcels, and regulatory boundaries come from different datasets and agencies.
Map File Information
Navajo County Land Cover Map Files
- Included Files: Use only the versions confirmed in the article and supplied images
- File Type: Use the confirmed download contents
- Intended Use: Printing, education, presentations, and map-based projects
Related Maps
- Apache County Arizona Land Cover Map
- Cochise County Arizona Land Cover Map
- Coconino County Arizona Land Cover Map
Sources and further reading
- MRLC Annual NLCD Data — annual land-cover data access.
- USGS Annual NLCD Land Cover Classification — official class descriptions and interpretation guidance.
- Navajo County 2050 Comprehensive Plan — official county land-use and natural-environment policy context.
- About Navajo County — county overview of communities and natural resources.
Green Map creates custom-edited map images using open geographic data sources such as geoBoundaries, Natural Earth, OpenStreetMap, and government open data.
These maps are edited visual materials, not raw data files, and are provided for education, documents, presentations, and graphic reference.