The Pima County Arizona Land Cover Map set covers a county where shrubland occupies 90.26% of the 2025 classification, yet the developed surface is strongly concentrated in the eastern part of the county. Developed land accounts for 4.65%, while grassland, forest, wetlands, agriculture, and water appear in much smaller shares. The contrast between a vast shrub-dominated landscape and one large urban concentration is the clearest feature across the four maps.
Four original JPG maps are available in one download: current land cover, forest and farmland, impervious/developed land, and a 1985–2025 change comparison. The maps are useful for county-scale reference, lessons, presentations, and broad environmental comparison. They do not show parcel boundaries, zoning, ownership, or legal wetland limits, so those questions require separate official records.
Table of Contents
Why the eastern development cluster stands out
Pima County’s official overview says more than 95 percent of county residents live in the Tucson metropolitan area in the eastern part of the county. That population pattern provides useful context for the large developed patch seen on the maps. The classification itself does not measure population density, but it clearly separates the heavily developed eastern area from the much more sparsely developed central and western portions of the county.
Current land cover: a shrub-dominated county with small but distinct exceptions
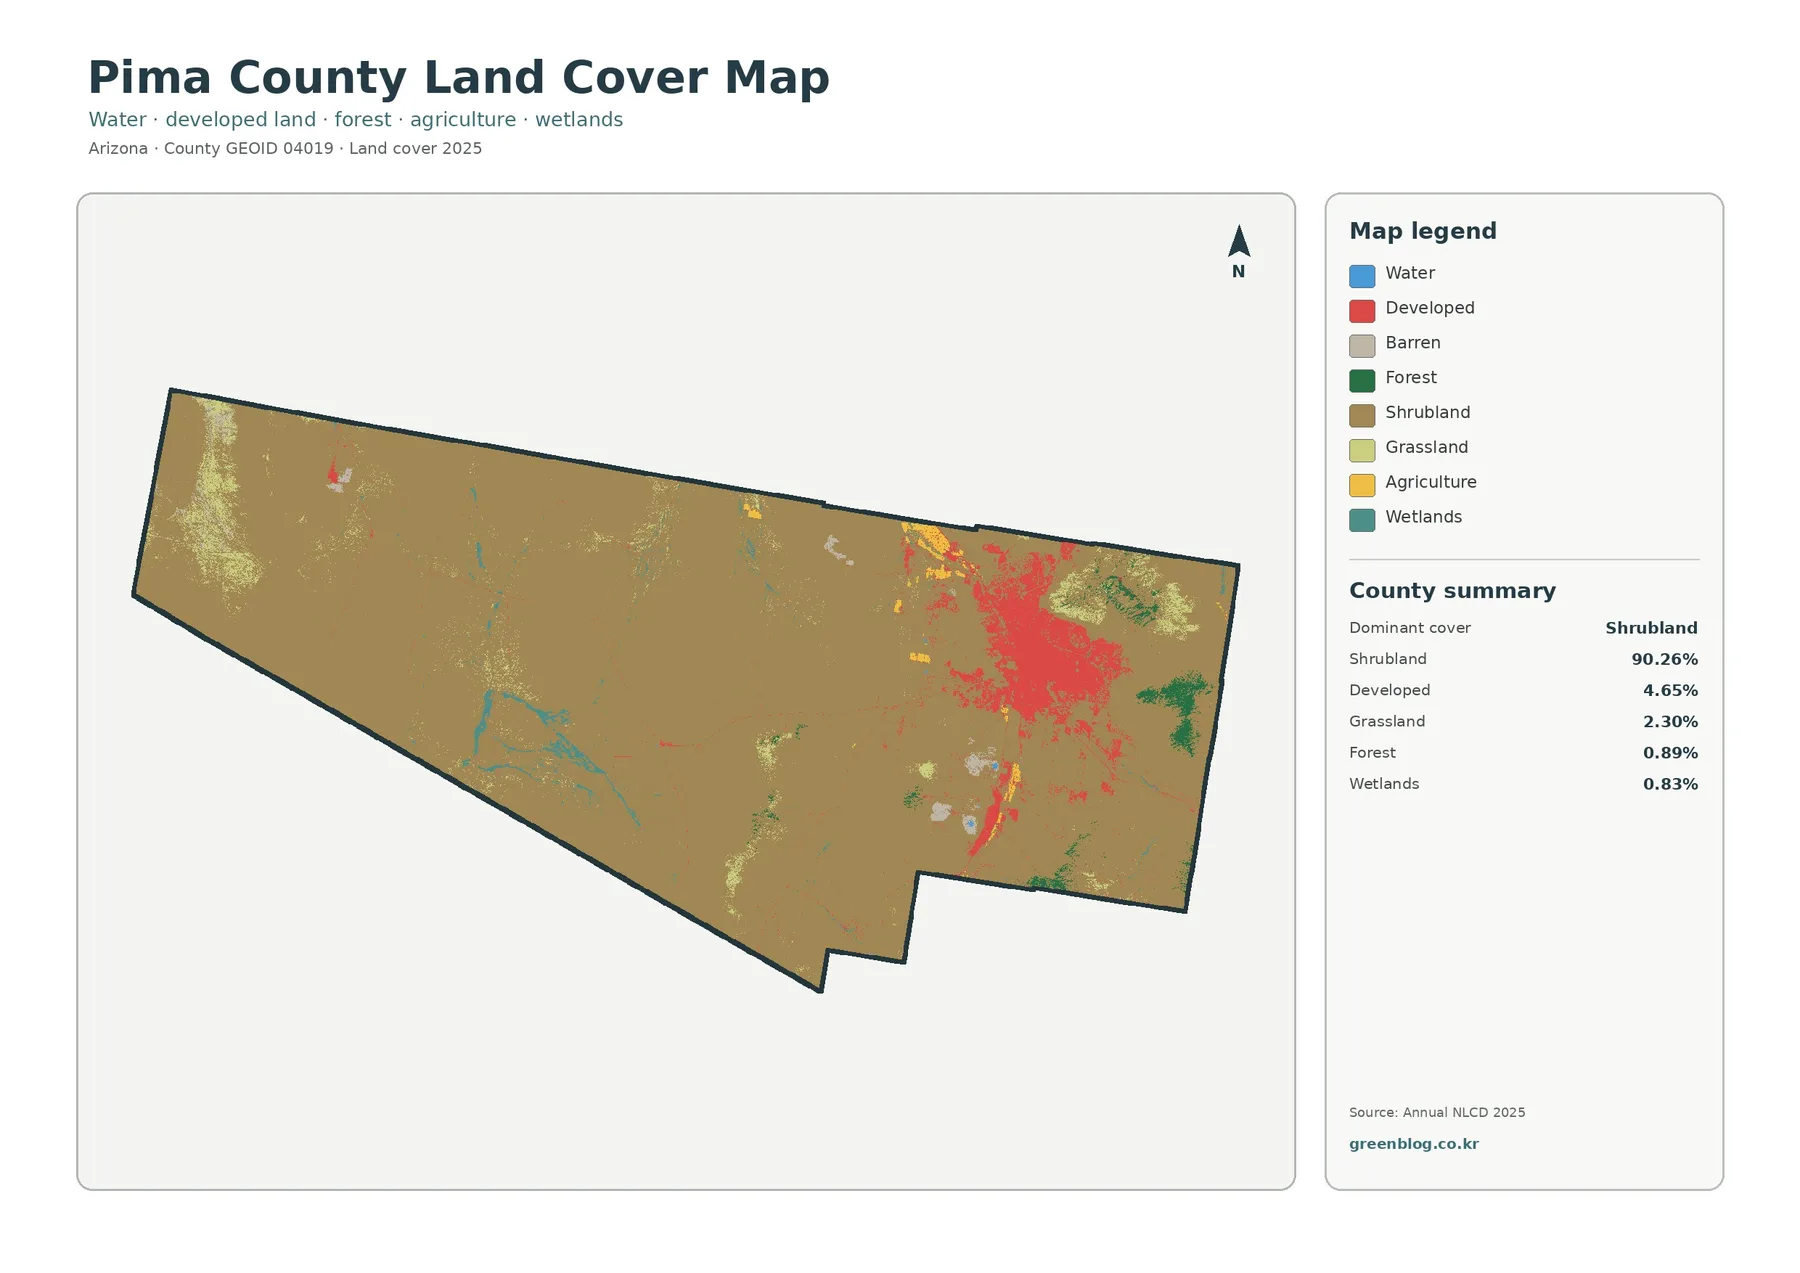
The general 2025 map is dominated by the brown shrubland class from the western boundary across most of the county interior. The eastern developed area interrupts that continuous cover with a large red cluster and several thinner extensions. Green forest patches appear in limited eastern uplands, while lighter grassland and barren areas are scattered in smaller pieces. Agriculture is visible as small yellow patches rather than a broad continuous farming zone.
Impervious surface shows where built materials are most concentrated
The developed-land total becomes more informative when it is compared with impervious surface. Impervious surface means pavement, rooftops, parking lots, and other hard materials that limit the infiltration of water. Pima County has a mean impervious value of 1.73%, and 1.44% of the county falls in cells with at least 50% impervious cover. Both values are lower than the 4.65% developed-land share because developed classes can include vegetation, soil, and other permeable surfaces.
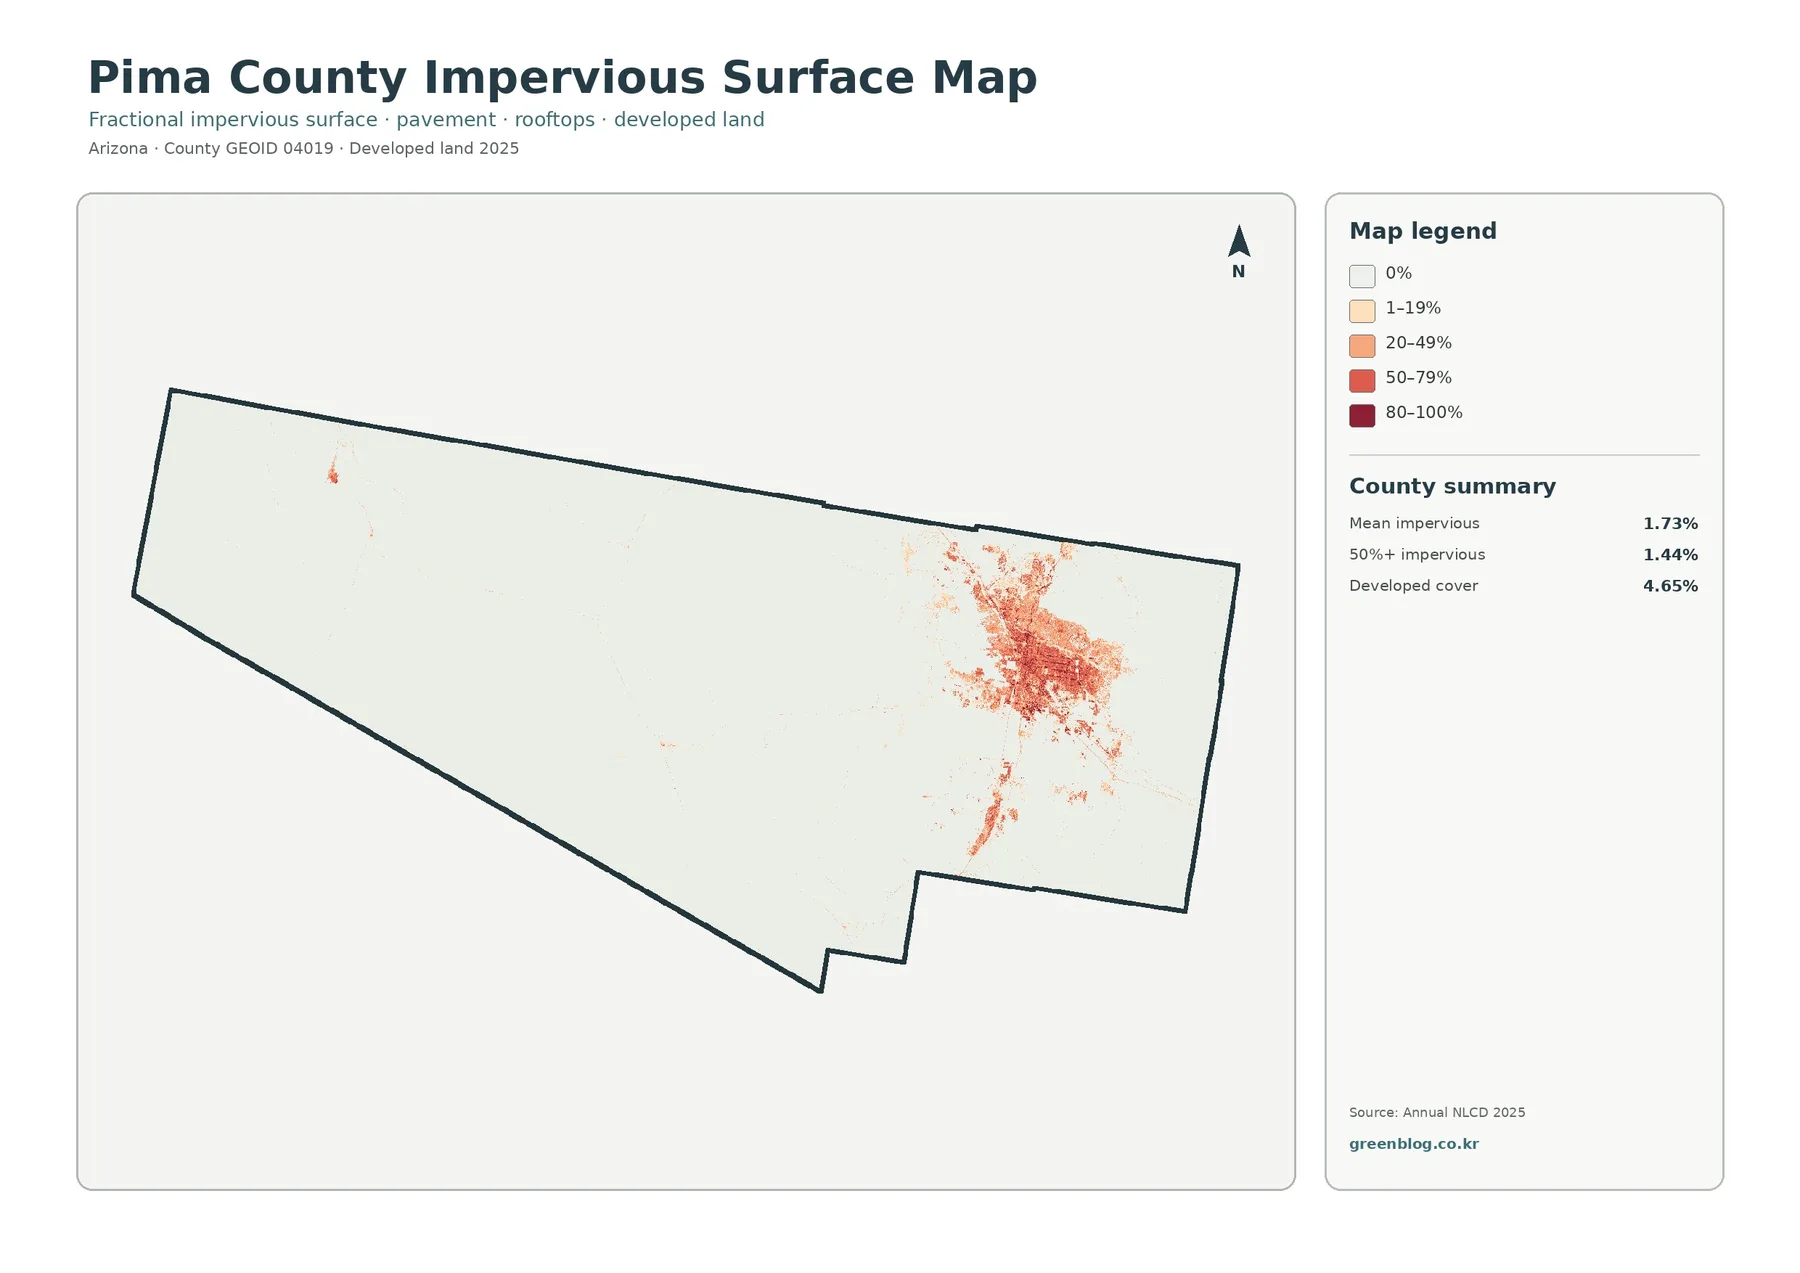
Most of the map is nearly white, representing zero or very low impervious cover. Orange and red intensities form a dense eastern cluster, with lower-intensity development spreading outward from the center. A few small hard-surface patches appear elsewhere, including the far west, but they do not approach the size of the eastern concentration. This specialized map is therefore much better than the general land-cover map when the question is specifically about built surfaces.
Forest, agriculture, grassland, wetlands, and water are easier to isolate
The forest-and-farmland view removes much of the developed visual complexity and makes the smaller natural and agricultural classes easier to find. The summary reports 0.89% forest, 0.46% agriculture, 2.30% grassland, 90.26% shrubland, 0.83% wetlands, and 0.02% water. Shrub and grass still dominate the image, but green forest patches and yellow agricultural areas stand out more clearly against the simplified background.
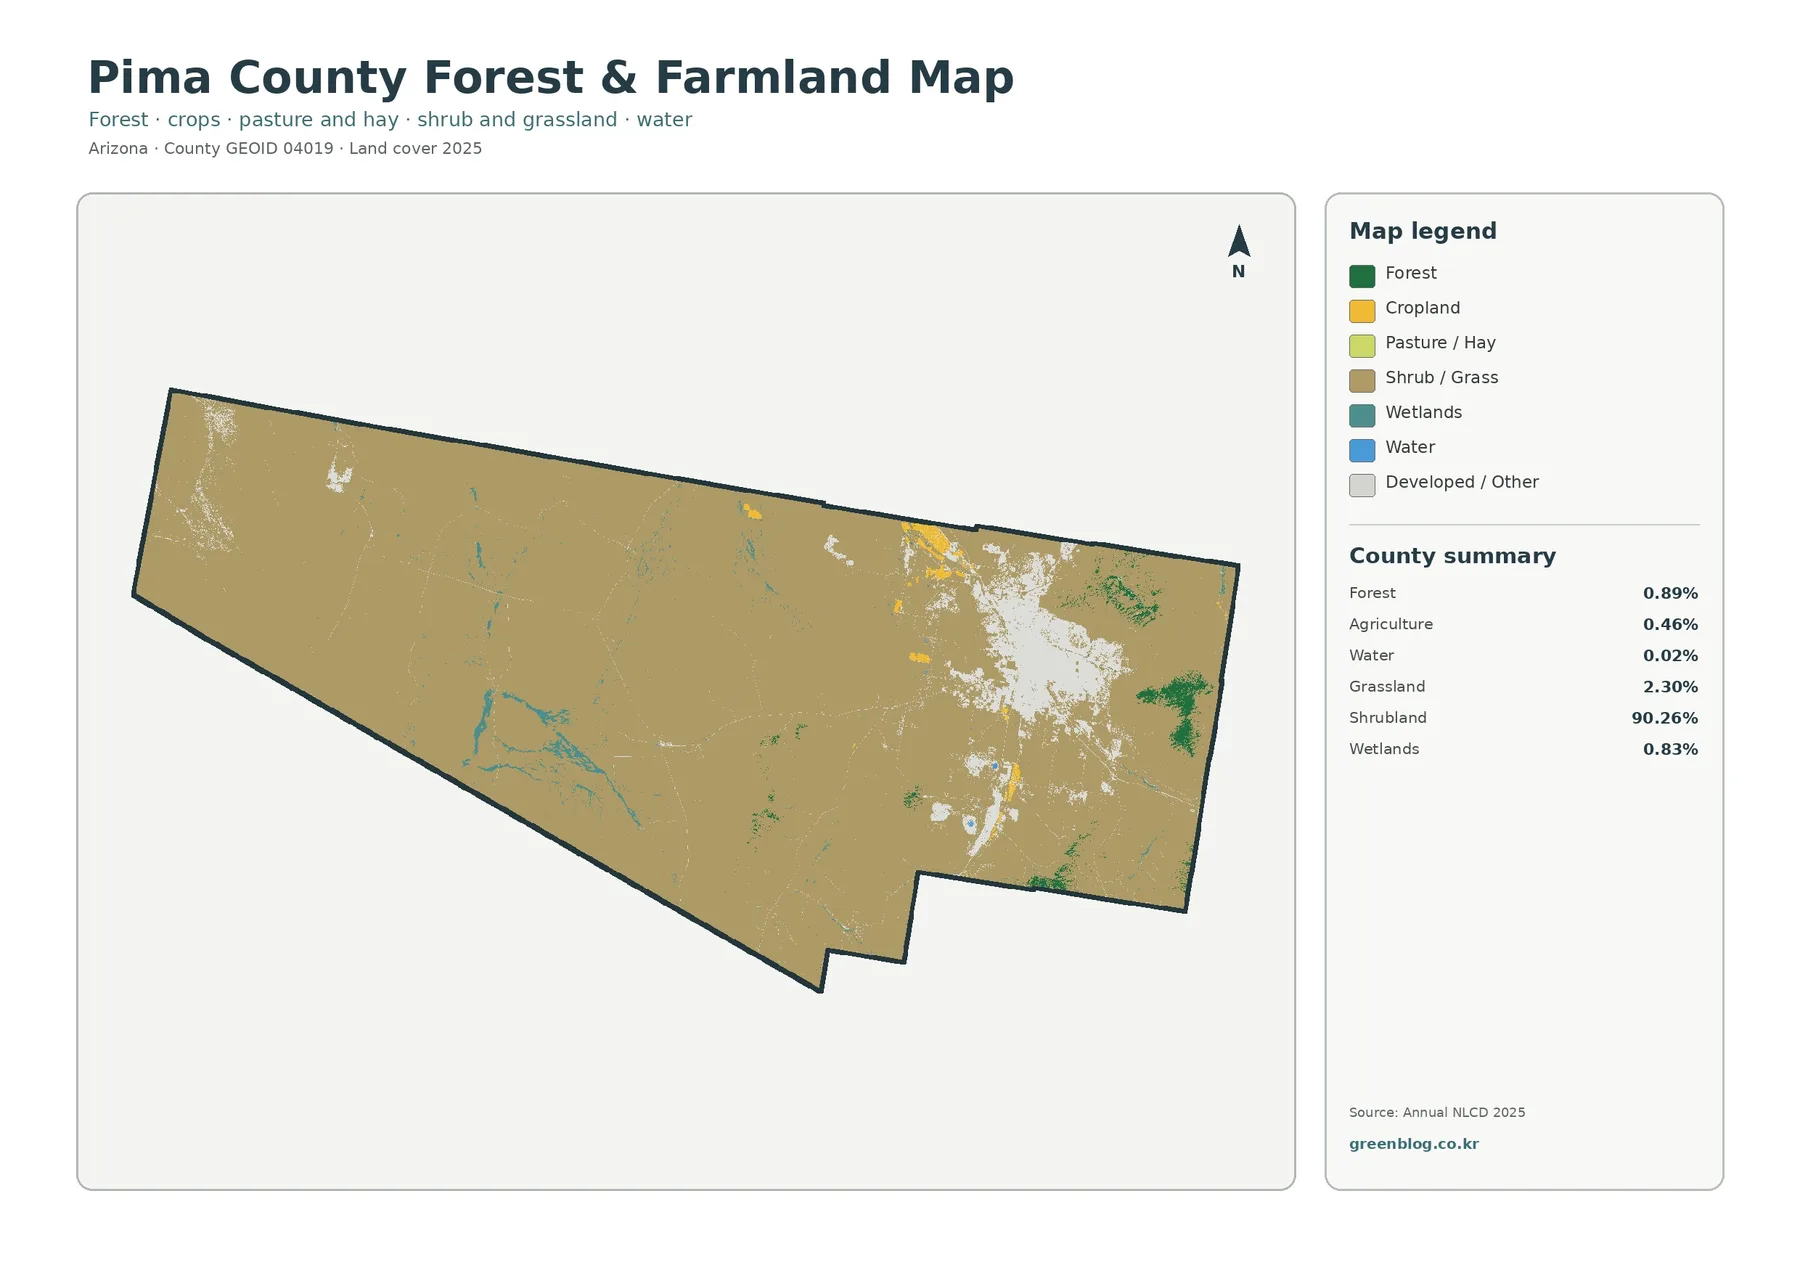
Pima County describes a landscape that ranges from low desert valleys to forest on high mountains such as Mount Lemmon. That official geographic context helps explain why forest can be a small countywide percentage while still forming visually distinct upland patches. The map itself does not label peaks or elevation, so it should not be used to assign every green cell to a named mountain. It simply shows where the forest class occurs within the county boundary.
The 1985–2025 map separates change from current condition
The change map compares classified land cover in 1985 and 2025. It reports a total class difference of 6.10%. Within the listed summary, 2.01% changed to developed, 0.98% is marked as forest loss, 0.17% as agricultural loss, and 2.89% as other class difference. The legend also includes a wetland-difference category, but the summary panel does not provide a separate percentage for it, so no wetland value is calculated or inferred here.
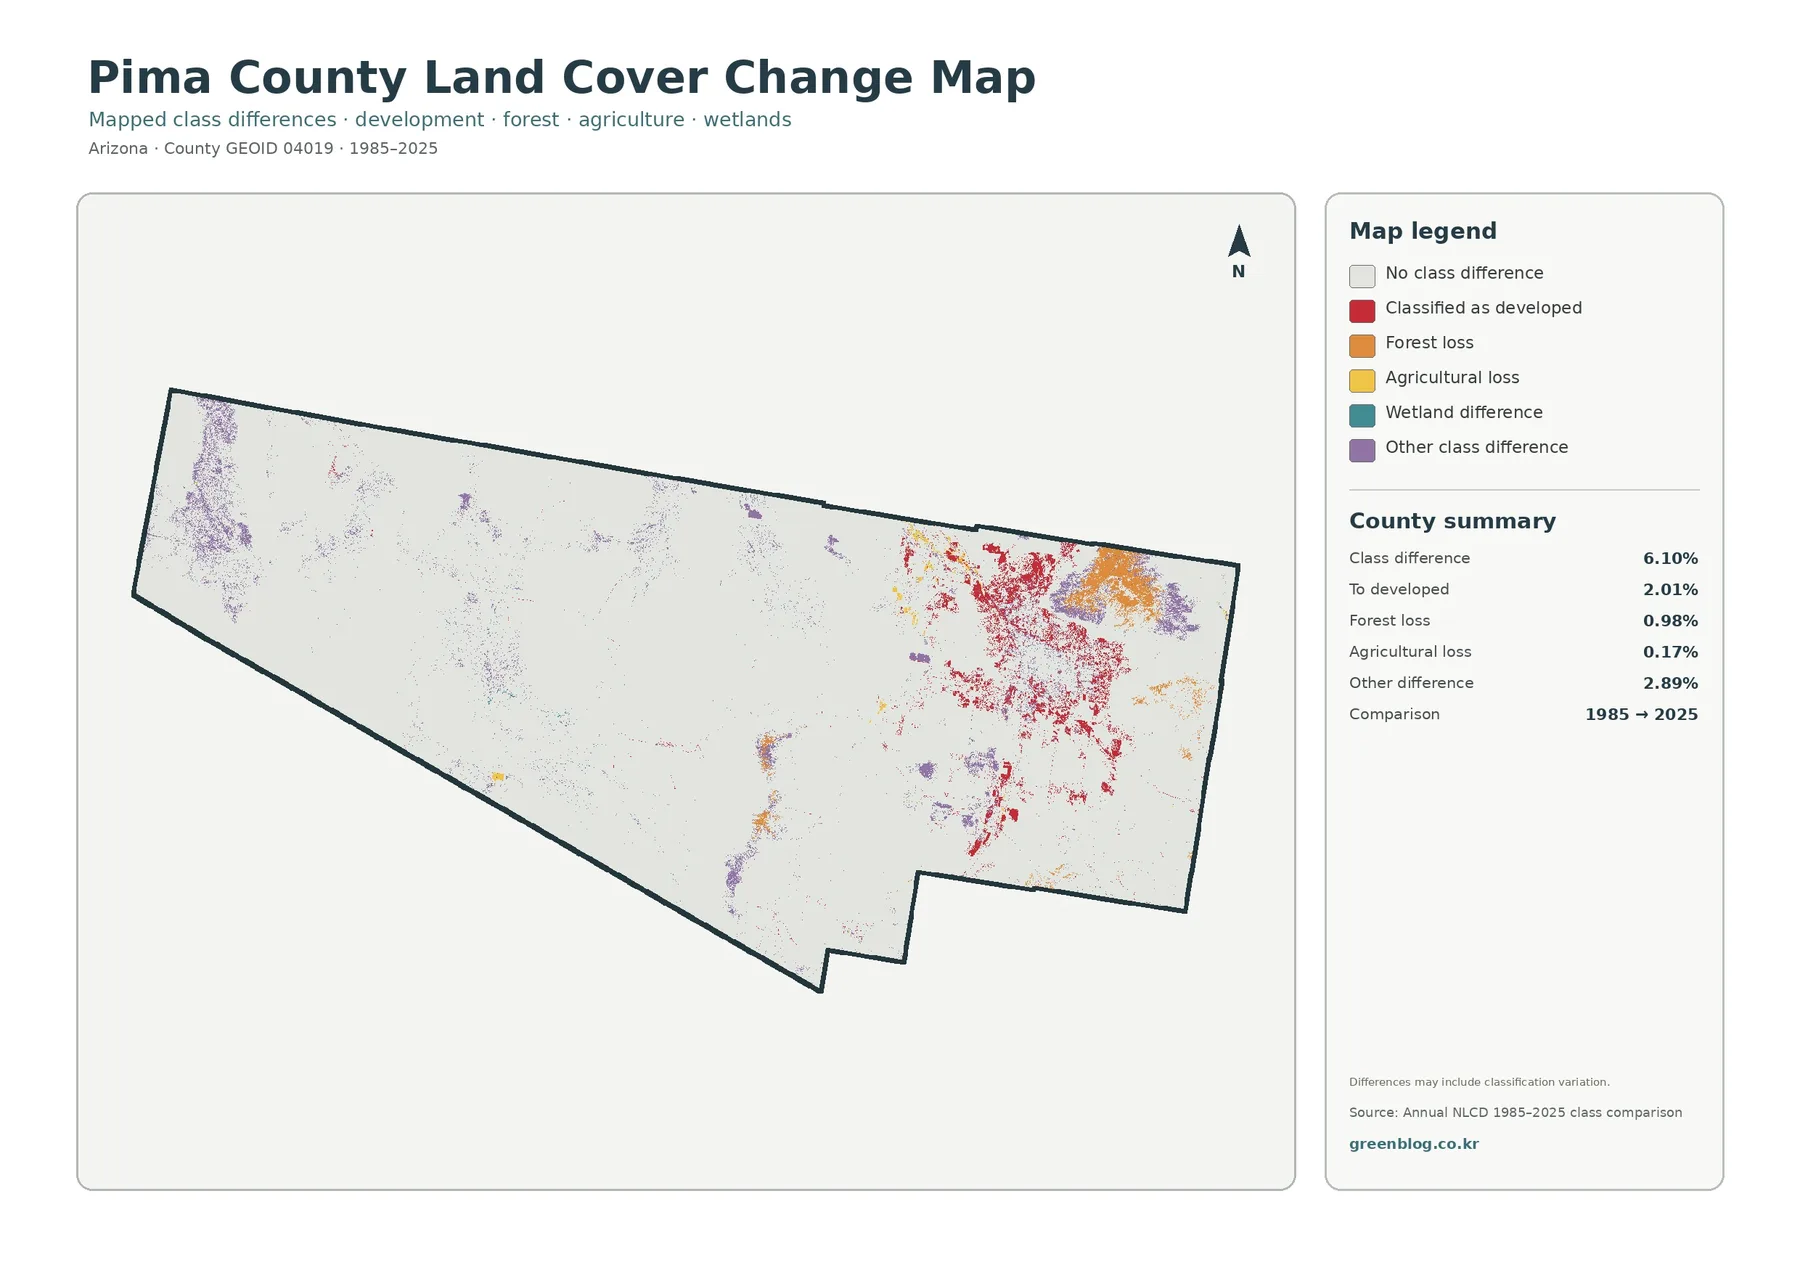
Red “to developed” pixels are concentrated around the large eastern developed area and extend across a wider zone than the darkest impervious center. Orange forest-loss patches appear in parts of the eastern uplands, while purple other-class differences are scattered in both eastern and western portions of the county. The distribution is not uniform, which means a single countywide change percentage cannot describe what happened in every part of Pima County.
A class difference is not automatically proof of a specific land-use event. The map itself notes that differences may include classification variation. Raster boundaries can shift slightly between dates, mixed pixels can receive different classes, and changes in imagery or classification can affect how a cell is labeled. A red cell should not be assigned to a particular subdivision or road project without supporting local evidence, and an orange forest-loss cell should not be attributed to fire, logging, drought, or another cause from this map alone.
County conservation planning provides context, not a replacement legend
Pima County’s Sonoran Desert Conservation Plan was created to balance protection of natural and cultural resources with community growth. The county identifies critical habitat, biological connections, riparian areas, mountain parks, and ranch conservation among the plan’s major elements. Its Conservation Lands System covers roughly two million acres in eastern Pima County. This official context is useful because it shows that large areas of desert and mountain landscape are actively considered in county planning rather than treated as empty space.
A practical workflow for using all four Pima County maps
For a quick county overview, begin with the general map and identify the overwhelming shrubland background, the eastern developed concentration, and the smaller forest, grassland, agricultural, wetland, and water features. Then switch to the impervious map when the question becomes urban intensity rather than land-cover category. This second step separates a generally developed cell from places where hard surfaces occupy a high share of the raster cell.
Download the four original Pima County JPG maps
Each source JPG is 2480 × 1754 pixels. The package preserves those original dimensions rather than enlarging the images and describing them as a higher-resolution product. If you need to print the map, test whether the legend remains readable at the intended size. For slides and documents, keep the original aspect ratio so the county shape and legend are not distorted.
Resolution, raster cells, and date limits
Annual NLCD is a Landsat-based raster product at 30-meter resolution. In plain language, the landscape is divided into 30-meter cells and each cell receives a classification or related value. A single cell can contain more than one real-world surface, such as shrubs, bare soil, a narrow road, and a building. Mixed pixels and simplified edges are therefore normal at this scale.
The current maps represent 2025 classifications. Construction, wildfire, vegetation recovery, water changes, or other events after the data period will not appear until later products reflect them. The change image summarizes a comparison between 1985 and 2025; it does not display every intermediate year or identify the exact date when a particular cell changed class.
Frequently Asked Questions
What is the dominant land-cover class in Pima County?
Shrubland is the dominant 2025 class at 90.26%. Developed land is 4.65%, grassland 2.30%, forest 0.89%, and wetlands 0.83%, with agriculture and open water making up smaller shares in the specialized summary.
Why is developed land 4.65% while mean impervious surface is only 1.73%?
Developed land is a land-cover classification, while impervious surface measures the share of a cell covered by hard materials such as pavement and rooftops. A developed cell can still contain soil and vegetation, so the two countywide values are not expected to match.
Does the 6.10% class difference mean 6.10% of the county was newly developed after 1985?
No. The total class difference is 6.10%, but the summary lists 2.01% as changing to developed. It also includes forest loss, agricultural loss, other class differences, and a wetland-difference class without a separate summary percentage. Classification variation can also contribute to mapped differences.
Can these maps be used for zoning, parcel research, or legal wetland decisions?
No. They are generalized county-scale land-cover maps. Parcel boundaries, ownership, zoning, development rights, and regulatory wetland boundaries require current records from Pima County and the relevant state or federal agencies.
Map File Information
Pima County Land Cover Four-Map Package
- File Type: Four JPG files in one ZIP archive
Related Maps
- Apache County Arizona Land Cover Map
- Cochise County Arizona Land Cover Map
- Coconino County Arizona Land Cover Map
Sources and further reading
- MRLC Annual NLCD Data — official access point for Annual NLCD land-cover products and related datasets.
- USGS Annual NLCD Land Cover Classification — explains the land-cover classes used in Annual NLCD products.
- Pima County: About Pima County — official county context for size, Tucson metropolitan concentration, and the county’s desert-to-mountain landscape.
- Pima County Sonoran Desert Conservation Plan — county information on habitat, riparian areas, mountain parks, ranch conservation, and growth planning.
Green Map creates custom-edited map images using open geographic data sources such as geoBoundaries, Natural Earth, OpenStreetMap, and government open data.
These maps are edited visual materials, not raw data files, and are provided for education, documents, presentations, and graphic reference.