Jackson County, Texas is easiest to understand by starting with Edna and then following the roads, rivers, and low coastal terrain outward from the county seat. The maps on this page show the county boundary and road network, a simplified city-connection view, named rivers and bays, and countywide elevation. You can also download the matching high-resolution A3 JPG files in one ZIP archive for printing, classroom work, trip planning, or local reference.
The county sits on the Texas Gulf Coastal Plain, where the landscape changes gradually rather than through dramatic mountain relief. Edna and Ganado occupy the central and northeastern part of the road network, while La Ward, Lolita, and Vanderbilt help define the southern half. Water becomes increasingly important toward the south, where the Lavaca and Navidad river systems connect with bays and very low ground. Reading the road, water, and elevation maps together makes those relationships much clearer than a boundary outline alone.
Table of Contents
Edna as the Reference Point for Roads and Communities
The general county map places Edna near the center of the most visible road connections. Route 59 reaches west and northeast from the city, while 111 runs eastward across the county. The 522 route joins the network northeast of Edna, and roads marked 172 and 35 become important farther south near La Ward and the lower part of the county. This arrangement makes Edna a practical reference point without implying that every trip in Jackson County passes through one central hub.
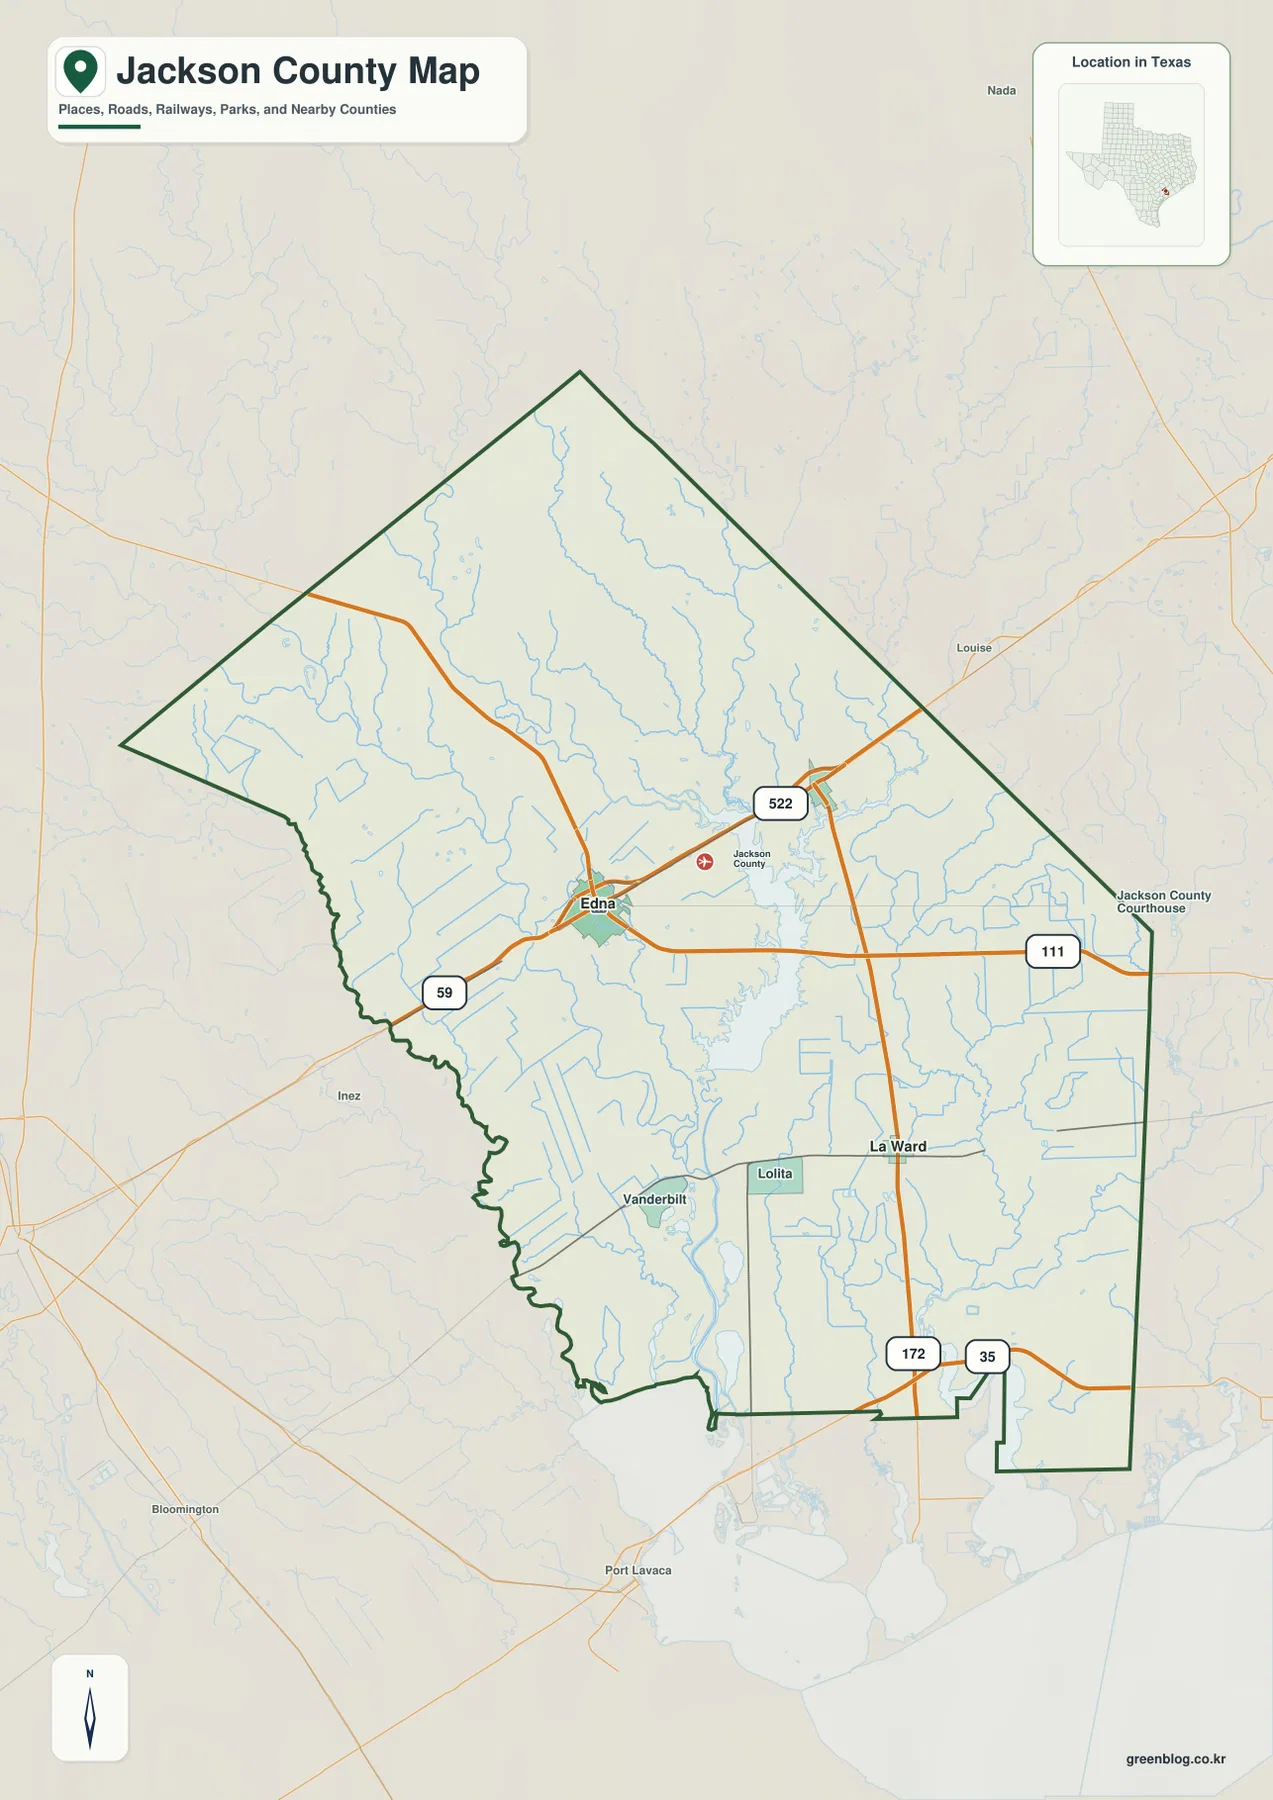
Ganado lies northeast of Edna along the same broad road corridor, while La Ward is south of the county seat. Lolita and Vanderbilt sit to the west of La Ward, so the southern communities are spread across a wider area rather than forming one compact town cluster. Labels outside the county, including Louise, Inez, and Port Lavaca, provide additional orientation and show that the road network continues well beyond the county line.
The boundary itself also has useful visual cues. The southwestern edge is irregular, while the eastern side includes long straighter segments and a distinctive southeastern extension. Those shapes help with identification, but the roads are more useful for understanding how people actually move between places. When using the map for a route or field visit, first locate Edna and the destination community, then trace the connecting road rather than relying only on compass direction.
Comparing Edna, Ganado, and La Ward at a Glance
The city-connection map reduces the amount of detail so the relative positions of three selected places are easy to compare. Edna is shown as the hub with a population label of 6,027. Ganado is labeled 1,534 and about 9 miles from Edna, while La Ward is labeled 178 and about 14 miles away. These mileage figures are straight-line distances between the mapped city points, not driving distances along the road network.
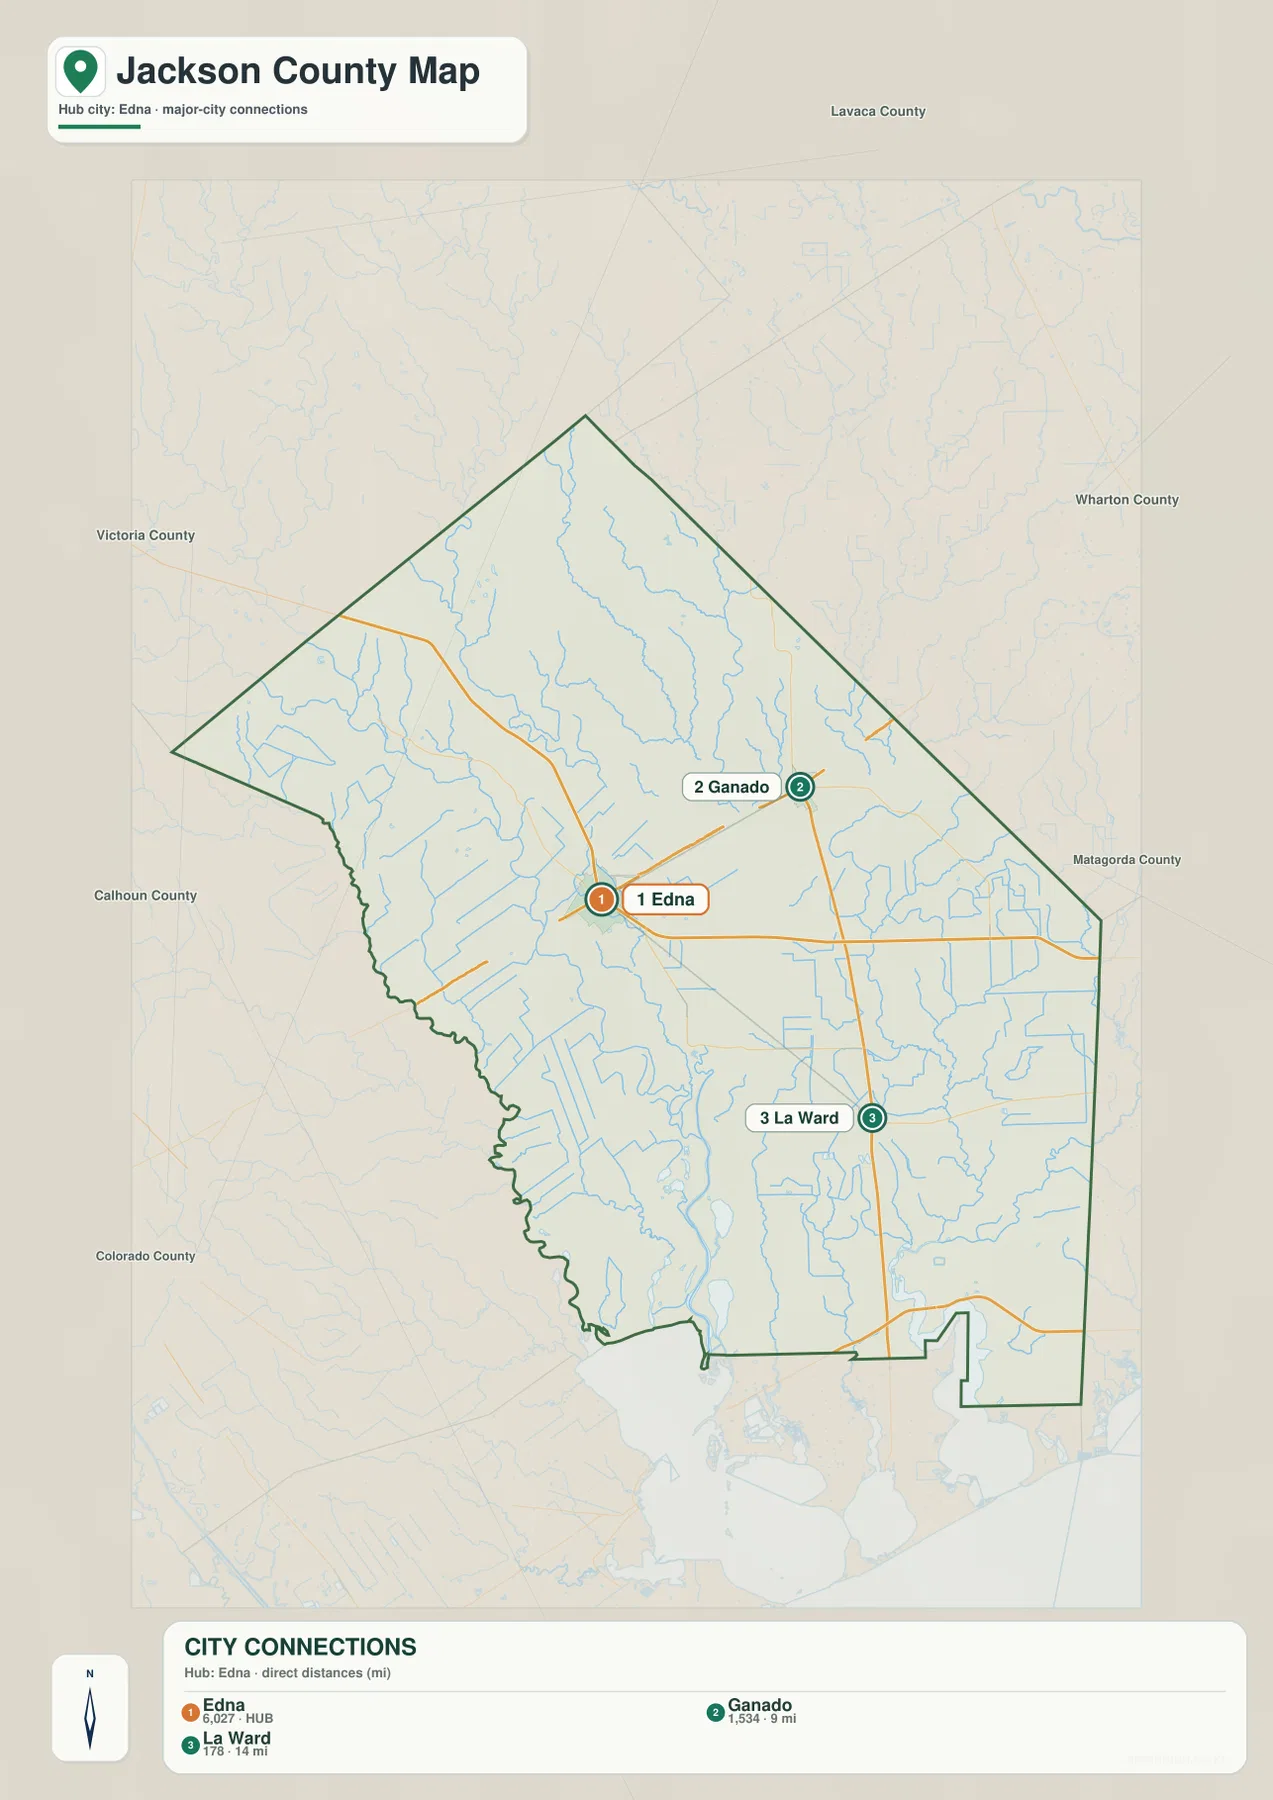
Ganado’s position northeast of Edna makes the pair useful for understanding the main northeastern travel direction. La Ward points toward a different part of the county, and the general map adds Lolita and Vanderbilt nearby to show that the southern settlement pattern is broader than the city-connection diagram alone suggests. The simplified city map is therefore best for quick orientation, while the general map should be used when the exact road path matters.
This distinction is especially useful in printed material. A classroom handout may only need Edna, Ganado, and La Ward to explain relative location, but a traveler or researcher will usually need the more detailed road map. Because the direct-distance lines do not follow highways, they should not be treated as travel routes or time estimates. They are a visual comparison tool for understanding the spacing of the selected communities.
From the Navidad and Lavaca Rivers to the Southern Bays
The terrain and water map shows a much denser network than the road map. Navidad River is labeled across the northwestern and central part of the county, while Lavaca River becomes a major feature in the south. Brushy Creek, Dry Creek, Mustang Creek, West Carancahua Creek, and East Carancahua Creek are among the named tributaries and smaller streams. Together they show how water is distributed across both the interior and the lower coastal side of Jackson County.
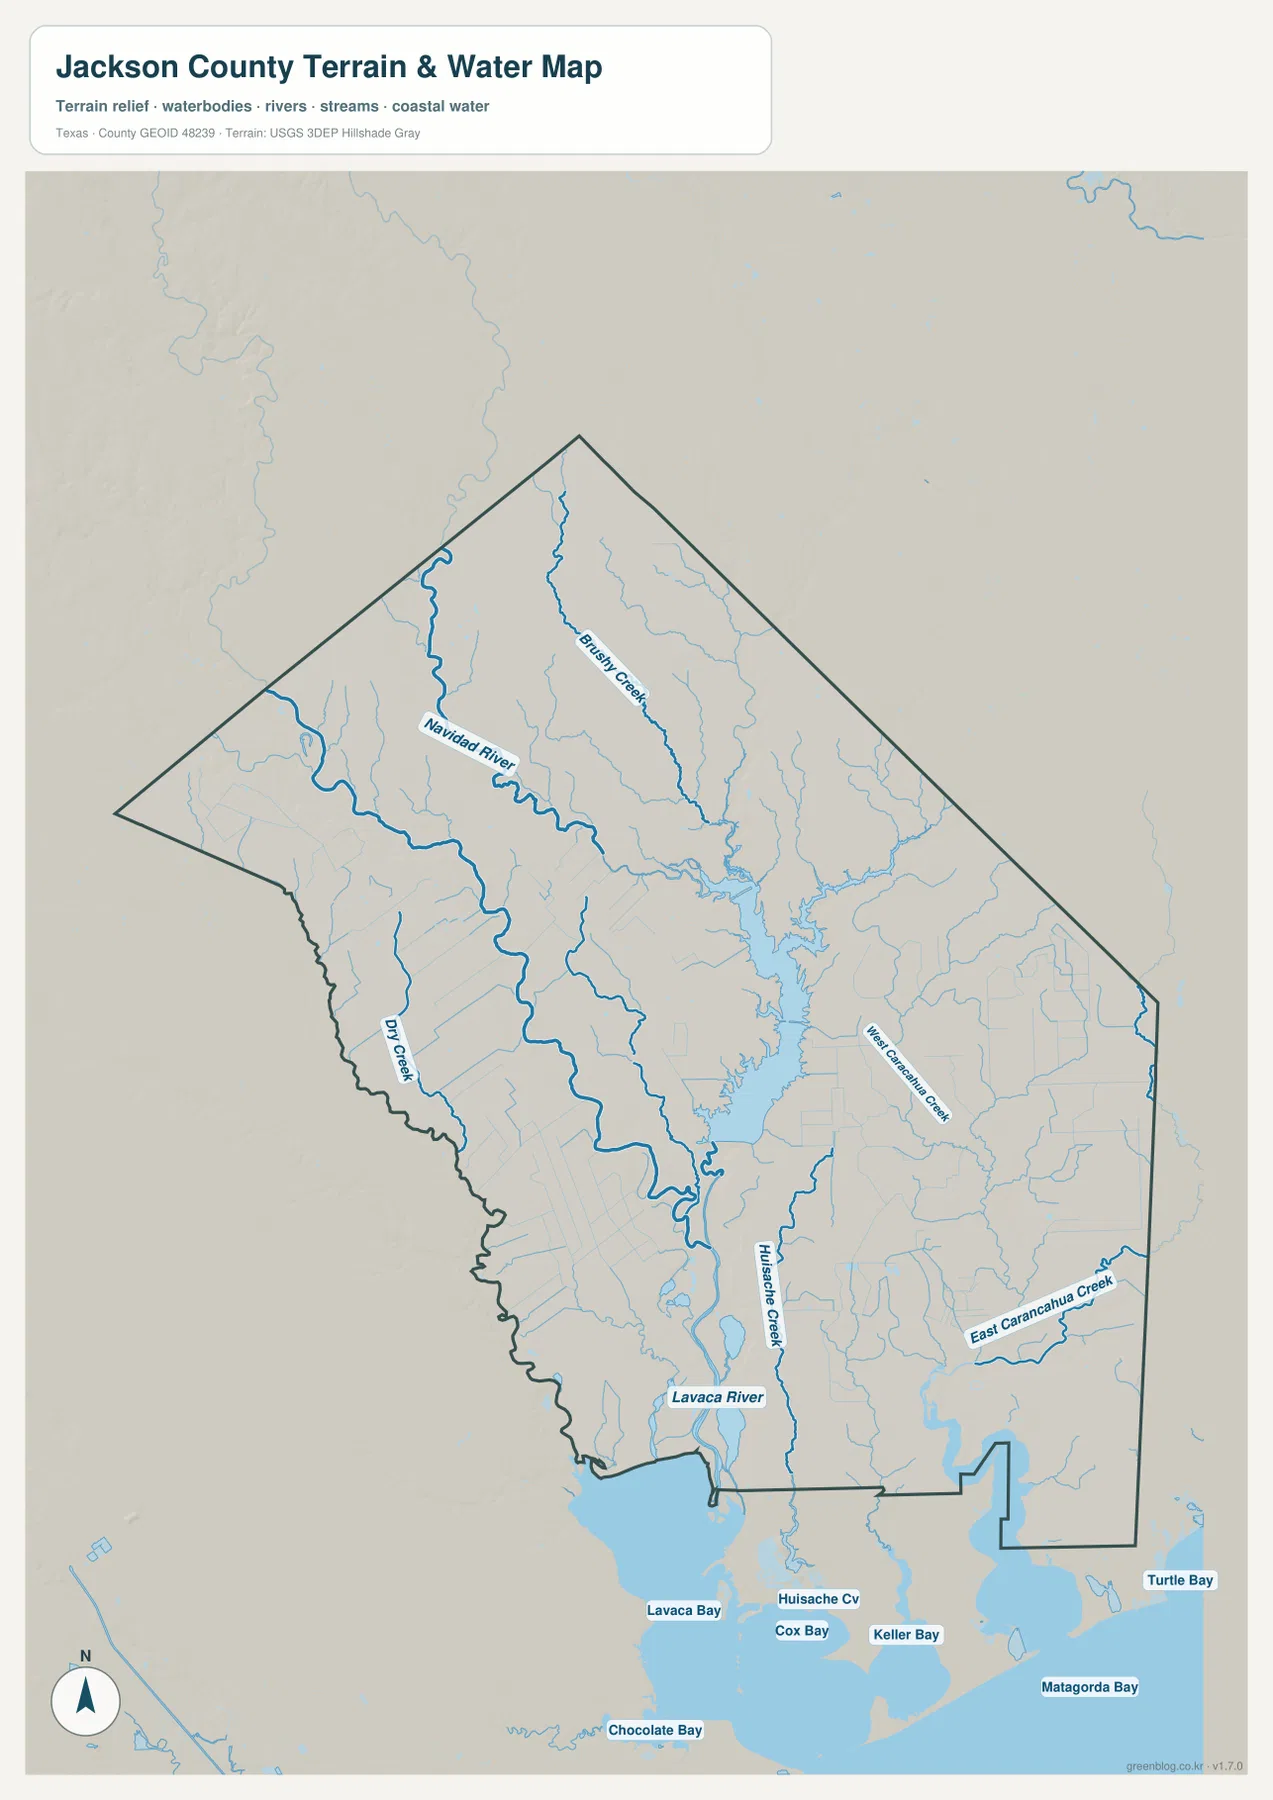
At the southern edge, Lavaca Bay is the largest named bay immediately associated with the county. The map also labels Huisache Cove, Cox Bay, Keller Bay, and Chocolate Bay, with Turtle Bay and Matagorda Bay farther east. This transition from inland streams to broad bay water is one of the clearest geographic changes on the page. It explains why the southern part of the county looks different from the more inland northern half even though the overall elevation is low everywhere.
The water map should be used as a location and terrain reference, not as a flood-risk, parcel, or navigation chart. It does not provide water depth, flood probabilities, or legal access information. Its strength is showing how named rivers and creeks relate to the county boundary and to the coastal water south of the county. For local orientation, compare the water map with the road map to see where major travel routes must cross or work around the drainage network.
A Low Elevation Range That Drops Toward the Coast
The elevation map confirms that Jackson County is a low-relief county. Its legend reports an actual elevation range of about 0 to 48 meters, with a mean near 18 meters. Browns and tan colors dominate the higher northern and northwestern areas, while greens become more common through the center and toward the south. The lowest colors collect around river valleys and the broad lower terrain near the bays.
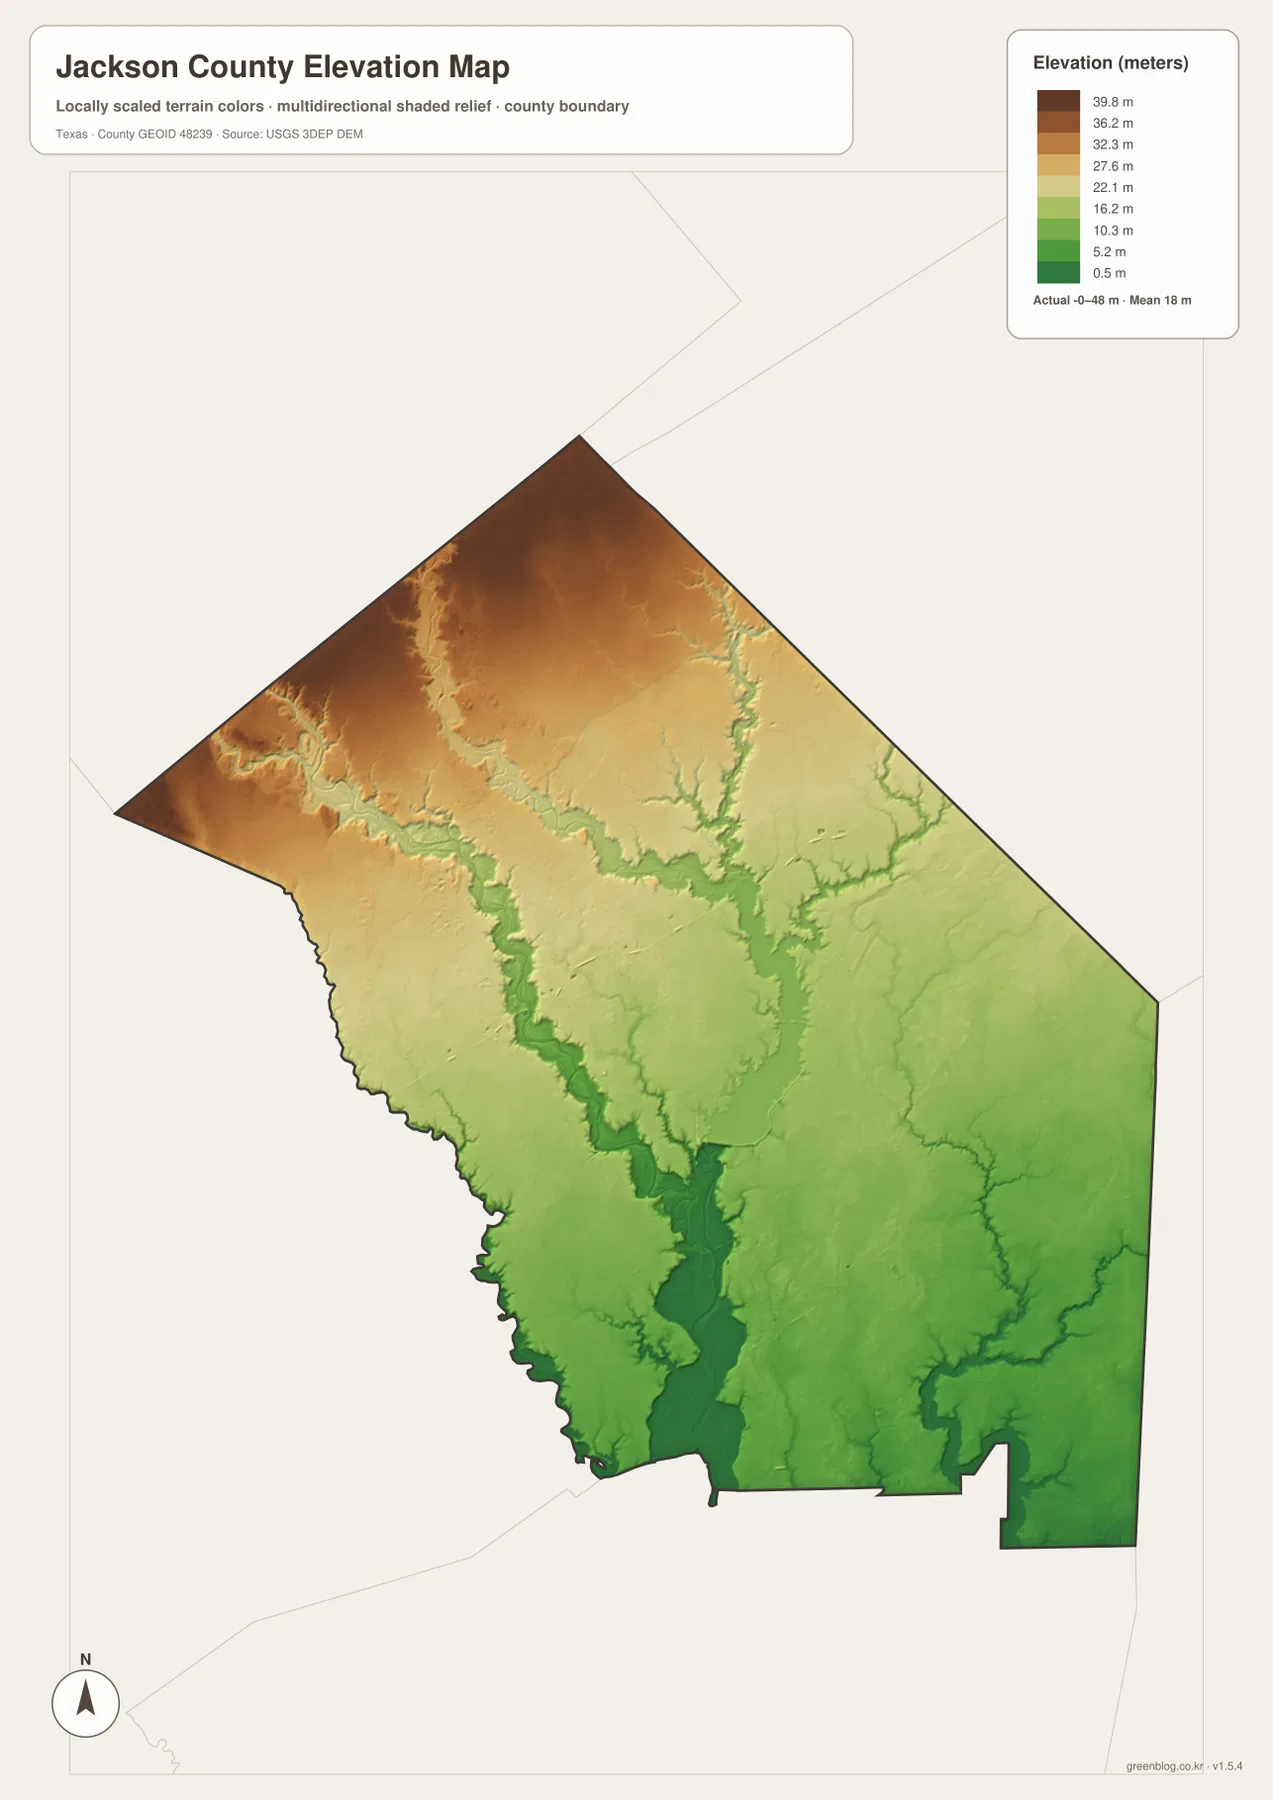
The change is gradual rather than mountainous, but it still matters when reading the water network. The Navidad and Lavaca river corridors appear as lower strips within the surrounding surface, and the southern part of the county contains a larger continuous area of low elevation. Even differences of several meters can be visually important in a county where the total elevation range is less than 50 meters.
This map is designed for county-scale comparison rather than engineering or survey work. It is useful for seeing which parts of Jackson County are relatively higher or lower, but it should not be used to determine the precise elevation of a property, road grade, or construction site. For those purposes, detailed survey data would be required. For education and general geographic reference, however, the color scale gives a clear picture of the north-to-south change.
How Jackson County Fits Between Inland and Coastal Neighbors
The city map labels Lavaca County, Wharton County, Matagorda County, Calhoun County, Victoria County, and Colorado County around Jackson County. Those neighbors help explain why the county has both inland and coastal connections. The northeast side points toward Wharton County, the south and southwest are closer to the Victoria and Calhoun area, and the southeastern side faces toward Matagorda County and the bay system.
The relationship is also visible in the elevation colors. The northern side, toward the more inland counties, is generally higher than the southern edge near the bays. Roads leaving Edna connect these different directions, while the rivers continue across administrative boundaries rather than stopping at the county line. Looking at neighboring counties as part of the same landscape makes the Jackson County boundary easier to place in a broader Texas Gulf Coast setting.
Choosing the Right Jackson County Map for the Task
Use the general map when you need the county outline, communities, and roads in one view. The city-connection map is better when the main question is how Edna, Ganado, and La Ward are positioned relative to one another. The water map is the strongest choice for named rivers, tributaries, and bays, while the elevation map gives the clearest overview of the county’s gradual drop toward the south.
Combining two maps can answer more specific questions. For example, pair the road and water maps when planning a route near the Lavaca River, or compare the water and elevation maps to see why low river corridors stand out in the southern half. Remember that the city-map mileage is direct-line distance, while the actual driving path follows the road network. The downloadable JPG files are useful when a larger print or offline reference is more convenient than the on-page WebP previews.
Frequently Asked Questions
Are the 9-mile and 14-mile city distances driving distances?
No. The city-connection map uses straight-line distances from Edna to the selected city points. The road distance to Ganado or La Ward can be longer because a vehicle must follow the actual highway and street network.
Which waterways are easiest to identify on the Jackson County map?
Navidad River and Lavaca River are the two strongest named river references. The map also labels Brushy Creek, Mustang Creek, Dry Creek, and the Carancahua Creek system, then shows those inland waters in relation to Lavaca Bay and other coastal bays to the south.
How much elevation change does Jackson County show?
The elevation map reports an actual range of about 0 to 48 meters and an average near 18 meters. The northern and northwestern areas are relatively higher, while the river corridors and southern coastal side are lower.
Sources and Reference Data
- U.S. Census Bureau TIGER/Line Shapefiles — official boundary, road, and geographic reference data.
- USGS National Hydrography — official river, stream, and water-feature reference data.
- USGS 3D Elevation Program — elevation and terrain reference data.
- USGS The National Map Viewer — map-based access to U.S. boundary, hydrography, and terrain layers.
Map File Information
The ZIP contains high-resolution A3 JPG versions of the Jackson County general map, city-connection map, water map, and elevation map. Use these files when you need a larger printable copy than the on-page WebP previews.
- Included Files: 4 map images
- File Type: JPG files inside a ZIP archive
Related Maps
- Victoria County Texas map
- Wharton County Texas map
- Aransas County Texas map
- Refugio County Texas map
- Austin County Texas map
Green Map creates custom-edited map images using open geographic data sources such as geoBoundaries, Natural Earth, OpenStreetMap, and government open data.
These maps are edited visual materials, not raw data files, and are provided for education, documents, presentations, and graphic reference.