Jack County in north-central Texas is easiest to understand by starting at Jacksboro and then following the roads, waterways, and changes in elevation around it. This page uses the supplied county, city, water, and elevation maps to show where Jacksboro, Bryson, Perrin, and Gibtown sit, how major highways cross the county, and how the West Fork Trinity River system relates to lakes and lower terrain. A downloadable ZIP with four high-resolution A3 JPG maps is also provided for printing or offline use.
Jacksboro is the clearest reference point because several major routes meet there. Bryson lies to the west, Perrin is south of Jacksboro, and Gibtown appears farther to the southeast on the county map. The spacing between these places is large enough that the road network matters as much as the labels themselves. Looking at the map in that order makes the county easier to follow without reducing it to a list of towns.
Table of Contents
Roads radiating from Jacksboro across Jack County
The county map places Jacksboro near the center of a network of numbered highways. U.S. 281 approaches from the north, passes through Jacksboro, and continues south toward Perrin. U.S. 380 reaches Jacksboro from the west through the Bryson side of the county. Around the county seat, SH 148, SH 59, and SH 114 lead in different directions, while SH 199 appears in the southeastern part of the map. This concentration of routes makes Jacksboro the most useful point for orienting yourself before tracing the smaller communities and water features.
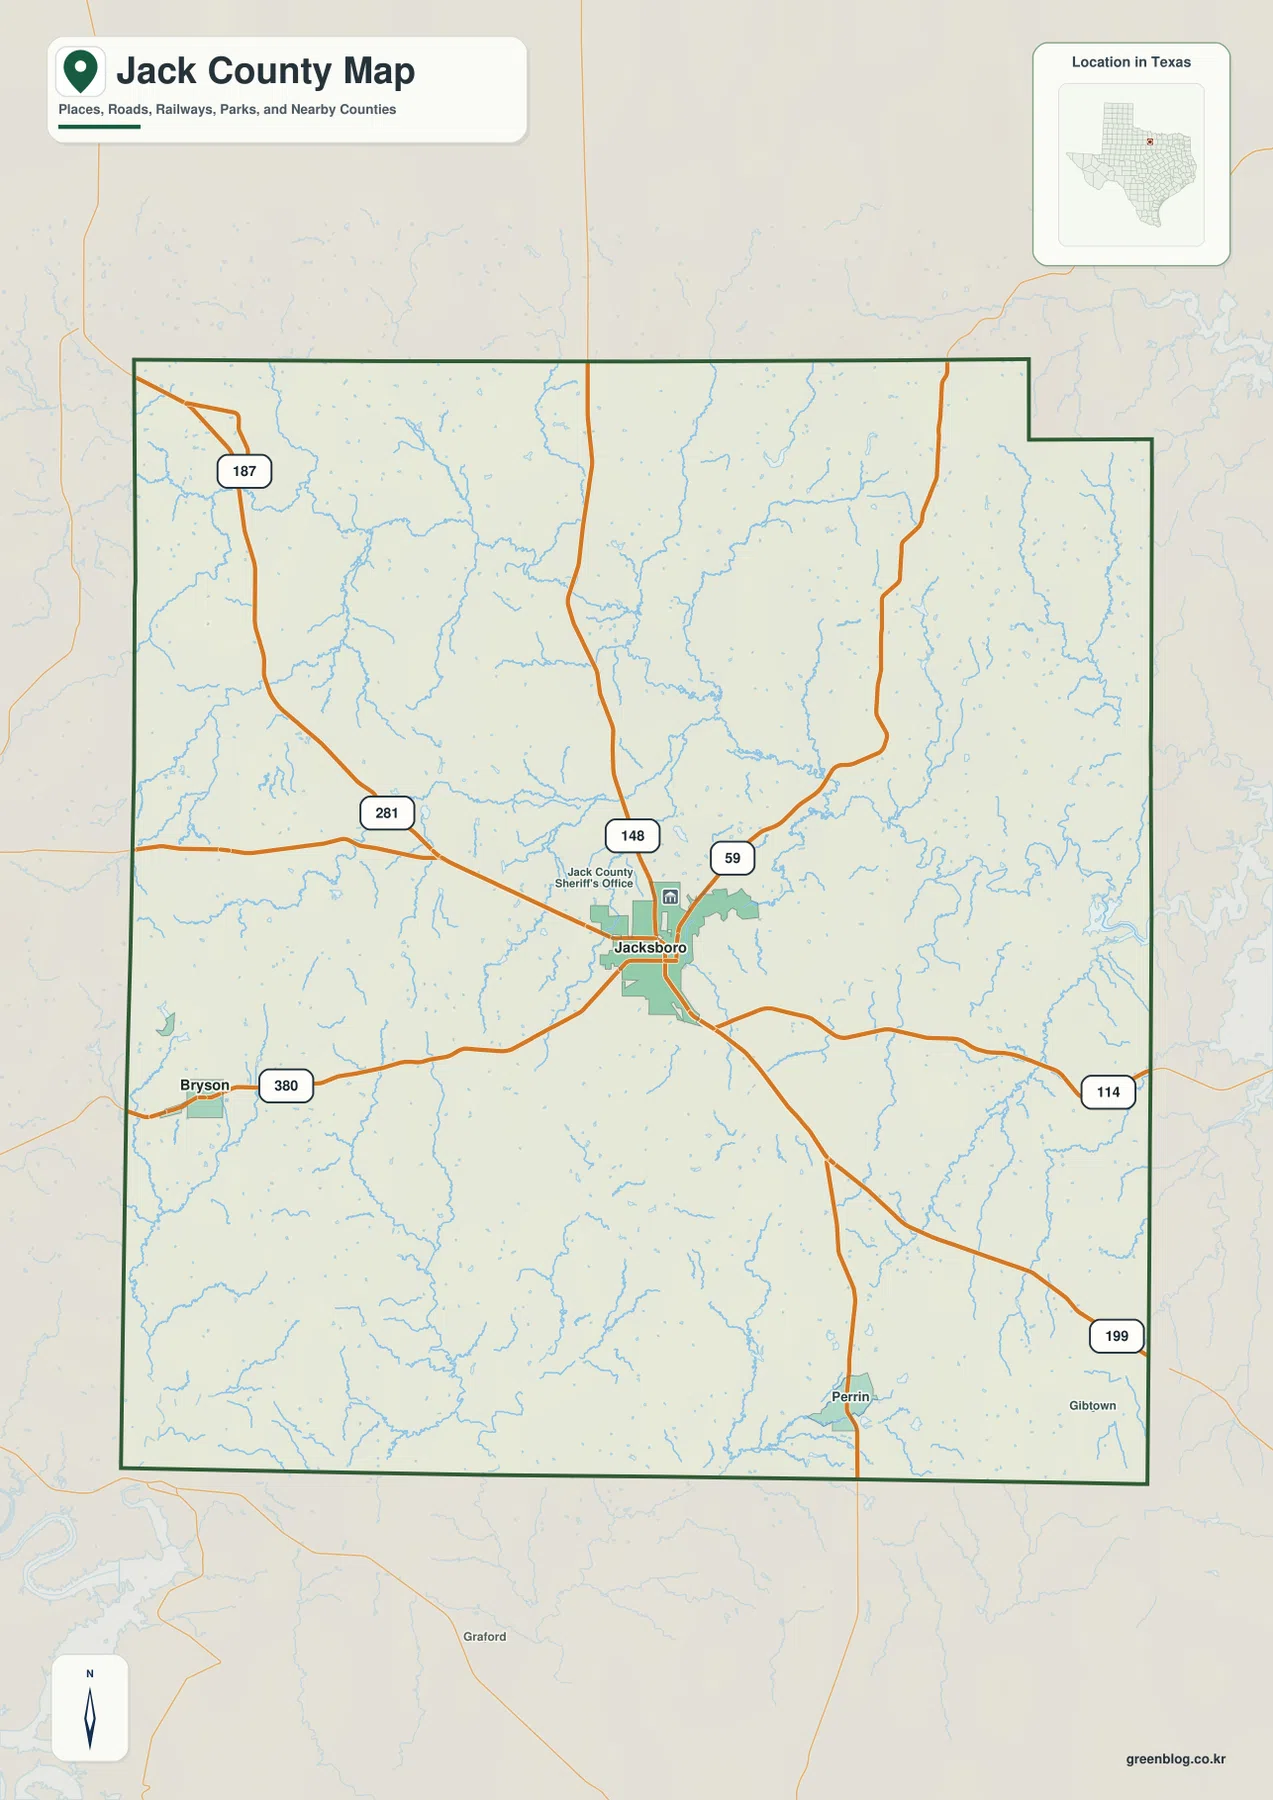
The county outline is not a simple rectangle. A stepped section along the northeastern boundary makes the shape distinctive, and neighboring county labels around the edge provide useful context for where the roads leave Jack County. For practical reading, the highways are more informative than the border alone: U.S. 281 establishes a strong north-south line through Jacksboro and Perrin, U.S. 380 links Jacksboro with the western side, and the state highways provide additional eastward and southeastward connections.
Why the city map emphasizes Jacksboro and Bryson
The city distribution map deliberately simplifies the settlement picture. It ranks Jacksboro first and Bryson second rather than trying to label every smaller place shown on the broader county map. Jacksboro sits near the center, while Bryson is clearly separated to the west. That simple two-point view is helpful when the goal is to compare the main population centers without the visual competition of highway numbers, lakes, and many minor labels.
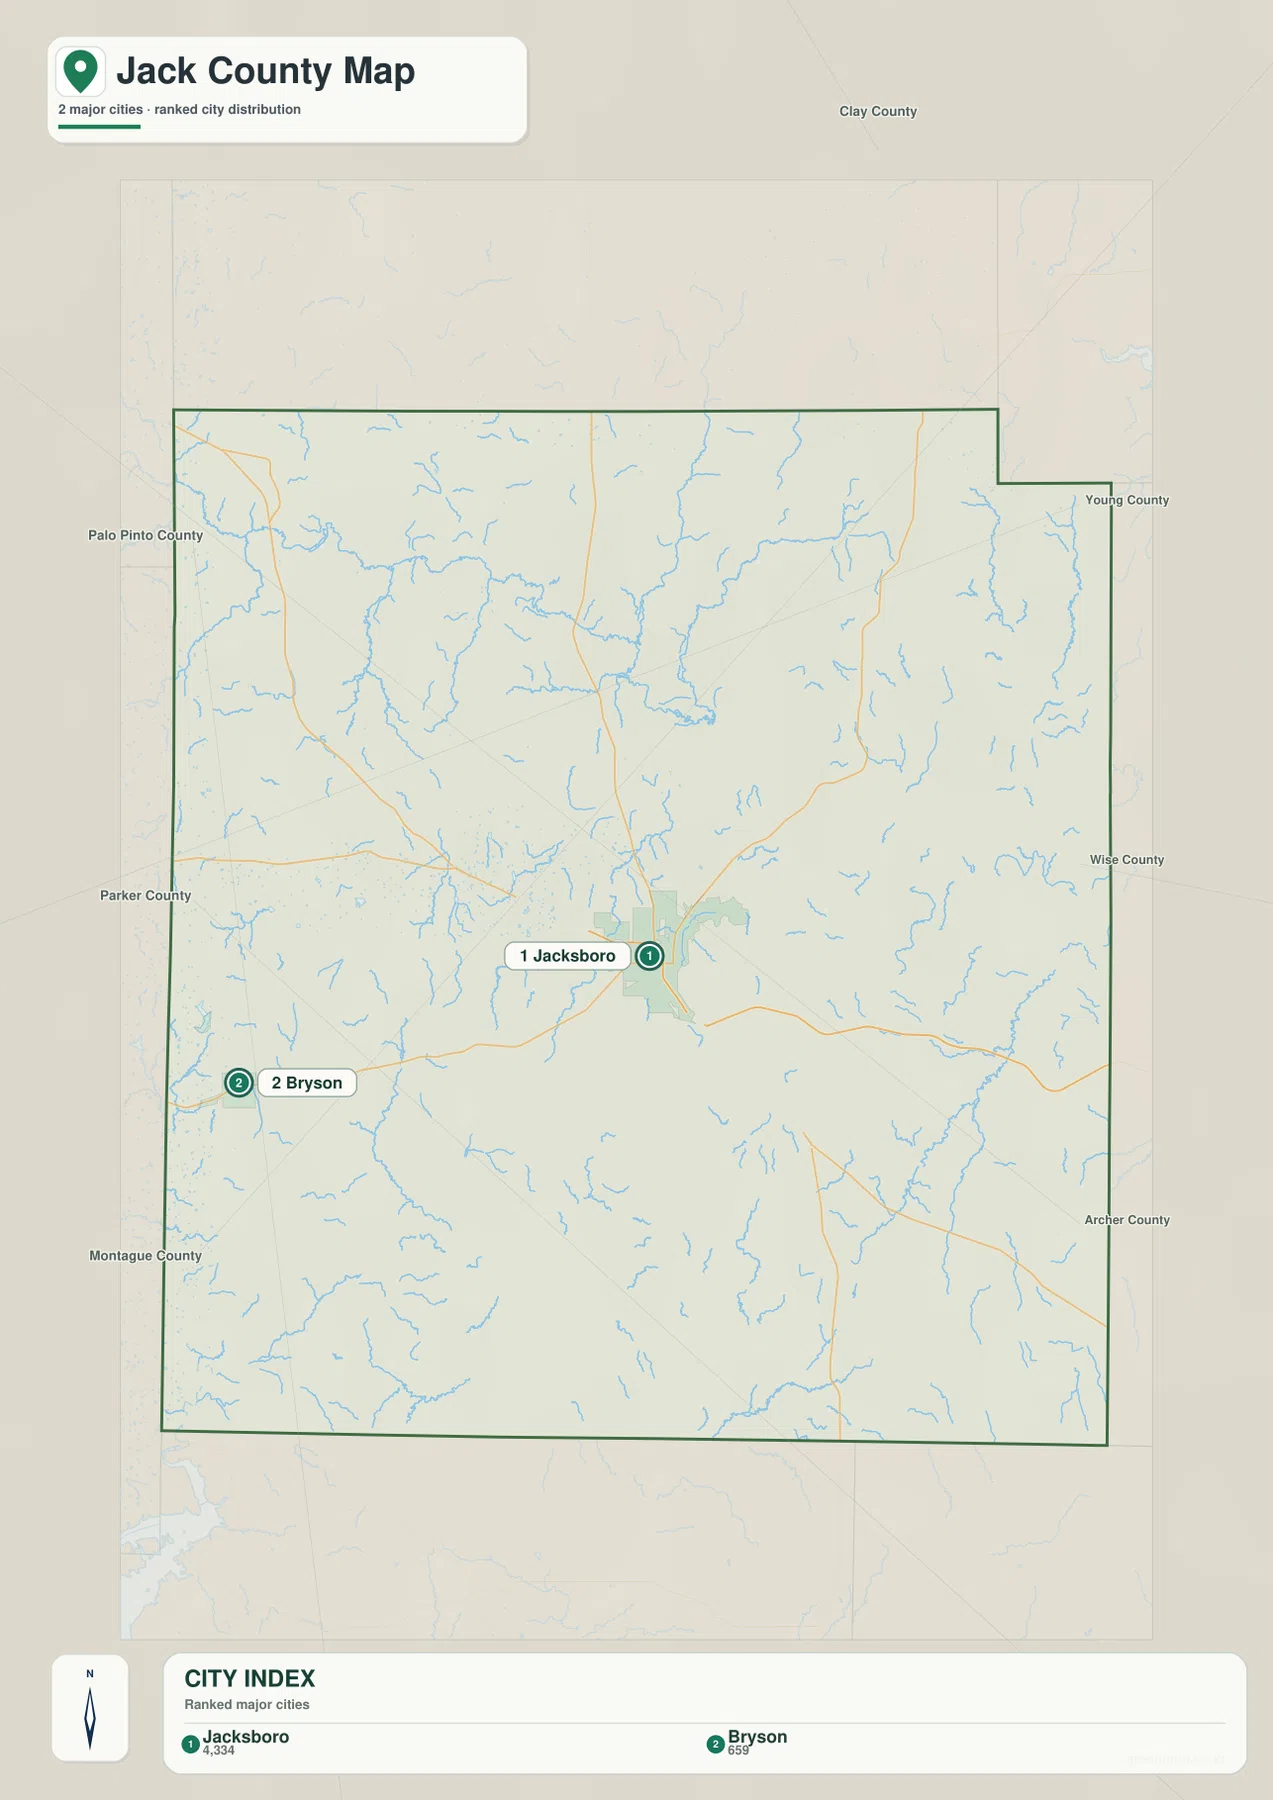
When a connector is shown between the ranked cities, it should be read as a straight-line relationship rather than a driving route. Actual road mileage follows the bends and junctions of the highway network and can be longer. To connect the two map types, locate Bryson on the city map and then return to the county map to see U.S. 380 reaching Jacksboro from the west. Perrin and Gibtown remain useful references, but they belong to the fuller county view rather than the ranked city index.
West Fork Trinity River, creeks, and scattered lakes
The water map shows a much denser network than the highway map. The West Fork Trinity River is the main named river feature, with numerous smaller channels feeding into or crossing the county. Cameron Creek is labeled in the northwest, Beans Creek appears farther west and toward the center, Salt Creek is visible on the eastern side, and Rock Creek runs through the southeast. These named streams sit within a finer web of small tributaries, which helps explain why the terrain looks dissected rather than uniformly flat.
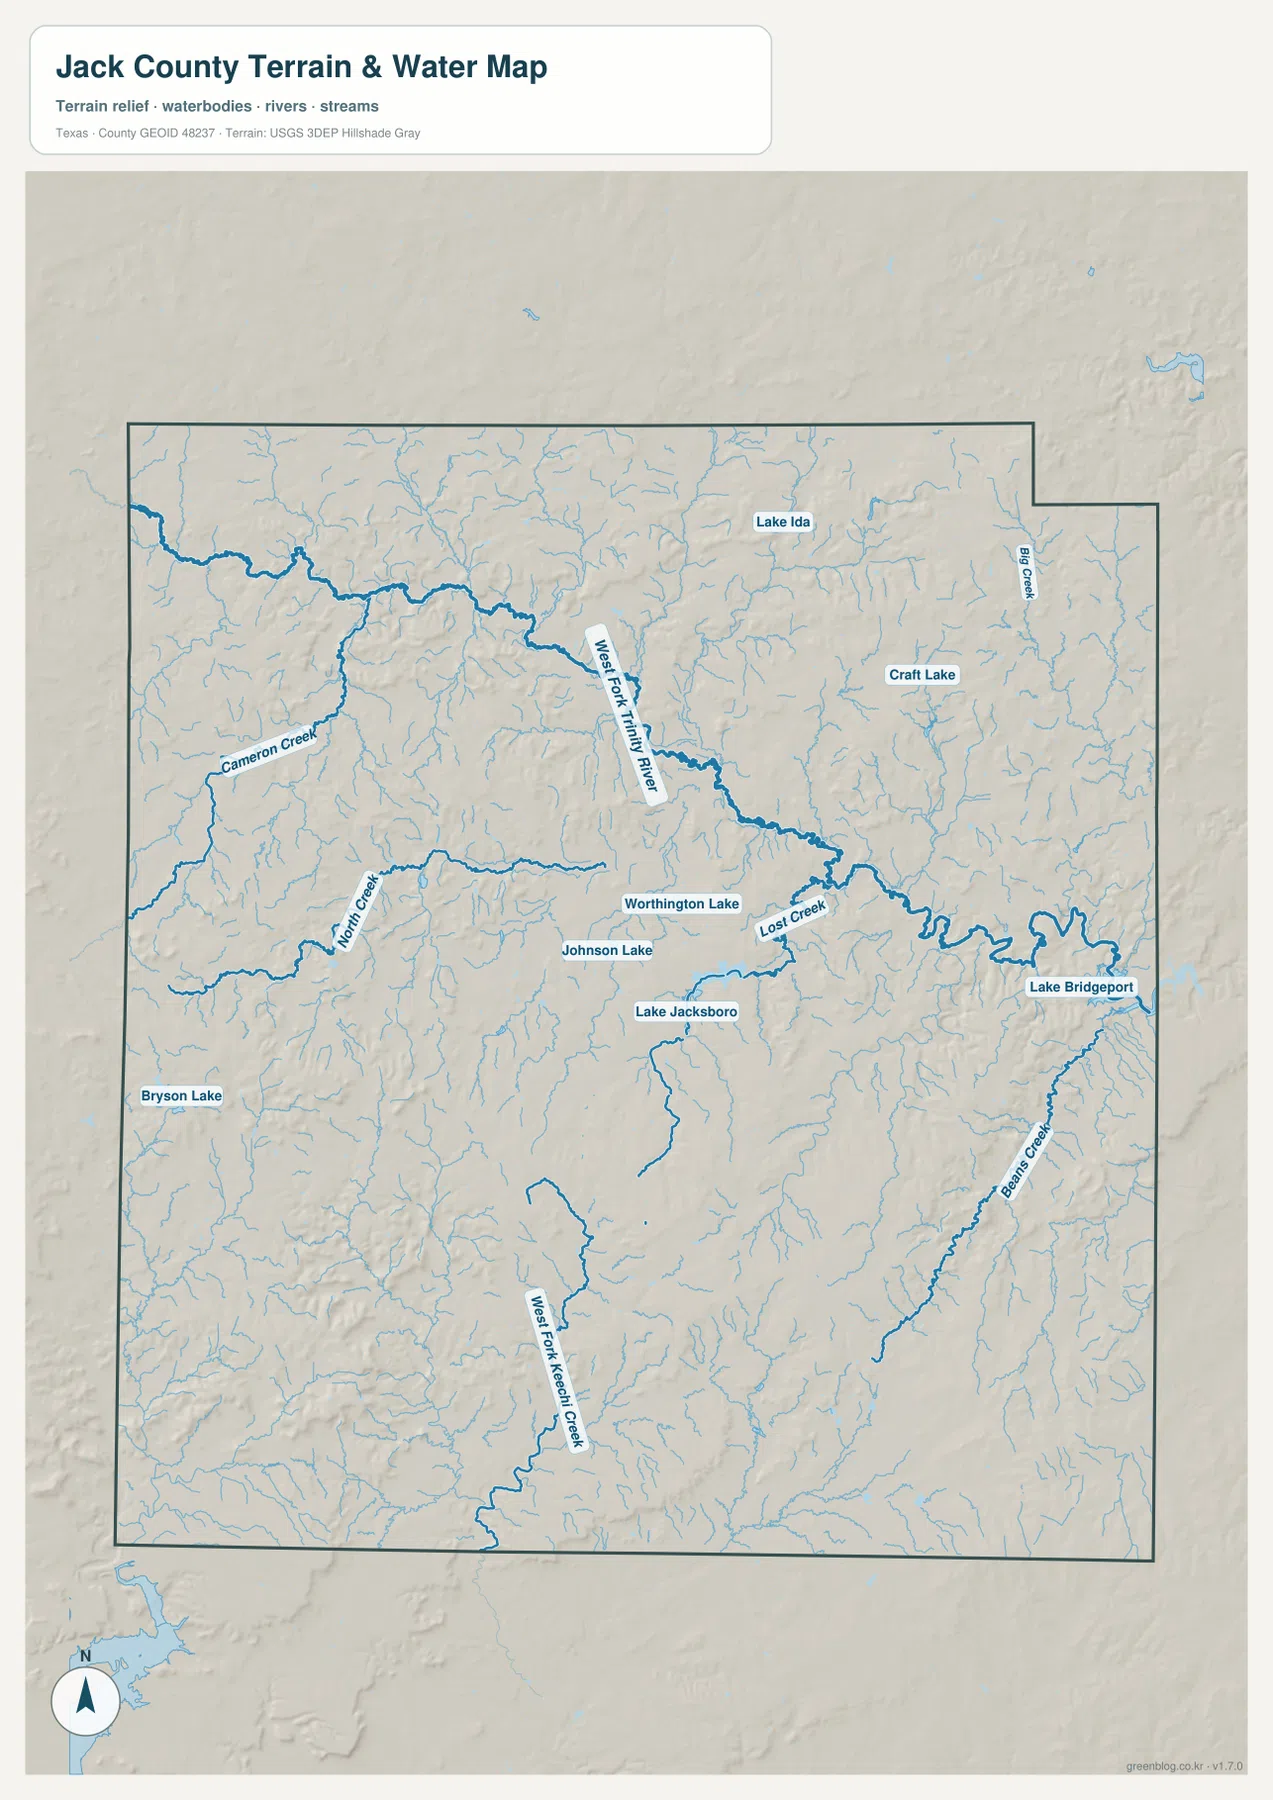
The lakes are spread across several parts of the county. Lake Jacksboro and Worthington Lake are close to the central area, Bryson Lake is on the western side, and Lake Ida and Craft Lake appear in the northeast. Lake Bridgeport is shown along the eastern side of the map. Together they provide useful landmarks when moving between the road and terrain views. This water map is a geographic reference, not a flood-risk map, navigation chart, parcel map, or legal statement of shoreline ownership.
Higher southwest hills and lower river corridors
The elevation map gives Jack County a noticeably different appearance from a flat plains county. Its displayed range is about 260 to 461 meters, with a mapped average near 333 meters. Brown and tan colors are concentrated across the southwest and parts of the south, indicating higher ground. Greener colors dominate much of the central and eastern side, especially around lower drainage corridors. The contrast is broad enough to see even before matching individual creeks to the shaded terrain.
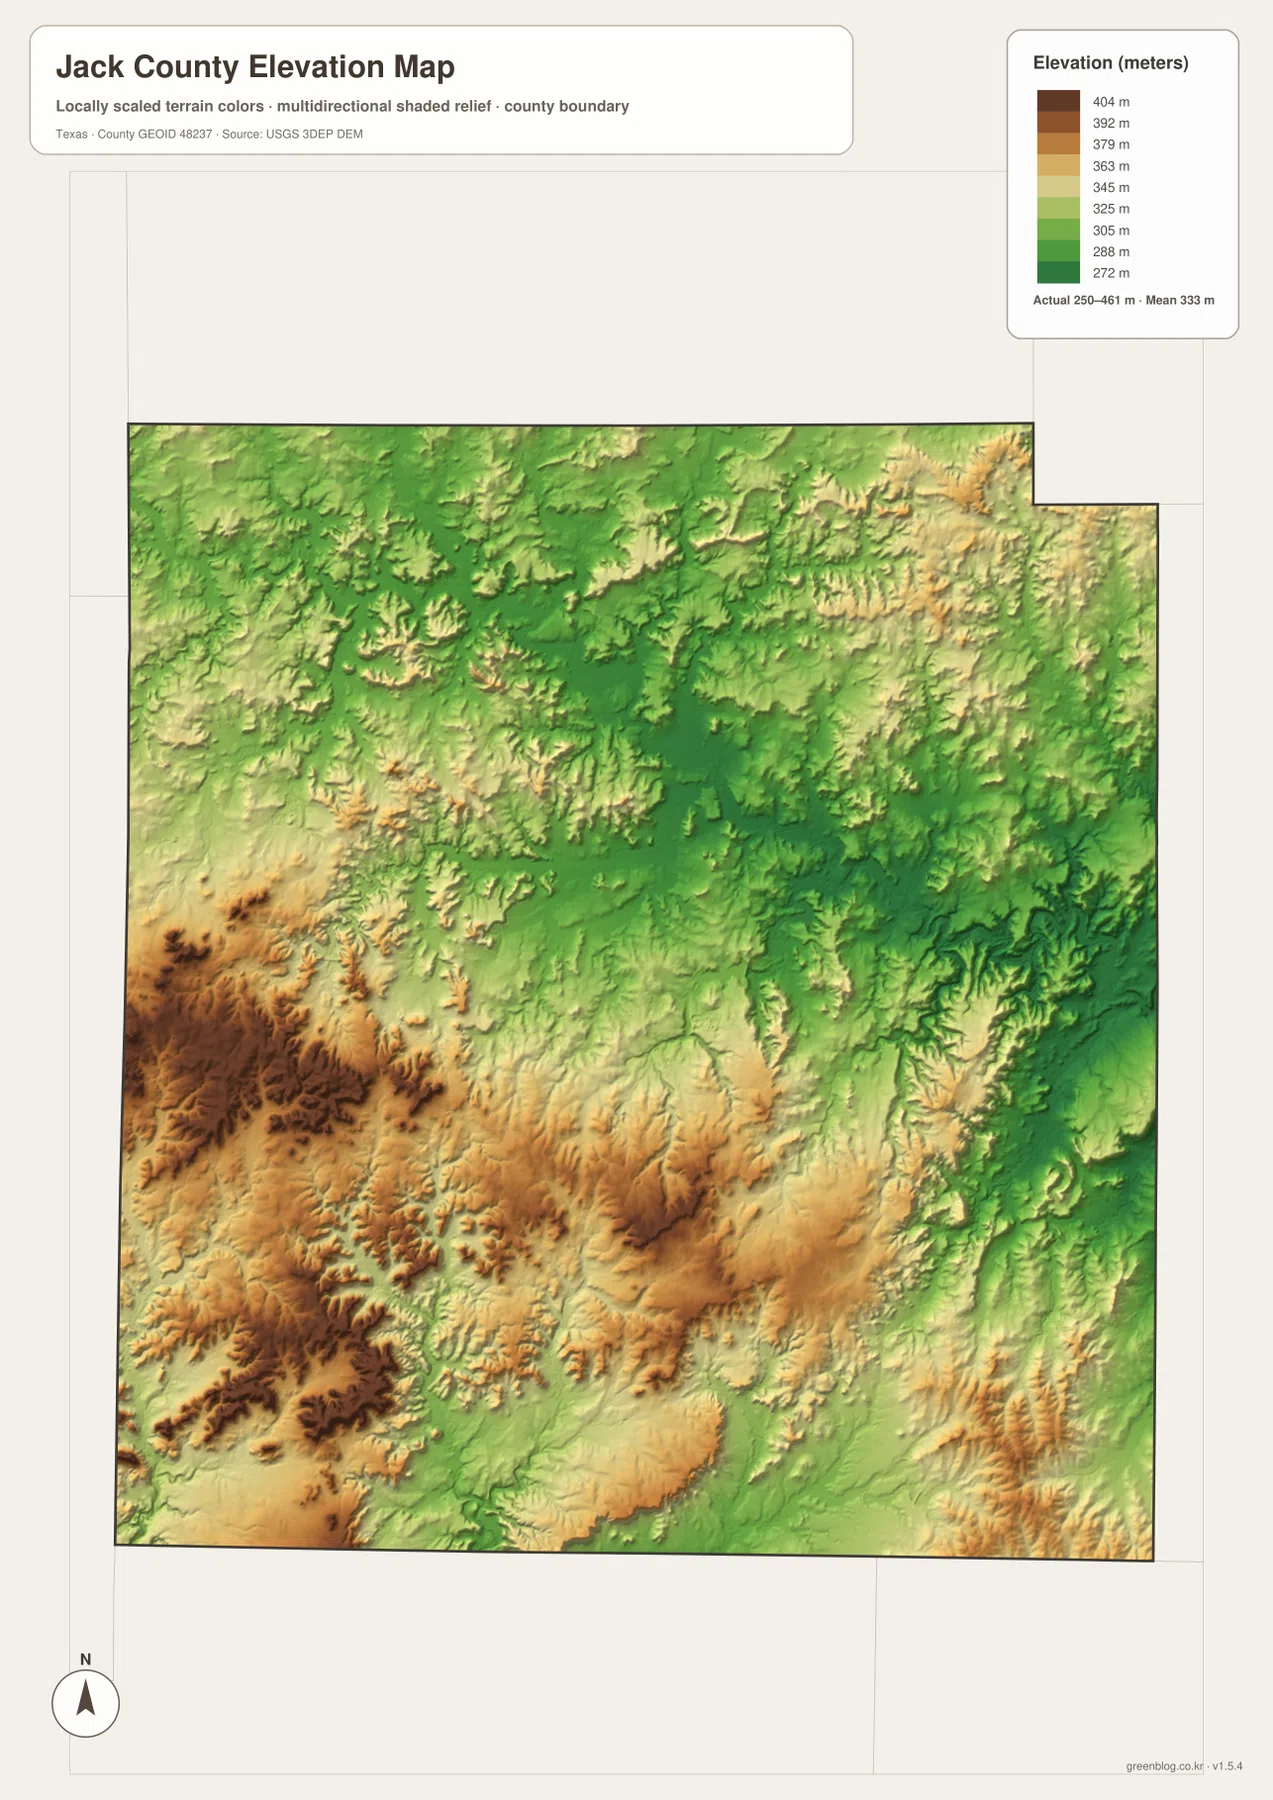
Comparing the elevation and water maps adds useful context. Lower green zones often follow the general areas where channels and valleys are concentrated, while the darker southwest relief stands above them. The county road map then shows how highways cross this uneven surface. The elevation layer is generalized for county-scale viewing, so it should not be treated as survey-grade or engineering-grade measurement for a specific property or construction site.
What becomes clearer when the four map views are compared
Each map answers a different part of the location question, but the strongest picture comes from comparing them. The county map explains why Jacksboro is the main road reference. The city map strips away most detail and makes the Jacksboro-Bryson relationship obvious. The water map adds the West Fork Trinity River and its creek network, while the elevation map shows that many of those channels occupy lower ground between higher ridges and hills. The combination explains the county without relying on abstract regional descriptions.
One useful example is the route from Jacksboro toward Bryson. U.S. 380 provides the road connection on the county map, while the water layer adds Beans Creek and other channels around the western half. Looking south from Jacksboro toward Perrin, U.S. 281 supplies the road reference and the elevation map shows more pronounced relief farther south and southwest. These comparisons make it easier to recognize whether a line on one map represents a road, a stream, or simply a change in terrain.
Choosing the right Jack County map for the task
For general orientation, the county map contains the widest mix of information because it combines boundaries, communities, and major routes. The city map is better when the question is simply where the two ranked major cities sit relative to one another. Water features are much easier to follow on the terrain-and-water map, especially the West Fork Trinity River and the named lakes. The elevation map is the clearest choice for comparing the higher southwest with the lower central and eastern terrain. Using the most relevant layer keeps a printed page or classroom handout from becoming unnecessarily busy.
The WebP images in the article are intended for quick on-screen viewing, while the downloadable archive contains the corresponding high-resolution JPG versions. The larger files are more convenient for printing, inserting into documents, or comparing the four map types side by side. Because the water and elevation layers are reference maps, users who need legal boundary determinations, flood analysis, navigation information, or precise site elevations should consult the appropriate official source data in addition to these maps.
Frequently Asked Questions
Why does the city map show only Jacksboro and Bryson as major cities?
The city map is a ranked major-city view, so it emphasizes Jacksboro and Bryson instead of every community. Perrin and Gibtown can still be found on the broader county map, which is the better source when you need more settlement labels and highway context.
Which water feature is the main reference on the Jack County water map?
The West Fork Trinity River is the most prominent named river feature. Cameron Creek, Beans Creek, Salt Creek, Rock Creek, Lake Jacksboro, Worthington Lake, Bryson Lake, and other lakes add local reference points around it. The map is intended for geographic orientation rather than flood or navigation decisions.
Where is the higher terrain shown on the elevation map?
The higher colors are concentrated mainly in the southwest and parts of the south, while lower green areas are more common through the central and eastern drainage corridors. The displayed county-scale range is about 260 to 461 meters, with an average near 333 meters, but the layer is not a substitute for a site survey.
Sources and reference data
U.S. Census Bureau TIGER/Line Shapefiles provide official geographic files used for county boundaries, roads, and place reference data.
USGS National Hydrography is an official source for rivers, streams, lakes, and other hydrographic features in the United States.
USGS 3D Elevation Program provides national elevation data and information about 3DEP products.
USGS The National Map Viewer can be used to review multiple official geographic layers together.
Map File Information
The ZIP contains the Jack County county map, city map, water map, and elevation map as high-resolution A3 JPG files.
- Included Files: Use only the versions confirmed in the article and supplied images
- File Type: Use the confirmed download contents
- Intended Use: Printing, education, presentations, and map-based projects
Related Maps
- Archer County Texas map
- Palo Pinto County Texas map
- Parker County Texas map
- Wise County Texas map
- Young County Texas map
Green Map creates custom-edited map images using open geographic data sources such as geoBoundaries, Natural Earth, OpenStreetMap, and government open data.
These maps are edited visual materials, not raw data files, and are provided for education, documents, presentations, and graphic reference.