Agriculture covers 78.83% of Blackford County in the supplied 2025 land-cover summary, creating a broad farm-dominated pattern across most of the county. Two developed concentrations interrupt that pattern: a larger cluster around Hartford City and a separate northern cluster that corresponds with Montpelier. This Blackford County Indiana Land Cover Map set lets readers compare the present surface, vegetation and farmland, hard surfaces, and mapped class differences between 1985 and 2025.
Four WebP previews are included in the article, and the four original 2480 × 1754-pixel JPG maps are available together in one ZIP. The set works well for county profiles, classroom discussion, agricultural context, and presentations where a current land-cover view needs to be compared with development intensity or endpoint change.
Table of Contents
A countywide farm pattern with two distinct developed centers
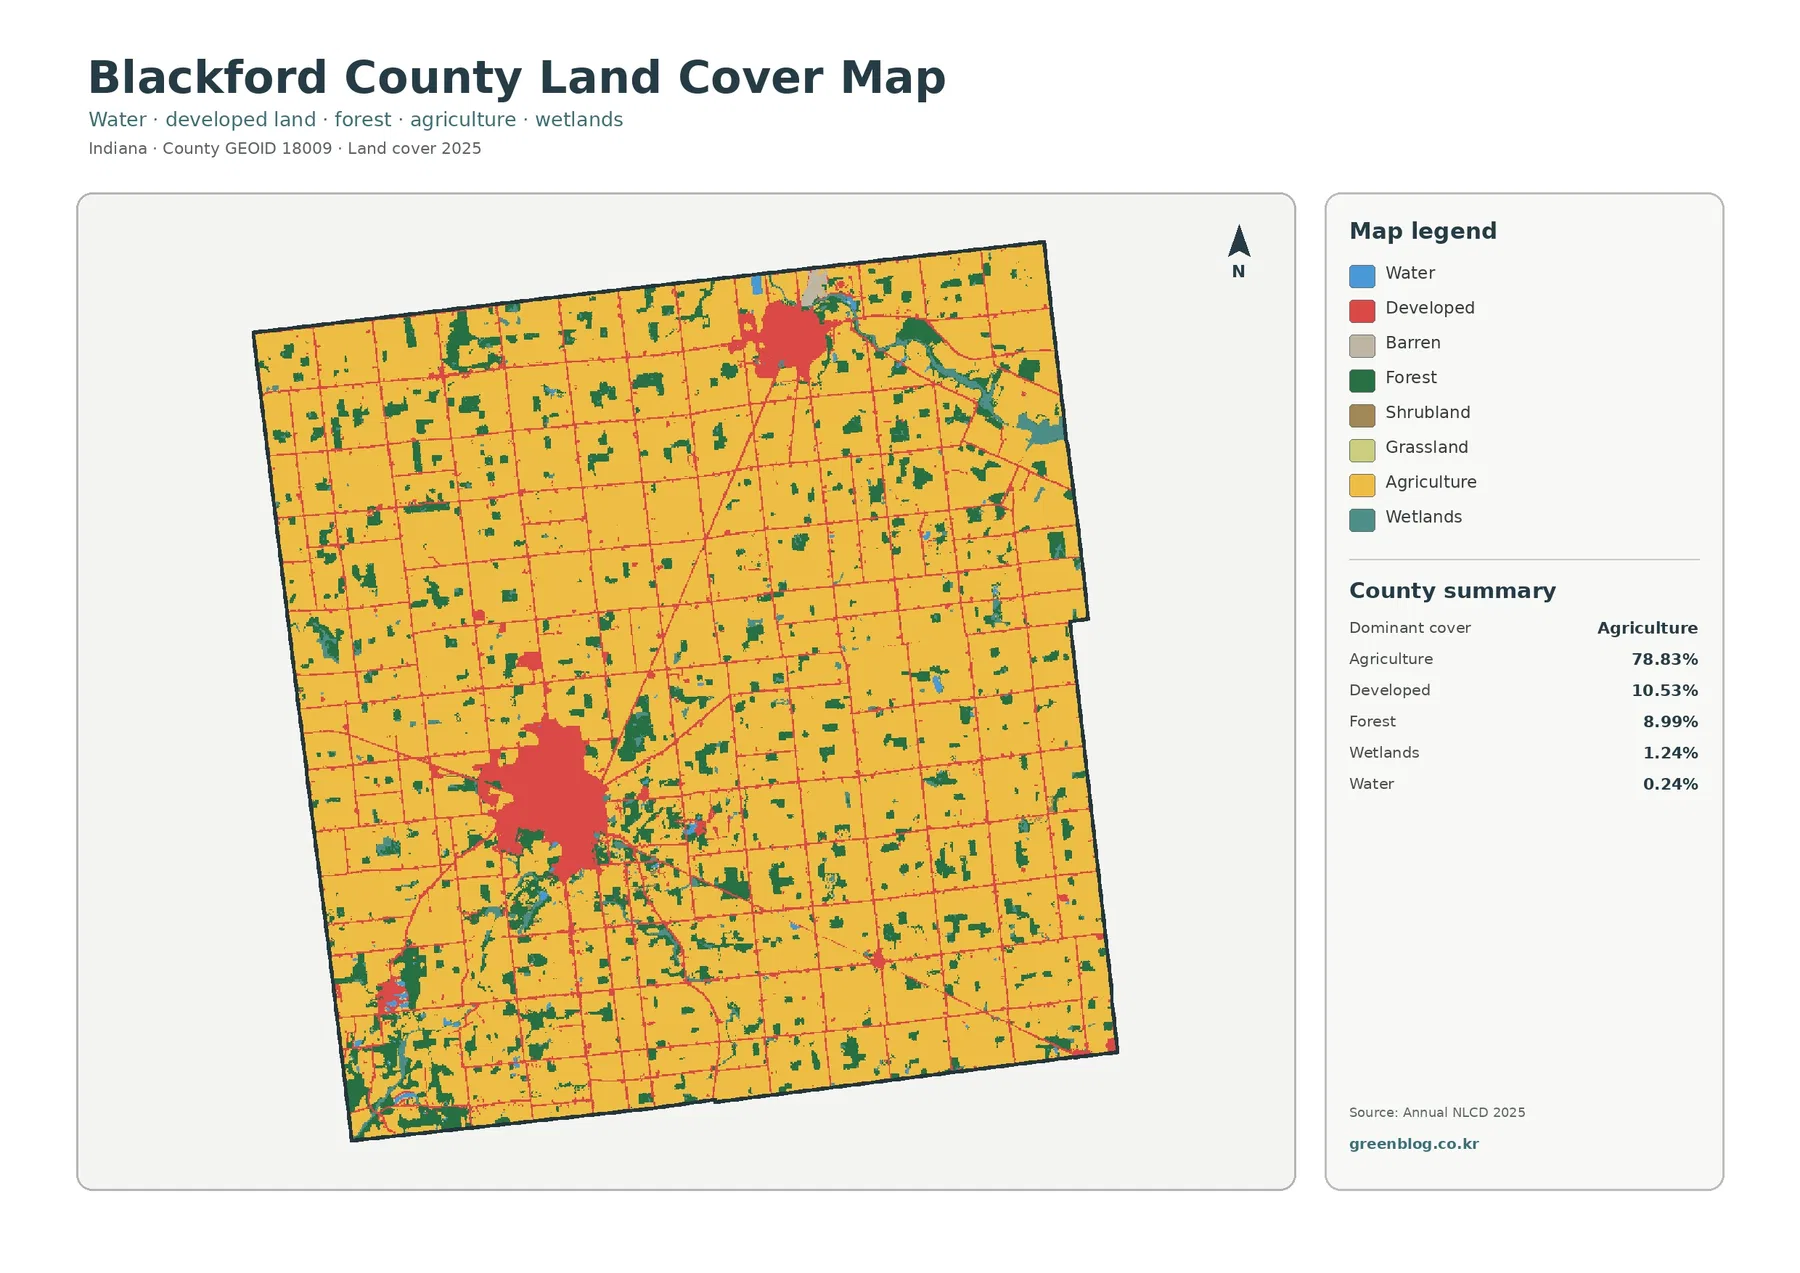
The summary is unusually clear: agriculture leads at 78.83%, followed by developed land at 10.53% and forest at 8.99%. Wetlands account for 1.24% and open water for 0.24%. Yellow agricultural cells therefore occupy nearly every part of the county, while the other classes appear as smaller clusters, strips, or patches within that much larger farm setting.
The largest developed area sits a little south of the county’s middle, with a second compact cluster near the north. Blackford County’s official community page identifies Hartford City as the county seat and Montpelier as the other primary city, so the two strongest developed concentrations can be compared broadly with those places. The preview itself does not draw municipal boundaries, however, so the red areas should not be treated as exact city limits.
Thin developed lines form a dense rural grid between the city clusters. They are consistent with roads and built surfaces crossing farm country, but the image contains no route names. Naming an individual line as State Road 3, State Road 18, or another road would require a transportation layer rather than the land-cover classification alone.
Forest is scattered rather than concentrated in one large block. Dark green patches are more frequent around the central-southern part of the county, in the southwest, and along irregular bands toward the east and northeast. Wetland cells are much less extensive but often occur near these more irregular natural-cover shapes. Those patterns can guide a closer look at vegetation and drainage context without assigning a stream name that is not printed on the map.
Hard surfaces separate Hartford City and Montpelier from the rural grid
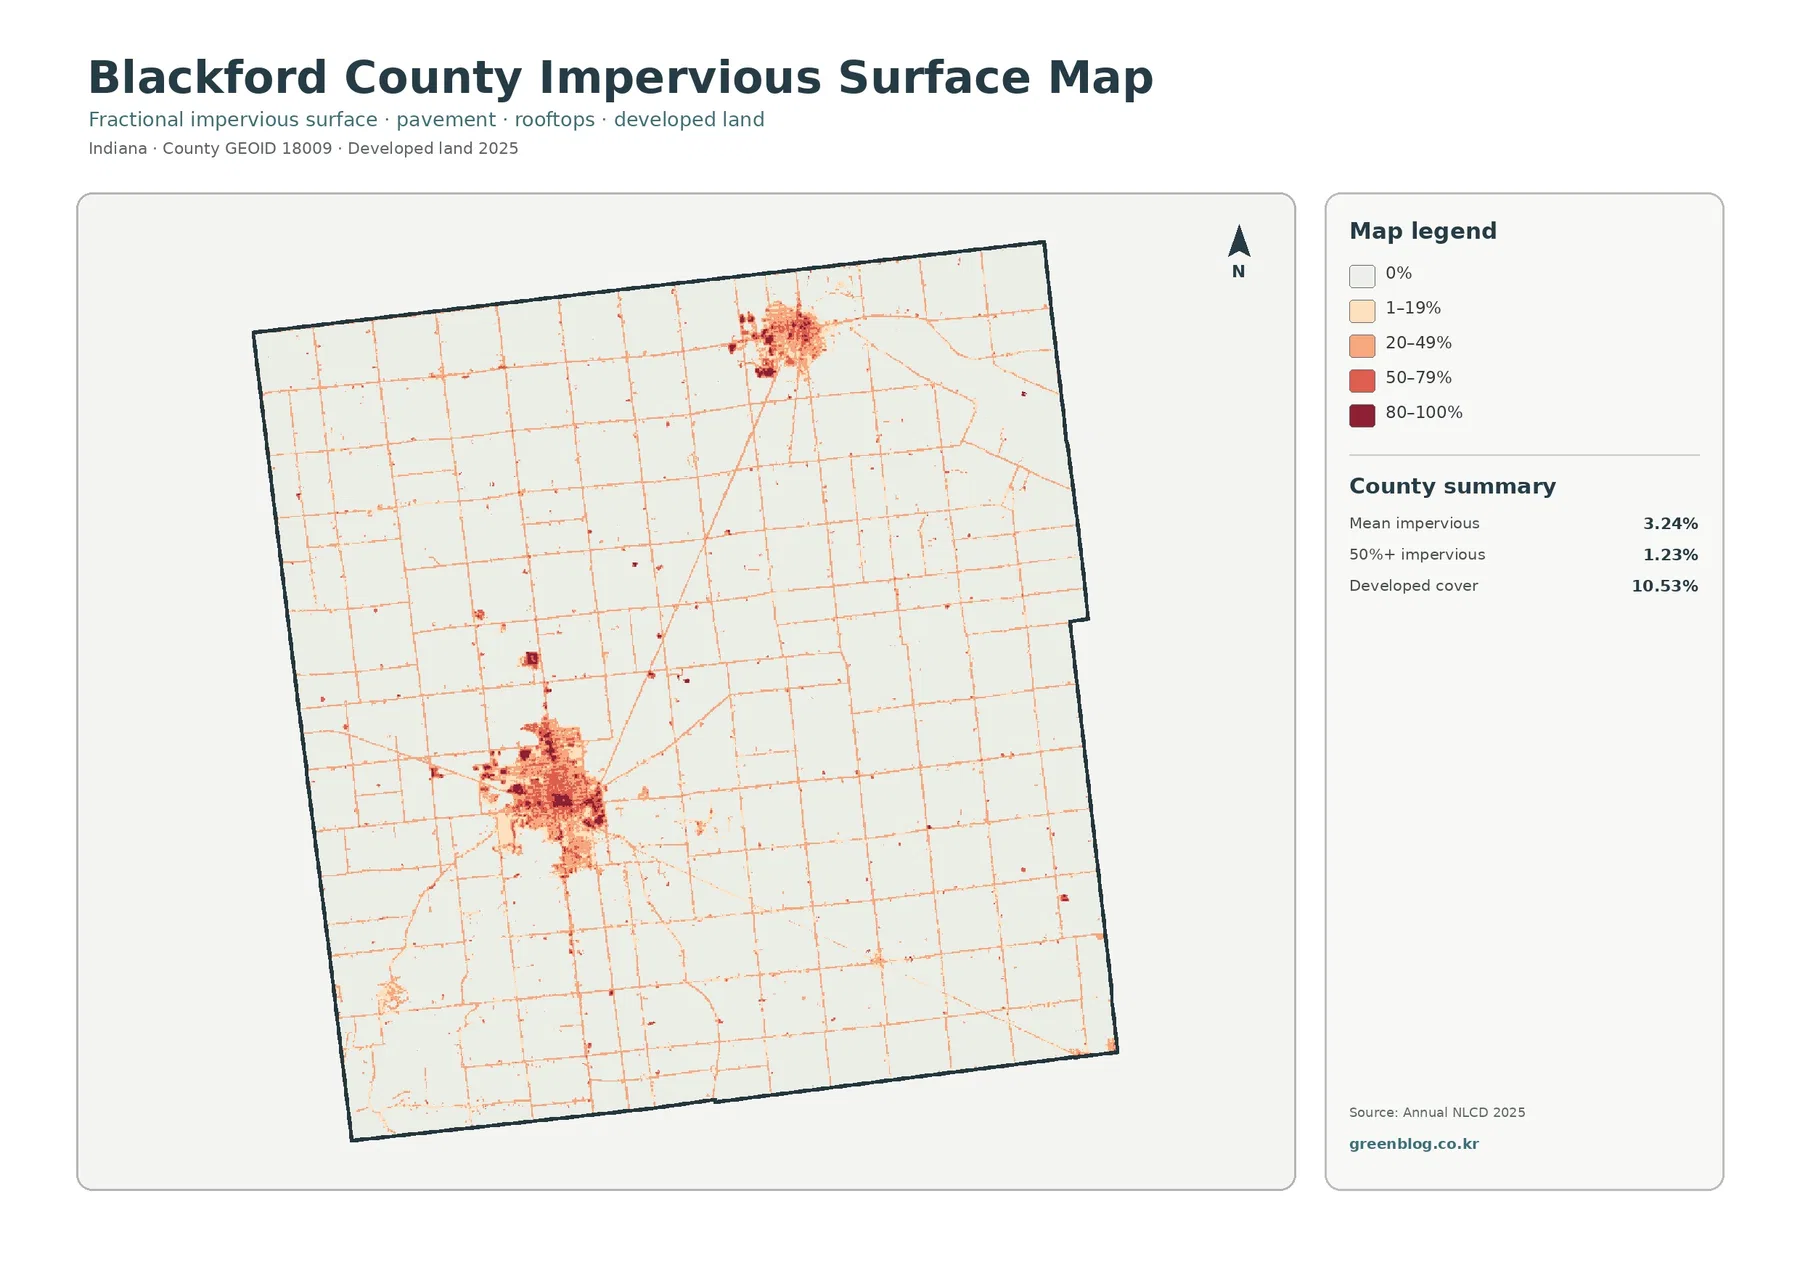
Impervious surface means material such as pavement and rooftops that does not readily absorb water. Blackford County has a mean impervious value of 3.24%, while 1.23% of the county is mapped at 50% impervious or greater. Those numbers are lower than the 10.53% developed-land share because a developed land-cover class can include lawns, trees, bare soil, and other permeable surfaces around buildings and roads.
The largest dark concentration matches the Hartford City area, and a second strong cluster appears around Montpelier. Between them, pale orange lines create a regular network across the agricultural interior. Small isolated marks occur elsewhere, but the preview does not contain enough place labels to assign each one to a town, facility, or named road.
The countywide average should not be read as the condition of every location. A compact city block may contain a high percentage of hard surface while a nearby field is close to zero, yet both contribute to the same 3.24% mean. For development comparisons, the location and continuity of the darker cells are often more informative than the average by itself.
This layer can provide context for runoff questions, but it is not a flood-risk map. Rainfall, soils, elevation, drainage systems, streams, wetlands, and local infrastructure all affect how water moves. A dark impervious patch should not automatically be labeled flood-prone, and a lightly colored farm area should not automatically be labeled safe.
Fields remain continuous when built areas are faded from view
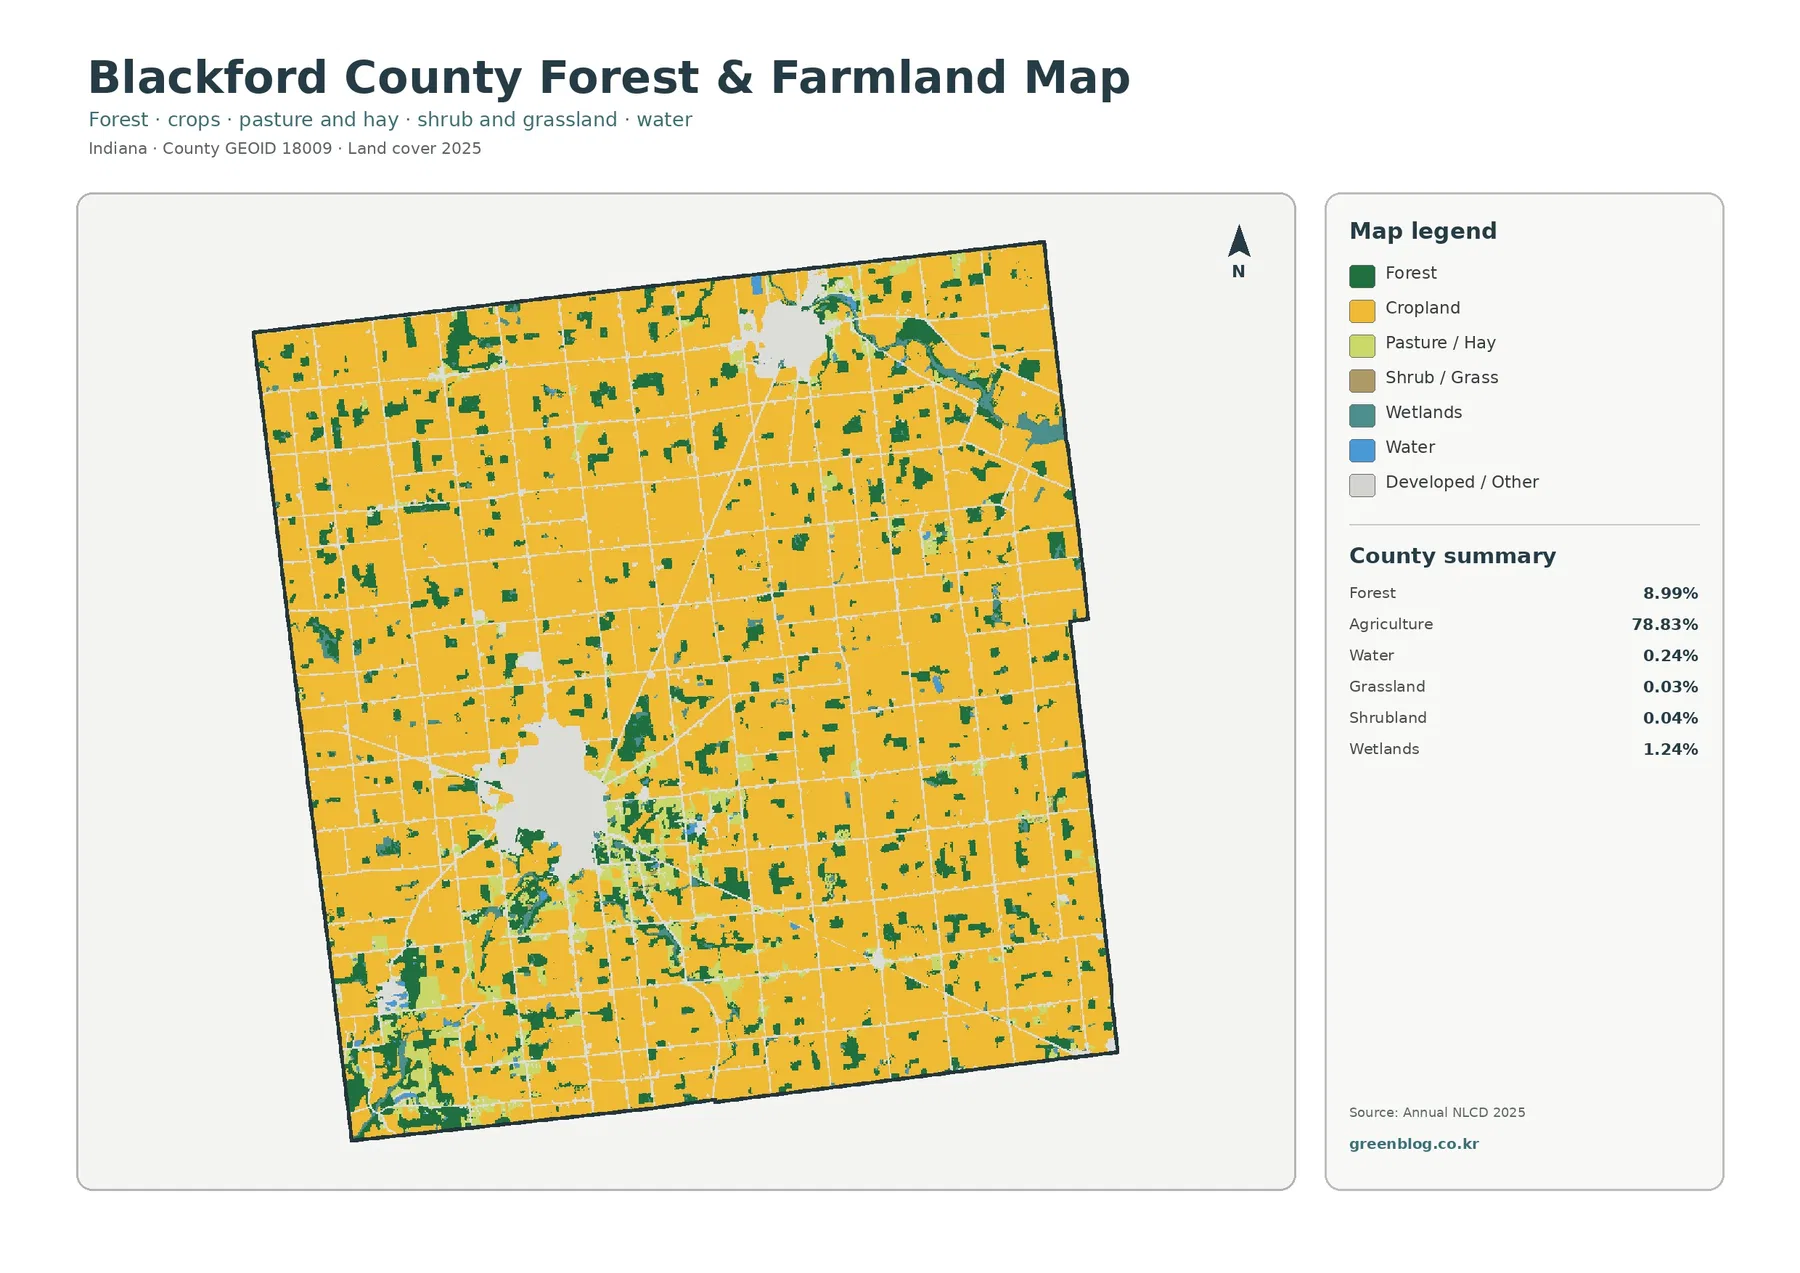
Once developed and miscellaneous surfaces are faded, cropland dominates even more visually. The 78.83% agricultural share forms broad, nearly continuous blocks from the northern edge to the southern boundary. Forest accounts for 8.99% and appears as many smaller dark-green pieces rather than one large wooded region.
Grassland is listed at only 0.03% and shrubland at 0.04%. Wetlands are 1.24% and water 0.24%. The focused map therefore does not show a balanced mix of several equally large vegetation types; it shows a working agricultural landscape with modest forest remnants and relatively limited wet and open-water cover.
The pale gaps around the two developed centers help explain the relationship between towns and farmland. Hartford City occupies a larger opening within the farm pattern, while Montpelier creates a smaller northern opening. The shapes are useful for a county-scale comparison, but the pale areas are not legal municipal boundaries and do not identify zoning categories.
Straight agricultural edges can resemble parcel lines, yet Annual NLCD is a raster classification rather than a plat map. A raster divides the landscape into cells and assigns a predominant class to each one. Tree rows, roadside vegetation, ditches, narrow water features, farm lanes, houses, and yards may be generalized into the class that occupies most of a cell.
Local information supports the importance of agriculture without replacing the map statistics. Blackford County’s government describes the county as historically tied to a farming community, and Purdue Extension Blackford County maintains Agriculture and Natural Resources programming. Those sources provide local context, while the 78.83% figure comes from the supplied land-cover summary itself.
The 6.72% endpoint difference is not a countywide damage estimate
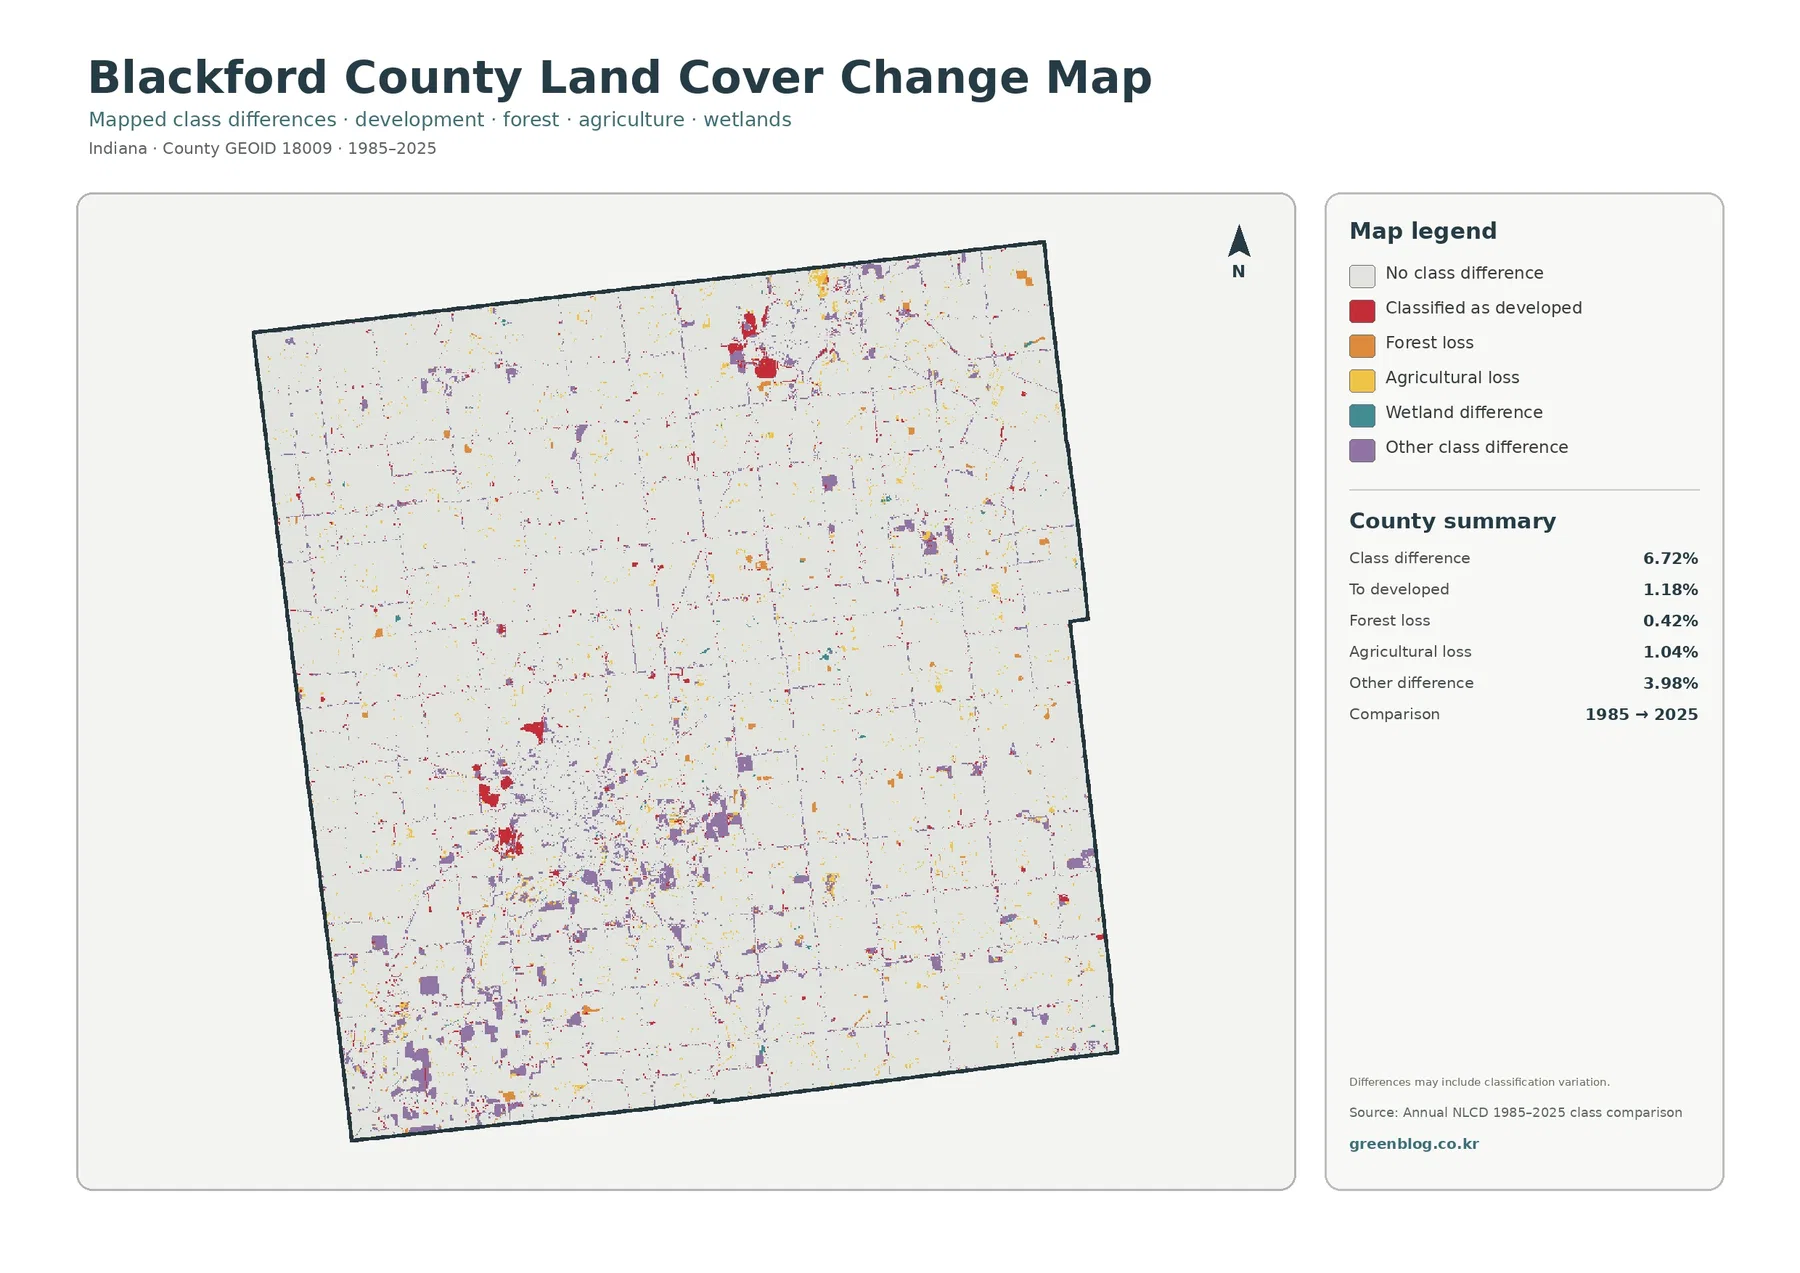
The supplied comparison reports 6.72% total class difference between 1985 and 2025. Its listed components include 1.18% classified as developed, 0.42% forest loss, 1.04% agricultural loss, and 3.98% other difference. Wetland difference appears in the legend but has no separate percentage in the summary, so a residual value should not be presented as an official wetland-change statistic.
Red developed-conversion cells are most noticeable around the two present-day developed centers, especially the larger Hartford City cluster and the northern Montpelier cluster. Smaller red marks appear elsewhere. Forest-loss and agricultural-loss cells are more dispersed, while purple other-difference cells occur in numerous small patches across the agricultural interior.
The large amount of pale or unchanged background matters as much as the colored marks. At the broad class level used in this comparison, most cells have the same endpoint classification in 1985 and 2025. That does not mean nothing happened within them during the forty-year interval; it means the two endpoint labels match.
“Forest loss” and “agricultural loss” describe a change in mapped class, not a known cause. The map does not identify logging, construction, abandonment, drainage work, storms, or classification variation as the reason. Likewise, a cell classified as developed in 2025 does not reveal the construction year or project. Intermediate imagery, permits, aerial photographs, and local records are needed to answer those questions.
Frequently Asked Questions
Is Blackford County almost entirely agricultural?
Agriculture is the dominant class at 78.83%, so a farm-dominated description is accurate. It is not the only important cover, however. Developed land accounts for 10.53%, forest for 8.99%, and the two main developed concentrations around Hartford City and Montpelier are clearly visible.
Why is developed cover 10.53% while mean impervious cover is only 3.24%?
Developed land-cover classes can include lawns, trees, soil, and other permeable areas around buildings and roads. Impervious cover isolates hard materials such as rooftops and pavement, so the countywide mean is lower than the developed-land percentage.
Does the 6.72% class difference mean 6.72% of the county was developed after 1985?
No. The 6.72% value covers all cells with different endpoint classes, including forest loss, agricultural loss, other differences, wetland differences, and cells classified as developed. The specifically listed developed conversion is 1.18%, and even that value does not provide an exact construction date or cause.
How to use the four maps without mixing their meanings
For a county overview, start with the 2025 land-cover map. It establishes the dominant agricultural share, the two main developed centers, and the much smaller forest, wetland, and water classes. The forest-and-farmland view is the better companion when the goal is to isolate cropland and wooded patches without the strong red development color.
Use the impervious map when the question concerns rooftops, pavement, and other hard surfaces. It makes the Hartford City and Montpelier concentrations more obvious and shows the thinner rural network at a different intensity. The endpoint-change map works best after the current map has been explained, because its colors describe differences between years rather than present-day land-cover classes.
In a classroom, the set can demonstrate why “developed land” and “impervious surface” are not identical statistics. It can also show why agricultural dominance does not mean a county lacks towns, forest patches, or wet areas. For a presentation, one current map plus one focused comparison usually preserves more detail than shrinking all four maps into a single small panel.
For a local planning discussion, the maps are useful as background rather than as decision documents. They can help identify where a question deserves closer inspection, but parcel records, current aerial imagery, zoning maps, drainage information, and field verification are required for site-specific decisions.
Resolution, classification date, and other limits to keep in mind
Annual NLCD products generalize the landscape into raster cells, commonly 30 meters across for land-cover classification. A mixed cell receives one predominant label even when crops, trees, a ditch, pavement, grass, and a building share the same area. Enlarging the image makes the cells larger on screen; it does not recover parcel-level detail that was never present in the source classification.
The current map represents the supplied 2025 observation year. Construction, crop conditions, vegetation removal or recovery, and temporary water conditions after that observation may not appear. The 1985–2025 comparison also summarizes two endpoints rather than providing a continuous annual history of every change.
Each downloadable JPG is 2480 × 1754 pixels. The package does not mark these files as meeting an A3 high-resolution reference, so a test print is sensible before using them for a large poster. They are suitable reference graphics for screen use, ordinary documents, lessons, and presentations, but not survey, engineering, parcel, flood-insurance, or regulatory wetland products.
What is included in the four-map JPG ZIP
The ZIP contains one JPG for 2025 land cover, one for forest and farmland, one for impervious surface and developed land, and one for 1985–2025 land-cover class differences. Use the first image for the full county pattern, then choose the focused image that matches the question: vegetation, hard surfaces, or endpoint change.
Map File Information
The ZIP contains four original JPG maps for comparing Blackford County's 78.83% agricultural pattern, Hartford City and Montpelier development, impervious surfaces, and 1985–2025 class differences.
- Included Files: Original high-resolution map files shown in this article
- File Type: JPG images packaged in a ZIP archive
- Intended Use: Printing, education, presentations, and map-based projects
Related Maps
- Adams County Indiana Land Cover Map
- Allen County Indiana Land Cover Map
- Bartholomew County Indiana Land Cover Map
Sources and Reference Data
- MRLC Annual NLCD Data – official access point for annual land-cover and comparison products
- USGS Annual NLCD Land Cover Classification – definitions and guidance for agriculture, forest, wetlands, developed land, and related classes
- U.S. Census Bureau TIGER/Line Shapefiles – official county-boundary reference for Blackford County
- Blackford County – Community – official local page identifying Hartford City, Montpelier, Shamrock Lakes, and the county’s community context
- Blackford County Planning & Zoning – local planning, zoning, permitting, subdivision, and GIS resources
- Purdue Extension Blackford County – Agriculture and Natural Resources – local agriculture and natural-resource programs and reference information
Green Map creates custom-edited map images using open geographic data sources such as geoBoundaries, Natural Earth, OpenStreetMap, and government open data. These maps are edited visual materials, not raw data files, and are provided for education, documents, presentations, and graphic reference.