Agriculture is the dominant 2025 land-cover class in Crisp County, but the county is not a uniform field landscape. Farm blocks cover much of the interior, a large developed concentration marks Cordele, and the western edge is shaped by water and wetland cover associated with the Flint River and Lake Blackshear. This Crisp County Georgia Land Cover Map set makes those contrasts easier to compare without treating land cover as zoning or parcel use.
The page includes four views: countywide 2025 land cover, forest and farmland, impervious surface and developed land, and a 1985–2025 class-difference map. The four original JPG files, each 2480 × 1754 pixels, are available together in one ZIP for county profiles, classroom work, presentations, and visual comparisons.
Table of Contents
Nearly half the county is agricultural, but water and wetlands reshape the west
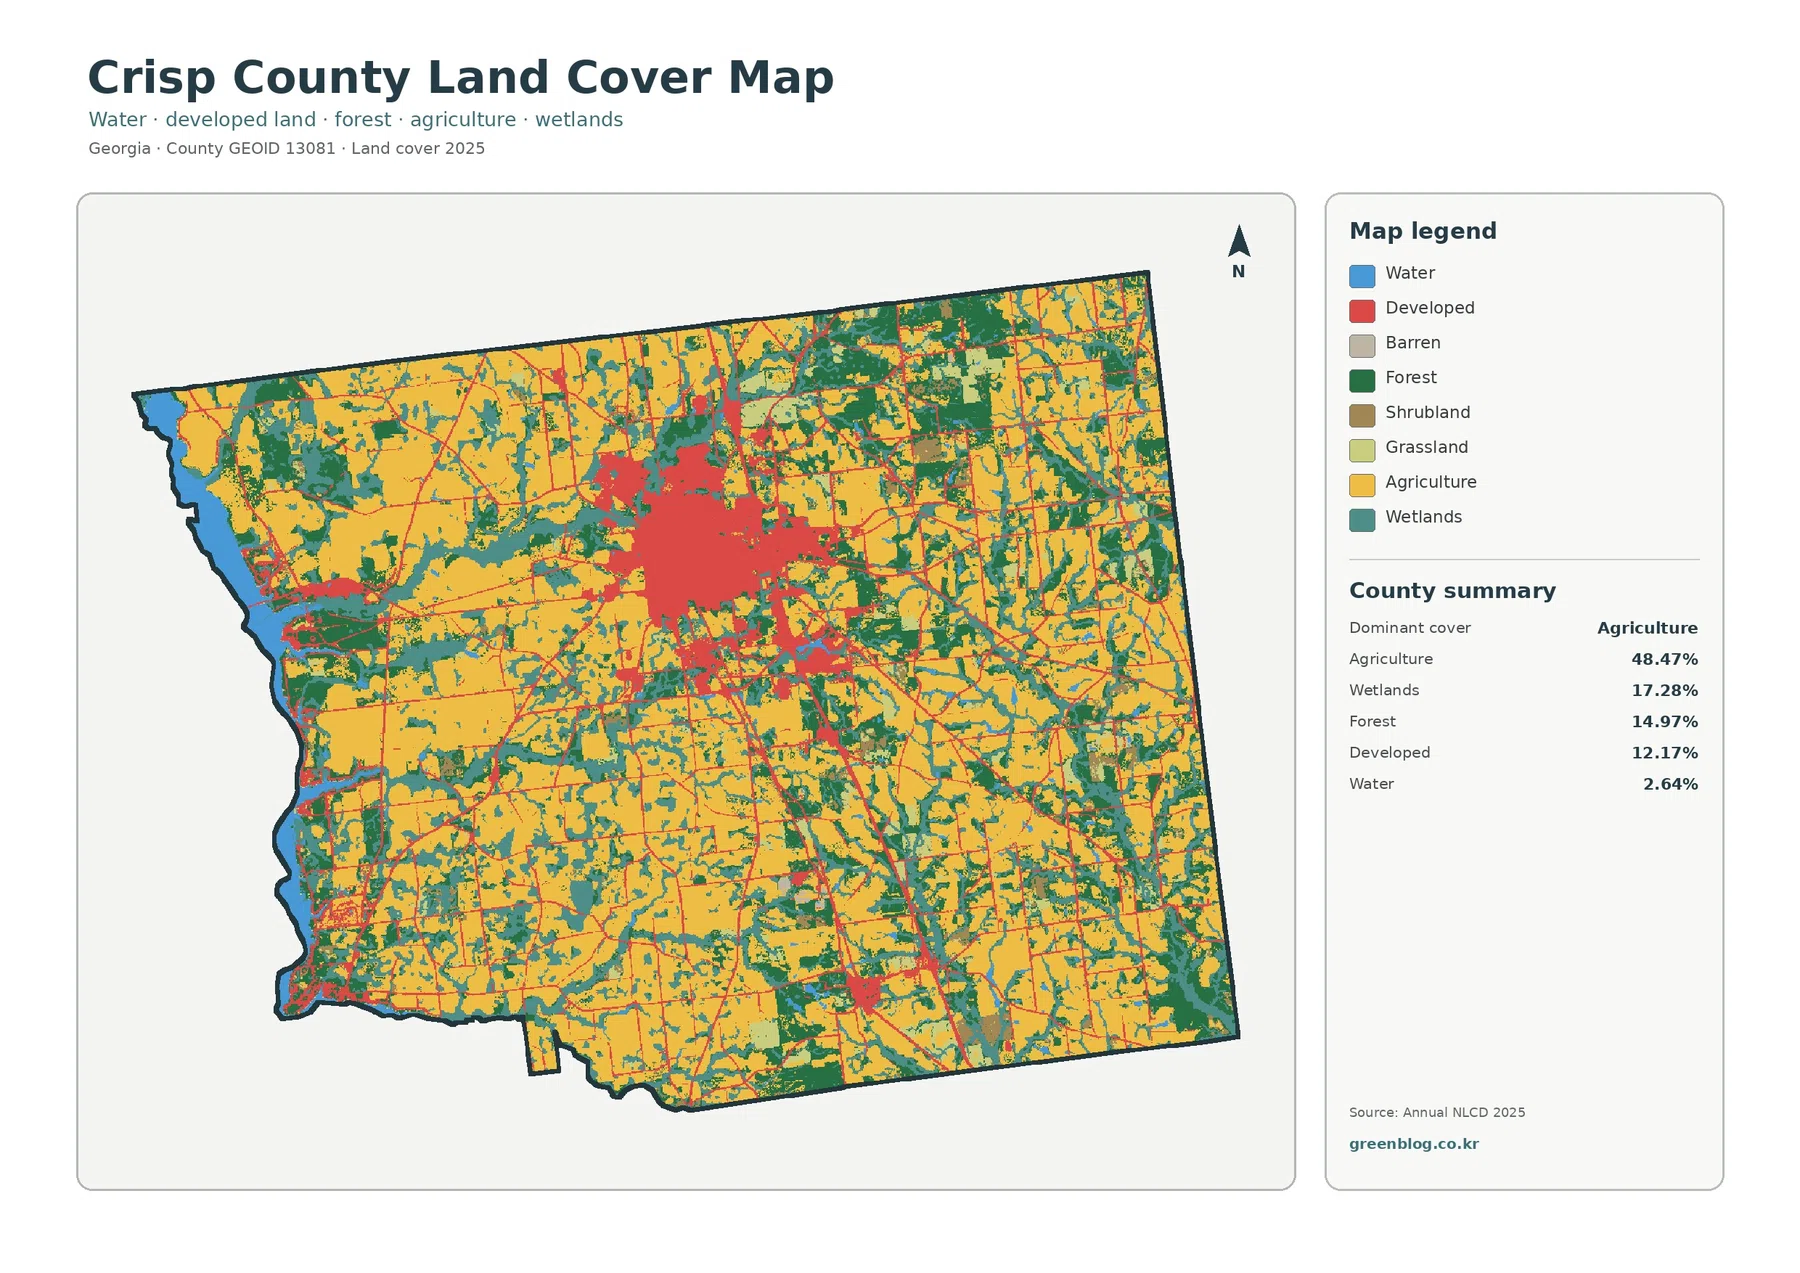
Agriculture accounts for 48.47% of the 2025 summary. Wetlands follow at 17.28%, forest at 14.97%, developed land at 12.17%, and open water at 2.64%. The yellow agricultural class therefore dominates the statistics, yet the map is visually broken by teal wetland corridors, green forest patches, and a strong red developed area near the upper center. That mix is more informative than the leading percentage alone.
The central developed concentration aligns with Cordele, the county seat. Rather than ending at a neat circular edge, developed cells extend outward in several directions and meet farmland quickly. Small red clusters also appear elsewhere in the county, but most are minor compared with Cordele. A land-cover class does not define the legal city boundary, so the red area should be read as built and developed cover rather than as a municipal map.
Along the western boundary, blue water forms a much more continuous feature than elsewhere in the county. Official Crisp County information identifies Lake Blackshear on the Flint River west of Cordele, which provides useful geographic context for this edge. Teal wetland cells frequently border or branch away from the water. The land-cover image can show where wet surfaces are concentrated, but it cannot establish a regulated wetland boundary, shoreline ownership, or flood-zone status.
Cordele stands out when hard surfaces are separated from general development
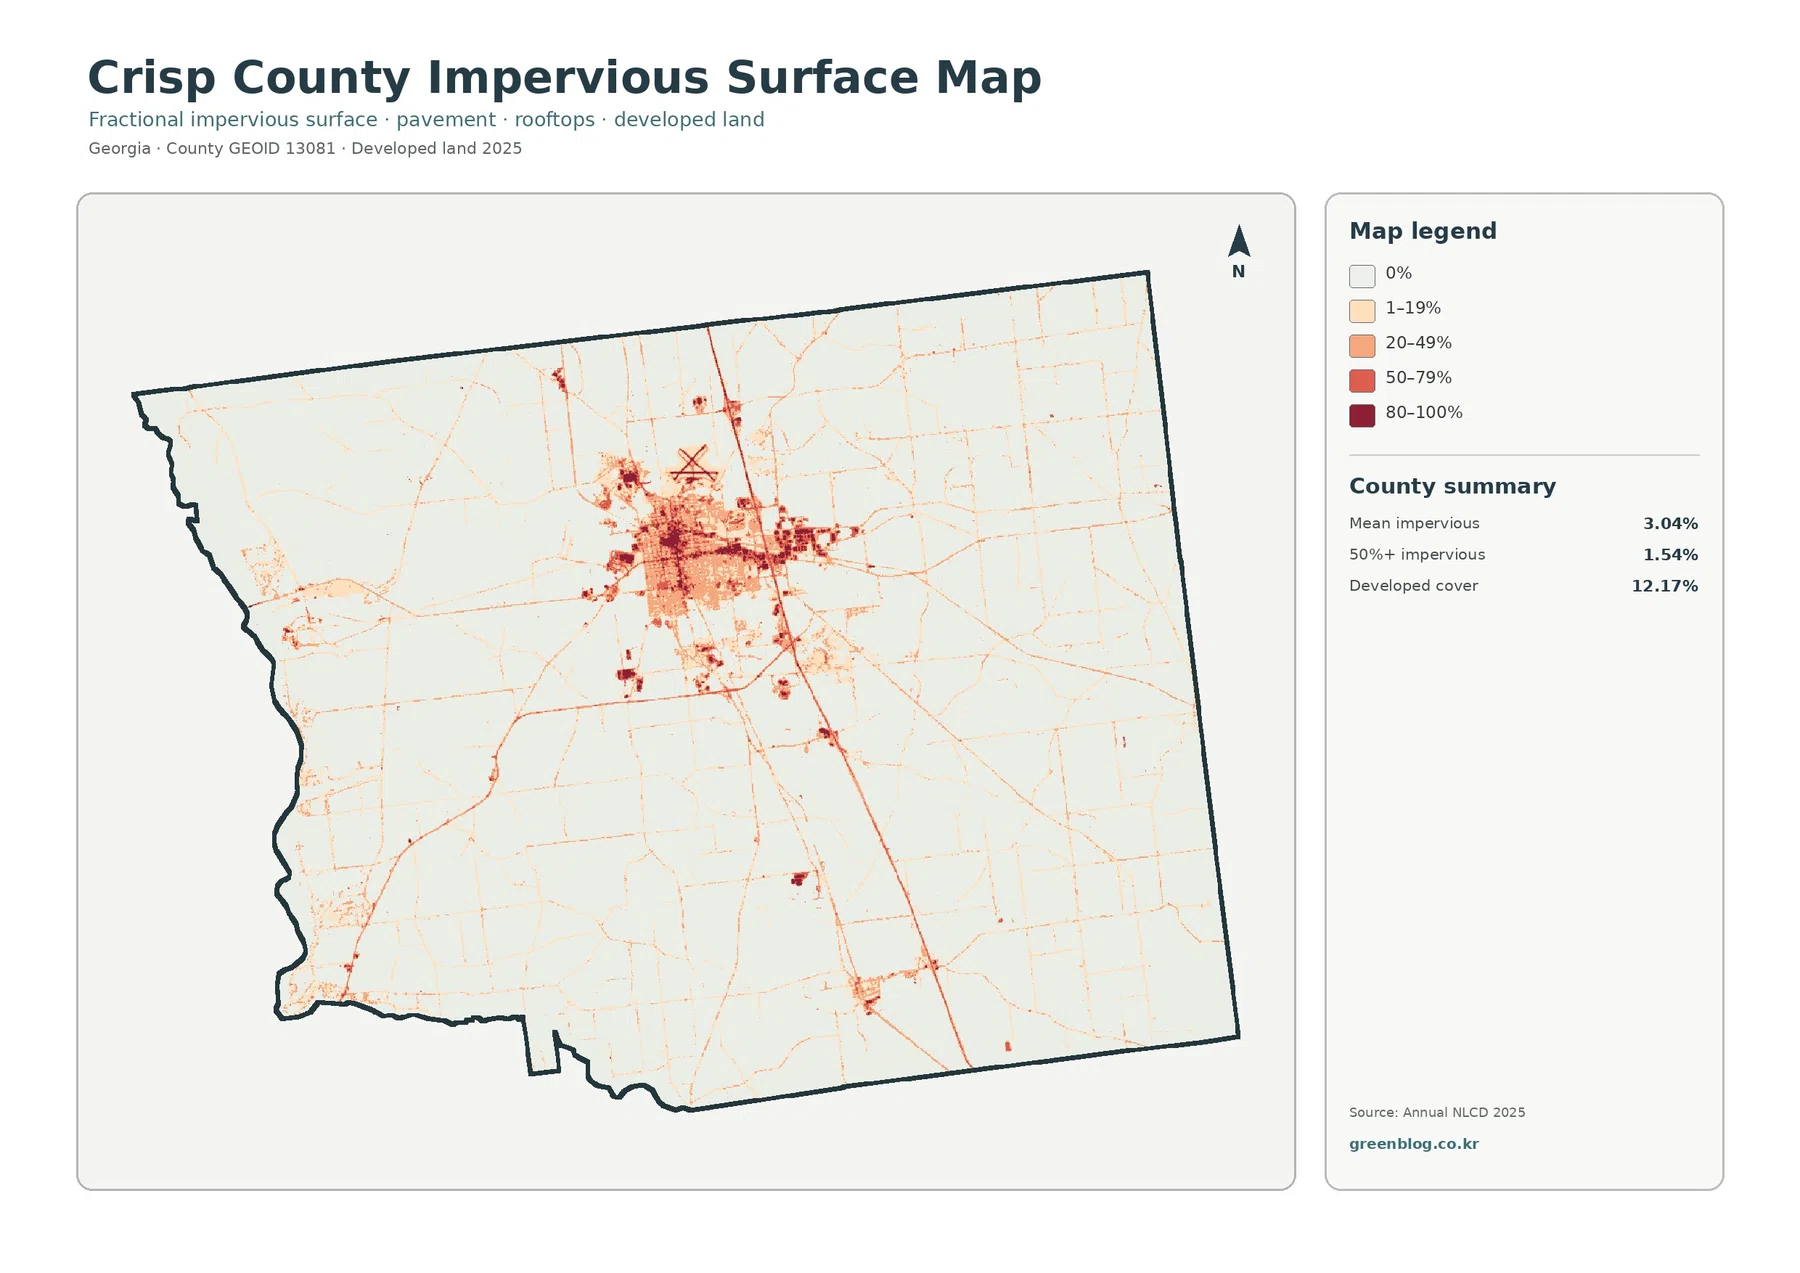
Impervious surface means ground covered by materials such as pavement and rooftops that allow little water to soak into the soil. Crisp County has a mean impervious value of 3.04%, while 1.54% of the county is mapped at 50% impervious or higher. Both figures are much lower than the 12.17% developed-cover share because developed classes can include lawns, trees, bare ground, and other permeable surfaces around buildings and roads.
The strongest hard-surface cluster sits in and around Cordele. Darker cells fill the urban center, while thinner lines extend along travel routes beyond it. An especially clear north-south line appears east of the main city cluster, and several east-west connections are visible as well. Crisp County’s official road map identifies I-75, US 41, US 280, and other major routes, but the land-cover image does not label those highways. For route-specific work, the two map types should be compared rather than assuming a line’s identity from shape alone.
Outside the central area, most of the county is very light on the impervious map. Rural roads remain visible as fine traces, with occasional darker spots around smaller developed sites. This difference helps distinguish a countywide developed class from the truly hard-surfaced portions of the landscape. It is also useful when explaining why a farm-dominated county can still contain a compact urban center with a very different surface pattern.
Farm blocks, wet corridors, and forest patches share the rural landscape
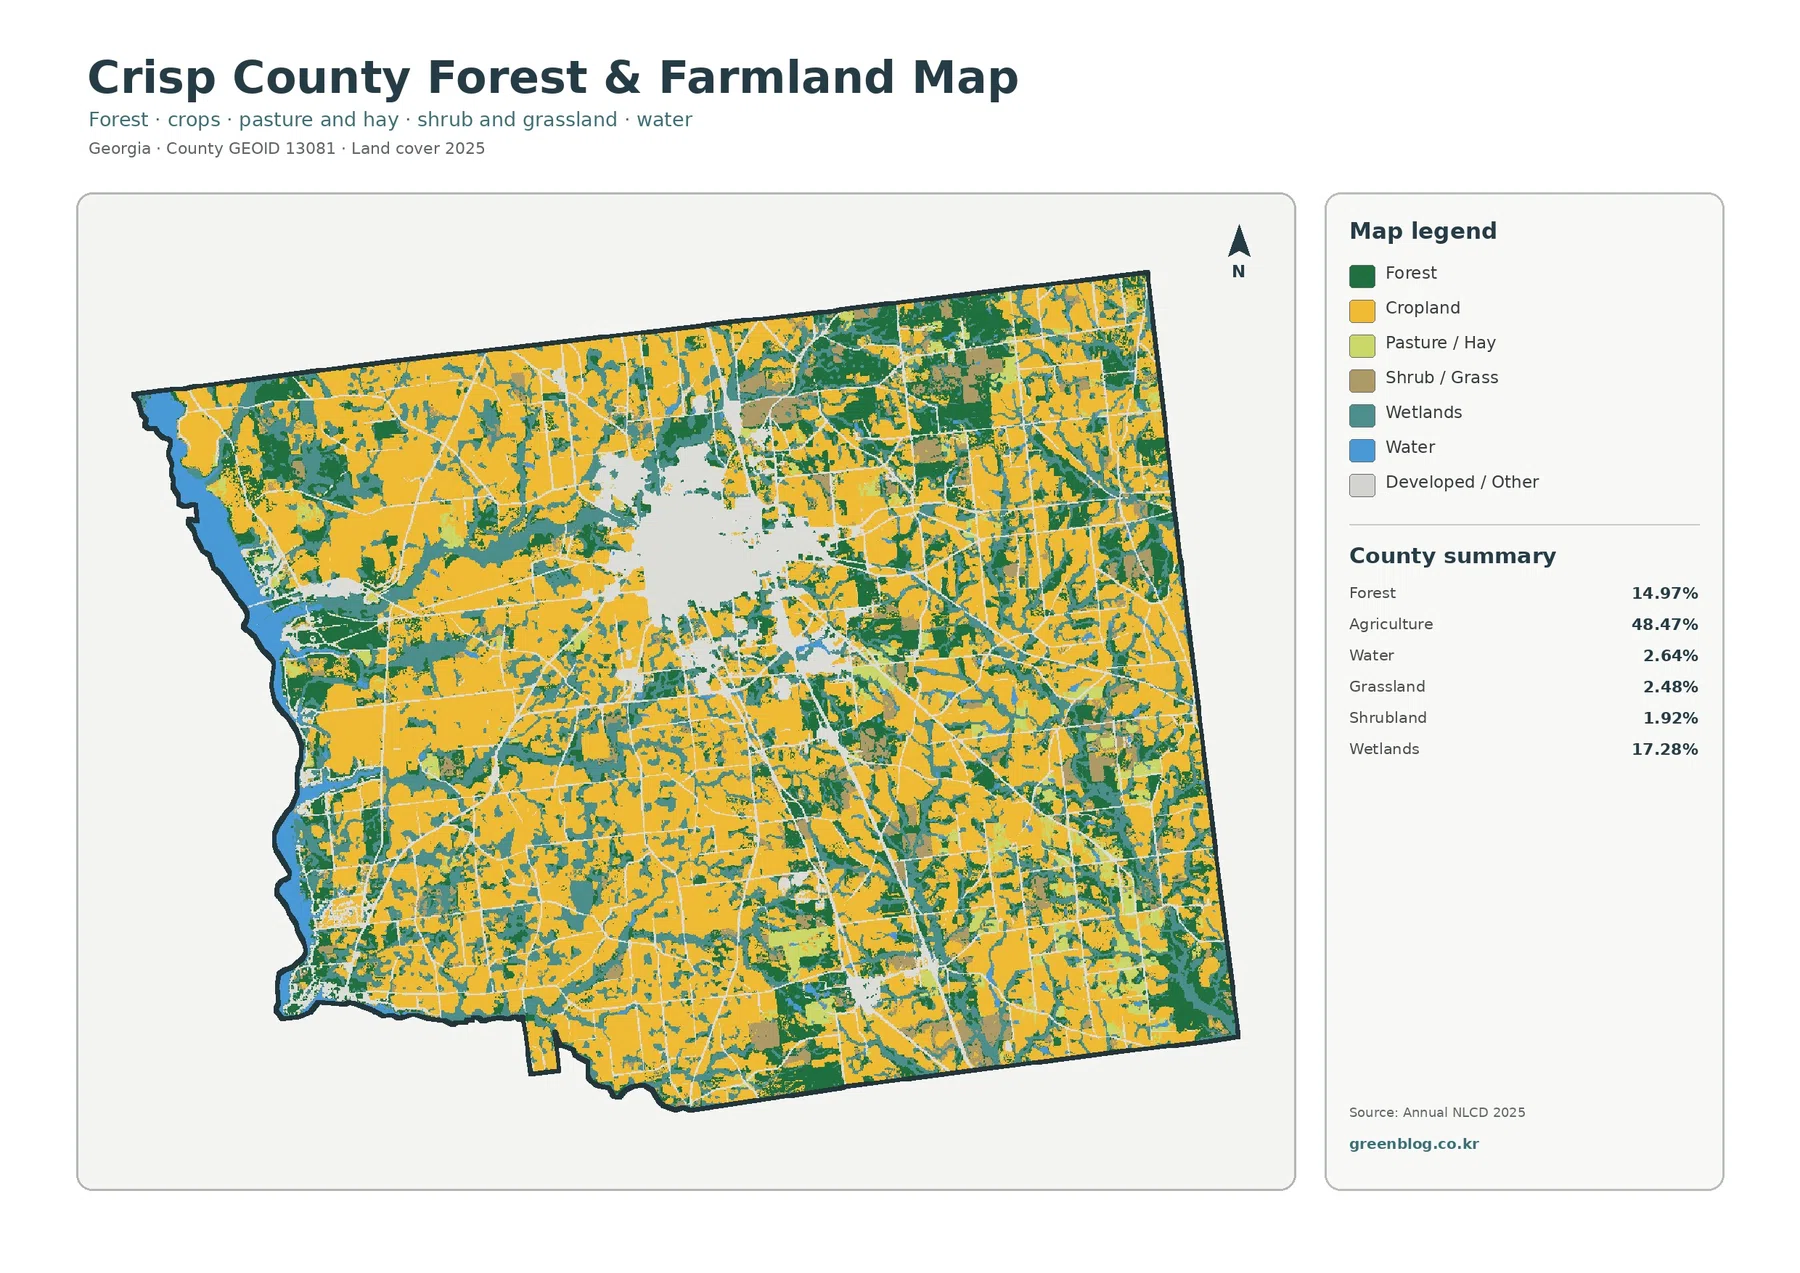
The forest-and-farmland map puts the rural side of Crisp County in clearer focus. Agriculture remains 48.47%, forest is 14.97%, wetlands are 17.28%, grassland is 2.48%, shrubland is 1.92%, and water is 2.64%. Large yellow blocks occur across the north, south, and east, but they are repeatedly interrupted by green and teal. The pattern is therefore better described as an agricultural mosaic than as one uninterrupted farm belt.
Forest appears in larger clusters toward parts of the northeast and southeast and in smaller strips between fields throughout the county. Wetlands often form narrow, branching bands that cross agricultural areas. Near the western water edge, forest and wetland cover become more prominent than they are across many interior farm blocks. These transitions are useful for environmental education because they show how different surface types can meet within a short distance.
The broad pale area around Cordele on this specialized map removes much of the urban detail from the farm-versus-forest comparison, making the contrast between city and countryside more obvious. It also prevents the agricultural percentage from being confused with legal farmland designation. Annual NLCD describes physical cover seen at the surface; it does not determine ownership, zoning, conservation status, or whether a parcel is actively being farmed in the legal or tax sense.
The 1985–2025 comparison records several kinds of class difference
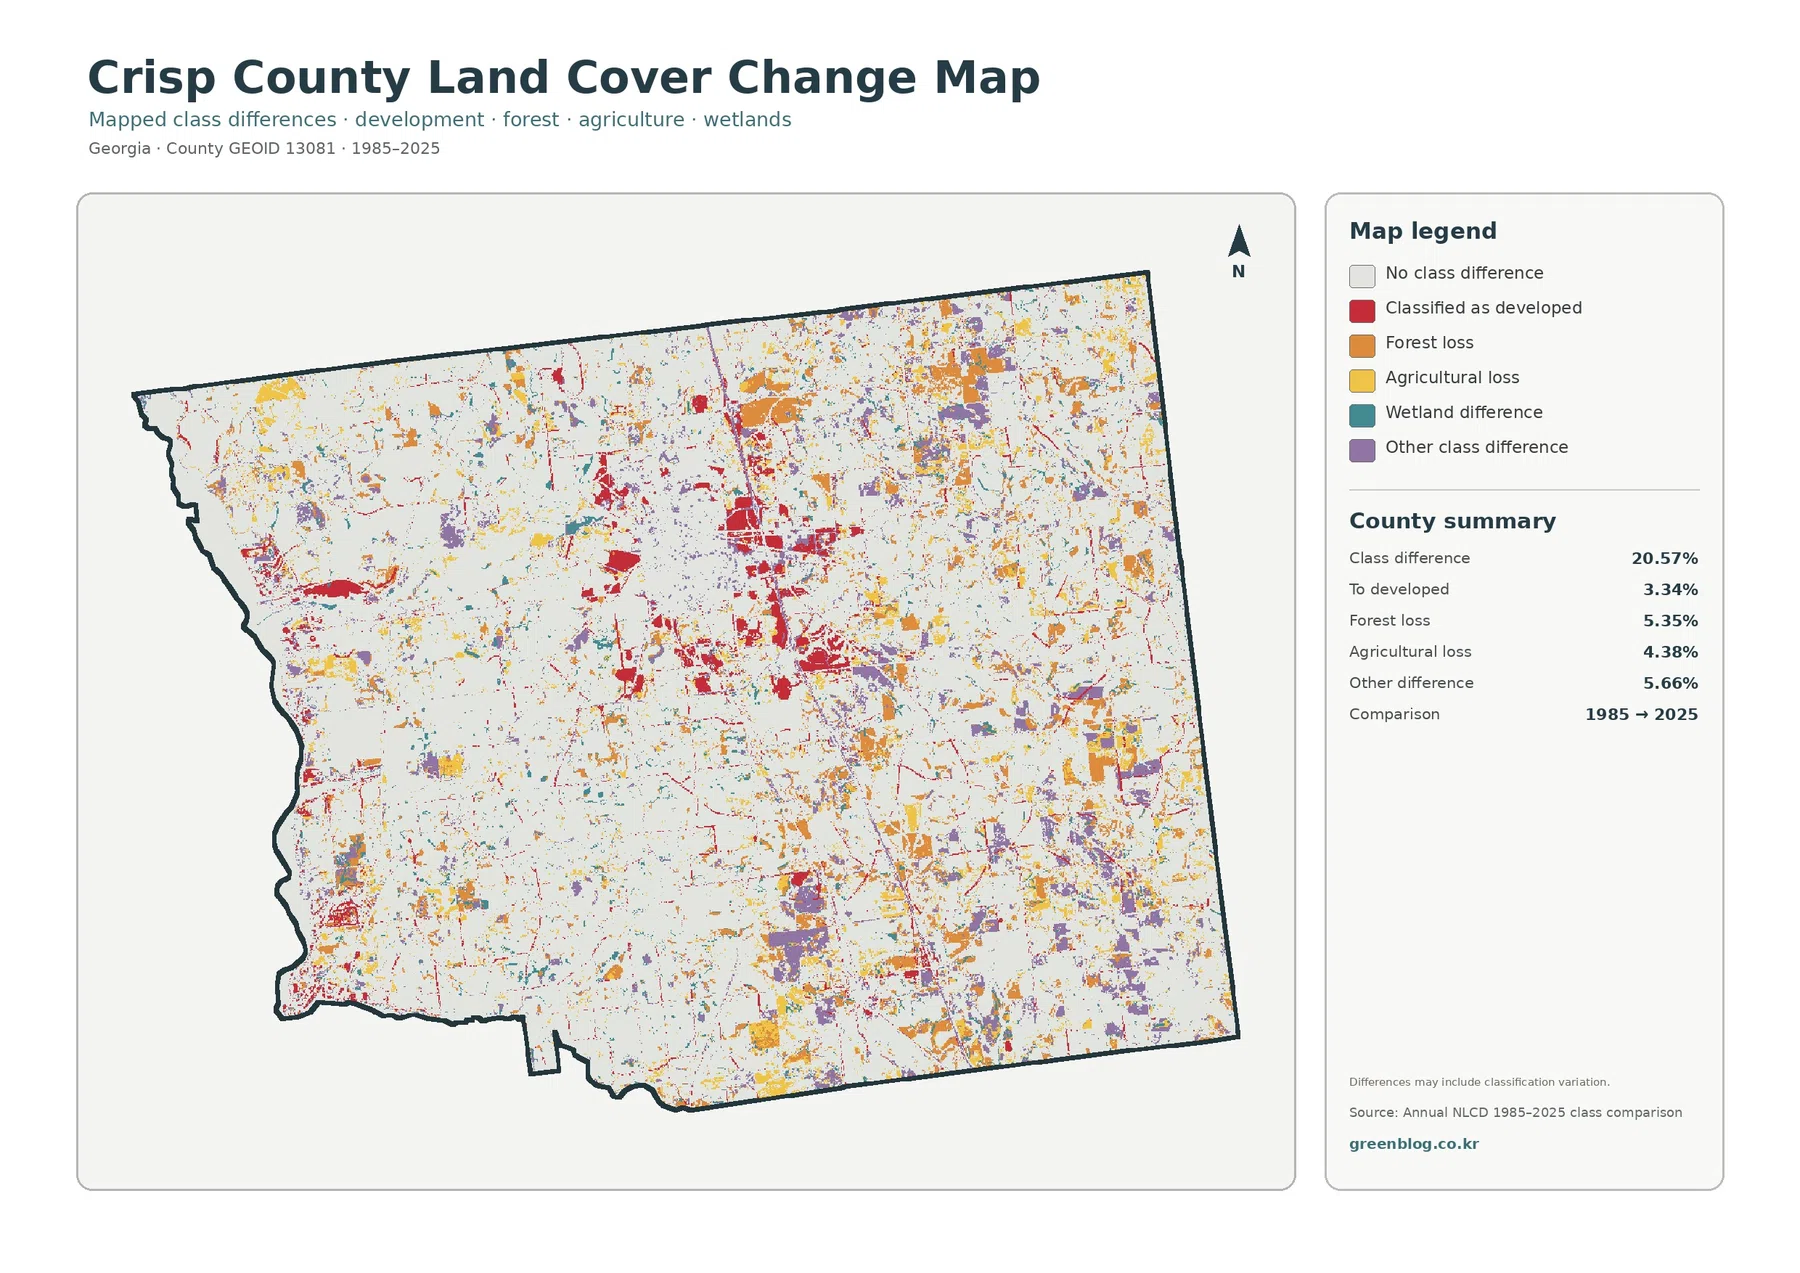
Across Crisp County, 20.57% of cells fall into a different class in the 1985–2025 endpoint comparison. The summary lists 3.34% as classified to developed, 5.35% as forest loss, 4.38% as agricultural loss, and 5.66% as other class difference. No single category accounts for the whole change map. Red developed differences are noticeable around Cordele, while orange, yellow, purple, and smaller teal changes are dispersed across rural areas.
That distinction matters because an endpoint change map is not a year-by-year history. A cell labeled forest loss means its representative class differed between the two selected dates; it does not identify the exact year of clearing or prove why the change occurred. Agricultural loss has the same limitation. Crop rotation, vegetation recovery, timber activity, construction, water conditions, and classification variation can all require further investigation before a cause is assigned.
The map works best as a screening tool. Areas with concentrated red around the urban center can be checked against historical aerial imagery or intermediate land-cover years, while rural patches can be reviewed separately for agricultural or forest change. The gray background, where no class difference is shown, is just as important: it indicates that much of the county retained the same mapped endpoint class even though conditions within a class may still have changed.
How the four maps can be combined without overreading them
For a general county profile, begin with the 2025 land-cover map because it gives the clearest balance among farms, wetlands, forest, water, and developed land. The forest-and-farmland version is better when the subject is agriculture, vegetation, habitat context, or the way wet corridors divide farm blocks. The impervious map is the strongest choice for a discussion of Cordele’s built surface because it separates hard materials from the broader developed class.
The change map belongs in projects that need an endpoint comparison rather than a simple current snapshot. It can support questions about where additional research should be directed, but it should not be presented as a complete record of four decades. Pairing it with the 2025 map is especially helpful: the current map tells the reader what class is present now, while the change image indicates where the 1985 class was different.
Crisp County’s official planning department provides a separate zoning map and land-development information. That distinction is important for any planning discussion. A land-cover map can provide geographic context, but decisions about permitted use, parcel boundaries, building, flood requirements, or rezoning must rely on current local records. The map set here is designed for county-scale reference, not for a permit or survey determination.
Scale, date, and classification limits to keep in mind
Annual NLCD uses 30-meter raster cells. A raster is a grid, and each square receives a predominant class even if more than one surface exists inside it. A field edge may share a cell with a ditch, trees, pavement, or a building. These mixed cells explain why class boundaries can look blocky and why zooming in cannot turn the image into a parcel survey.
The 2025 maps represent the supplied observation year. New construction, harvest, timber work, storm damage, vegetation regrowth, or changing water levels after that date may not appear. The UGA Crisp County Extension office provides local agriculture and environmental information that can help add context, while current aerial imagery and local government records are better choices for site-specific questions.
Each original JPG is 2480 × 1754 pixels. The package does not identify those files as meeting an A3 high-resolution reference, so large-format printing should be tested before final use. Upscaling can make a file larger, but it does not restore detail that was not present in the original map. For normal reports, slides, and county comparison sheets, preserving the original aspect ratio usually gives the most predictable result.
Frequently Asked Questions
Why does Crisp County look strongly agricultural even though wetlands cover 17.28%?
Agriculture is the largest class at 48.47%, so farm blocks dominate much of the county. Wetlands are still substantial and often appear as branching corridors through or beside those fields, especially toward the western water edge. The two classes can therefore be visually close even though agriculture remains the leading countywide category.
Does the 12.17% developed share mean 12.17% of the county is paved?
No. Developed classes can contain lawns, trees, soil, and other permeable surfaces as well as buildings and roads. Mean impervious cover is 3.04%, and only 1.54% of the county is mapped at 50% impervious or higher, which is why the hard-surface totals are much smaller.
Can the 20.57% class difference be treated as the amount of land permanently changed since 1985?
No. It is the share of cells assigned different endpoint classes in 1985 and 2025. Some differences may reflect real land-cover change, but the map does not provide the exact date or cause, and classification variation can also contribute. Intermediate imagery and local records are needed for a firm history.
Sources and Reference Data
- MRLC Annual NLCD Data – official access to annual land-cover and comparison datasets
- USGS Annual NLCD Land Cover Classification – class definitions and guidance for agriculture, forest, wetlands, developed land, and related cover
- U.S. Census Bureau TIGER/Line Shapefiles – official county-boundary reference for Crisp County
- Crisp County Planning, Zoning & Codes – local planning, zoning-map, land-development, and flood-resource information
- UGA Extension – Crisp County – county agriculture, environmental, and natural-resource education
- Crisp County – Our History – official local context for Cordele, the Flint River, and Lake Blackshear
Map File Information
The ZIP contains the four original Crisp County JPG maps for 2025 land cover, forest and farmland, impervious surface and developed land, and the 1985–2025 class comparison.
- Included Files: Four original JPG land-cover maps
- File Type: JPG files in one ZIP archive
- Intended Use: Printing, education, presentations, and map-based projects
Related Maps
- Appling County Georgia Land Cover Map
- Atkinson County Georgia Land Cover Map
- Bacon County Georgia Land Cover Map
Green Map creates custom-edited map images using open geographic data sources such as geoBoundaries, Natural Earth, OpenStreetMap, and government open data.
These maps are edited visual materials, not raw data files, and are provided for education, documents, presentations, and graphic reference.