Forest is the defining land-cover class in Crawford County in the supplied 2025 data, covering 52.89% of the county. Agriculture accounts for 13.65% and wetlands for 11.10%, while developed land remains a much smaller part of the county. This Crawford County Georgia Land Cover Map set helps compare those broad patterns with hard surfaces and mapped changes since 1985.
Four map views are included: 2025 land cover, forest and farmland, impervious surface and developed land, and a 1985–2025 class-difference map. The WebP images can be reviewed on the page, and the four original 2480 × 1754-pixel JPG maps are available together in one ZIP for county profiles, lessons, presentations, and regional comparisons.
Table of Contents
A forest-dominant county with several different land-cover settings
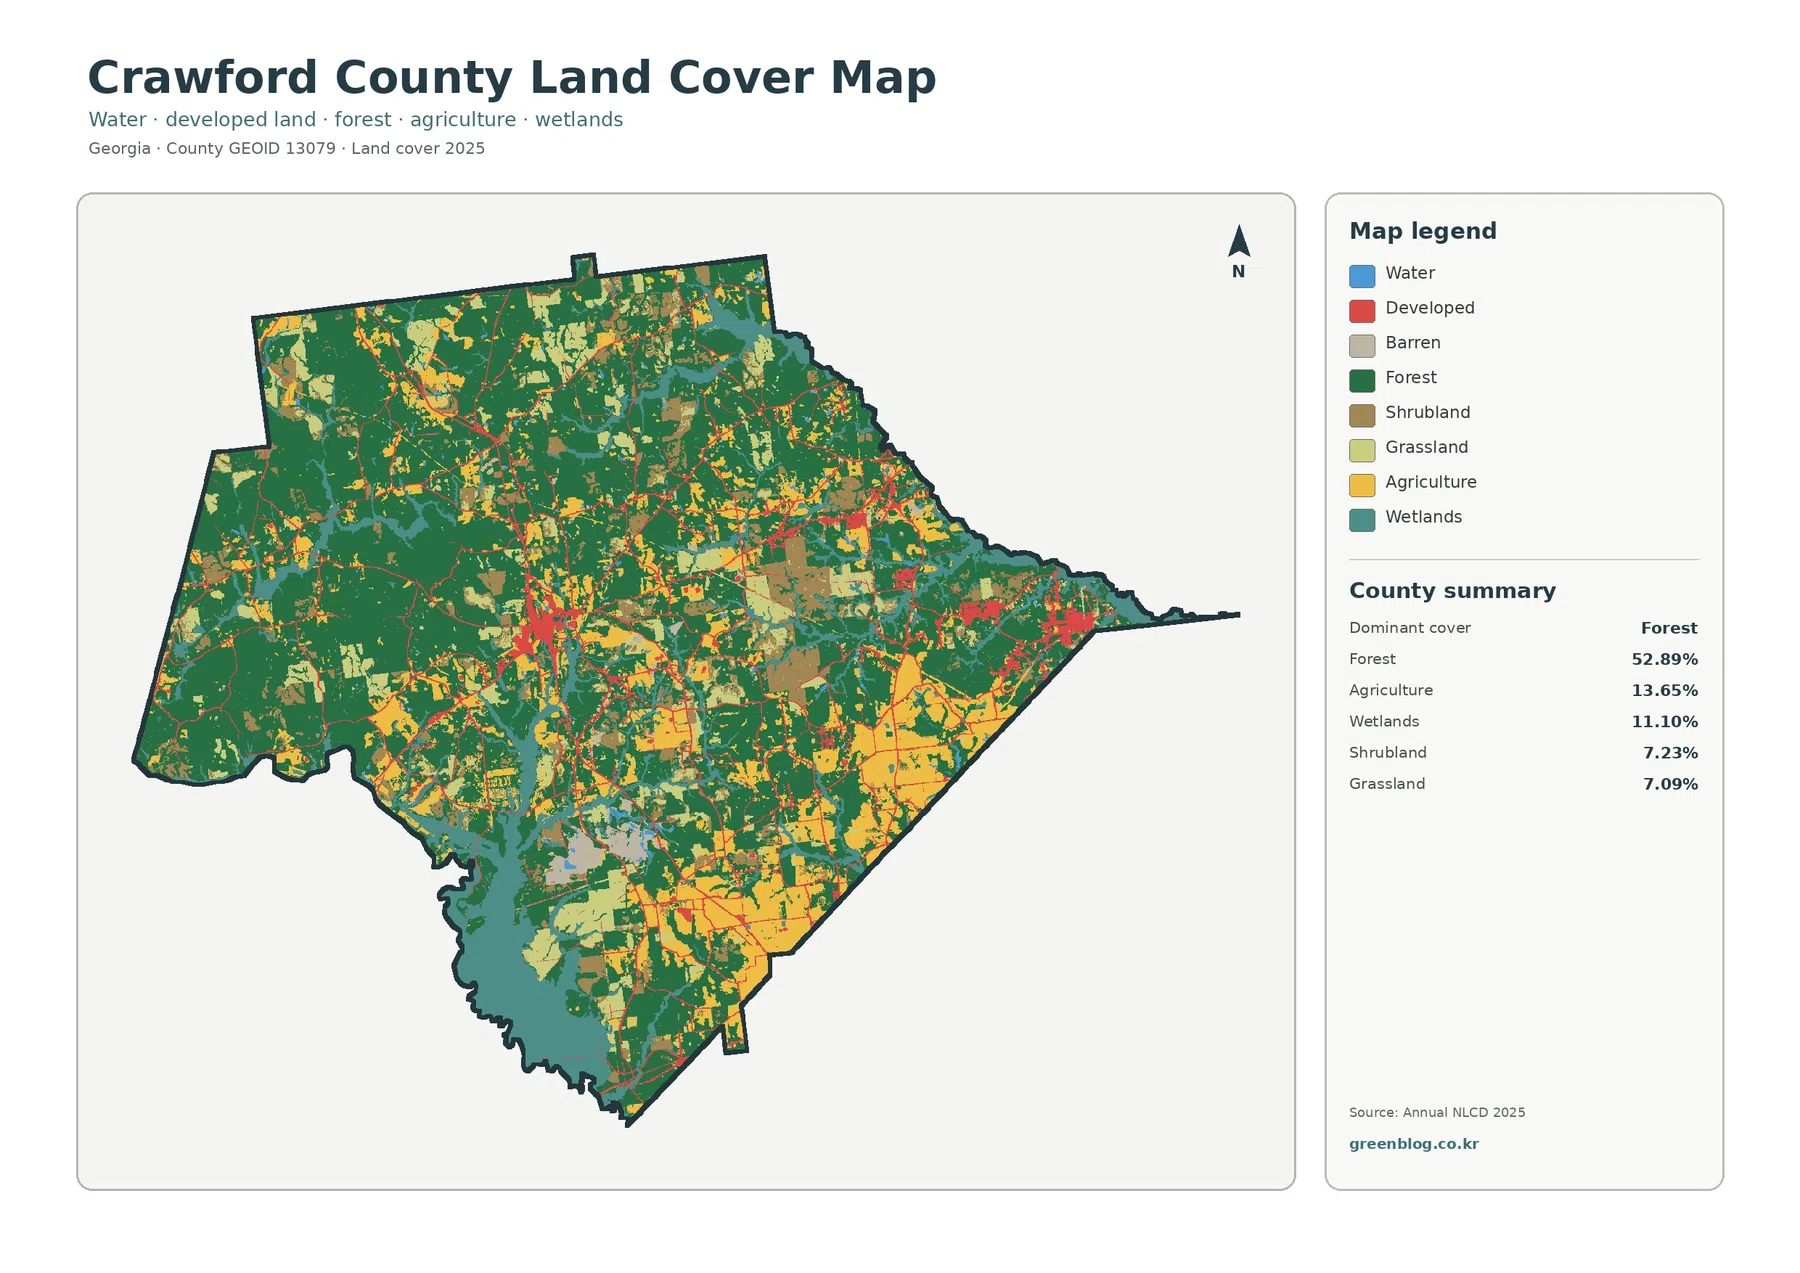
The countywide map is not dominated by a single uninterrupted forest block. Instead, dark green forest appears across much of the west, north, and interior, with fields, wetlands, shrubland, grassland, and developed areas interrupting it at many points. Forest still leads by a wide margin at 52.89%, so the overall impression is much greener than a suburban county even though the surface is far from uniform.
Agriculture makes up 13.65% of the 2025 summary. Larger yellow areas are especially noticeable toward the southeast, while smaller agricultural blocks are scattered through the center and northwestern portions of the county. Wetlands account for 11.10% and are more concentrated in the south and southwest, with narrower wet areas appearing between forest and other classes elsewhere.
Shrubland represents 7.23% and grassland 7.09%. Those classes matter because they keep the county from looking like a simple forest-versus-farm landscape. They appear in patches between forest, fields, and wet ground, creating many short transitions from one cover type to another. Open water is only 0.62%, so the 11.10% wetland share should not be mistaken for an equally large amount of exposed lake or river surface.
Farm blocks become easier to separate from the surrounding forest
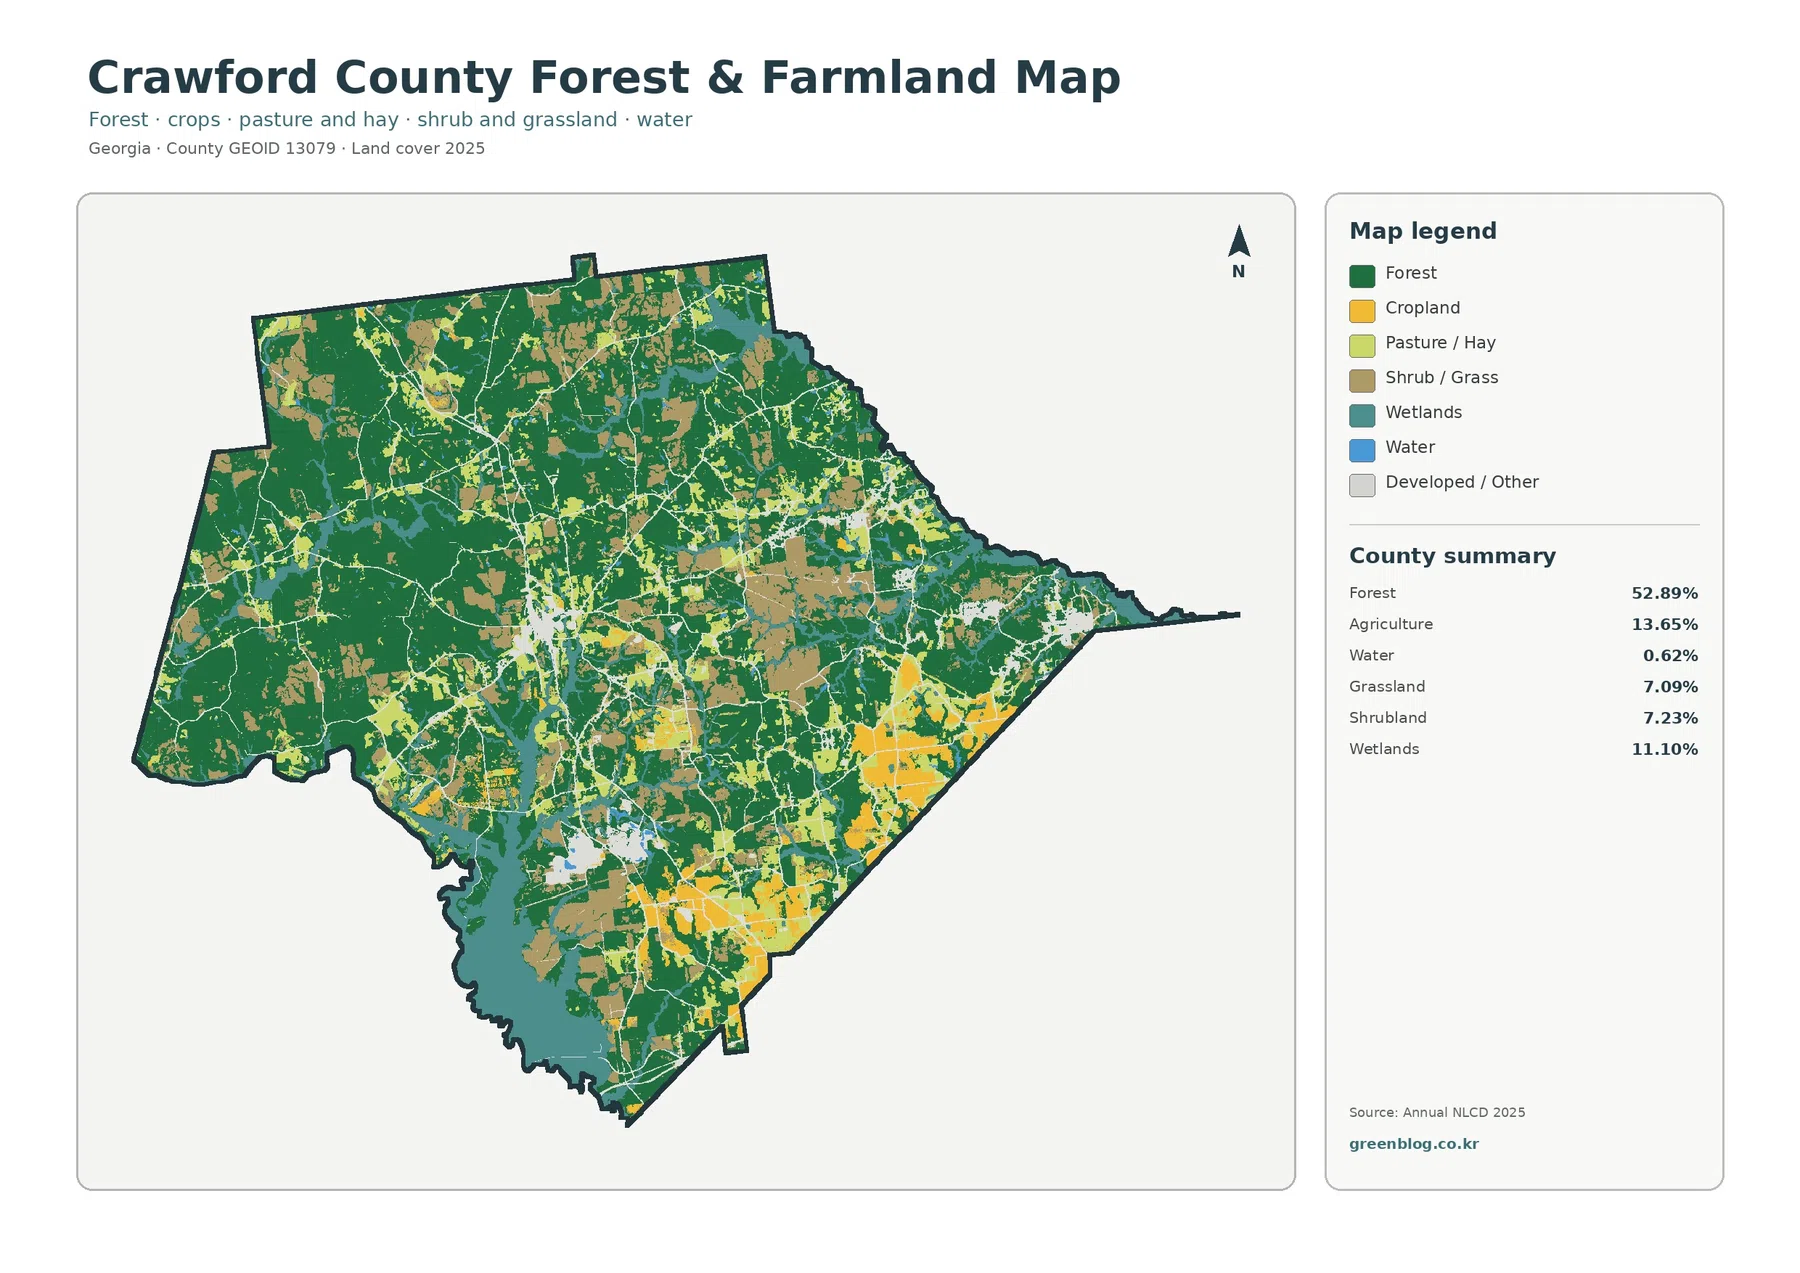
The forest-and-farmland view is useful when the smaller land-cover classes make the general map feel busy. Broad forest areas remain prominent across the western and northern portions of Crawford County, while the southeast contains larger and more continuous agricultural blocks. Farmland also appears elsewhere, but much of it is broken into smaller pieces among forest and other cover.
Pasture or hay and shrub or grass cover add another layer to the agricultural picture. They occur around field areas and along forest edges rather than forming one countywide belt. That distinction matters for classroom or presentation use because a yellow cropland patch, a lighter pasture area, and a brown shrub or grass patch do not represent the same surface even when all three appear in a rural setting.
This map should not be used as a farm-parcel map. Annual NLCD classifies the surface seen by the dataset, not ownership, zoning, field boundaries, crop contracts, or legal land use. A parcel that includes woods, a field, a driveway, and a pond may be represented by several 30-meter cells, and each cell receives a predominant class. That is appropriate for county-scale comparison but not for property-level decisions.
Hard surfaces are concentrated in a few small areas
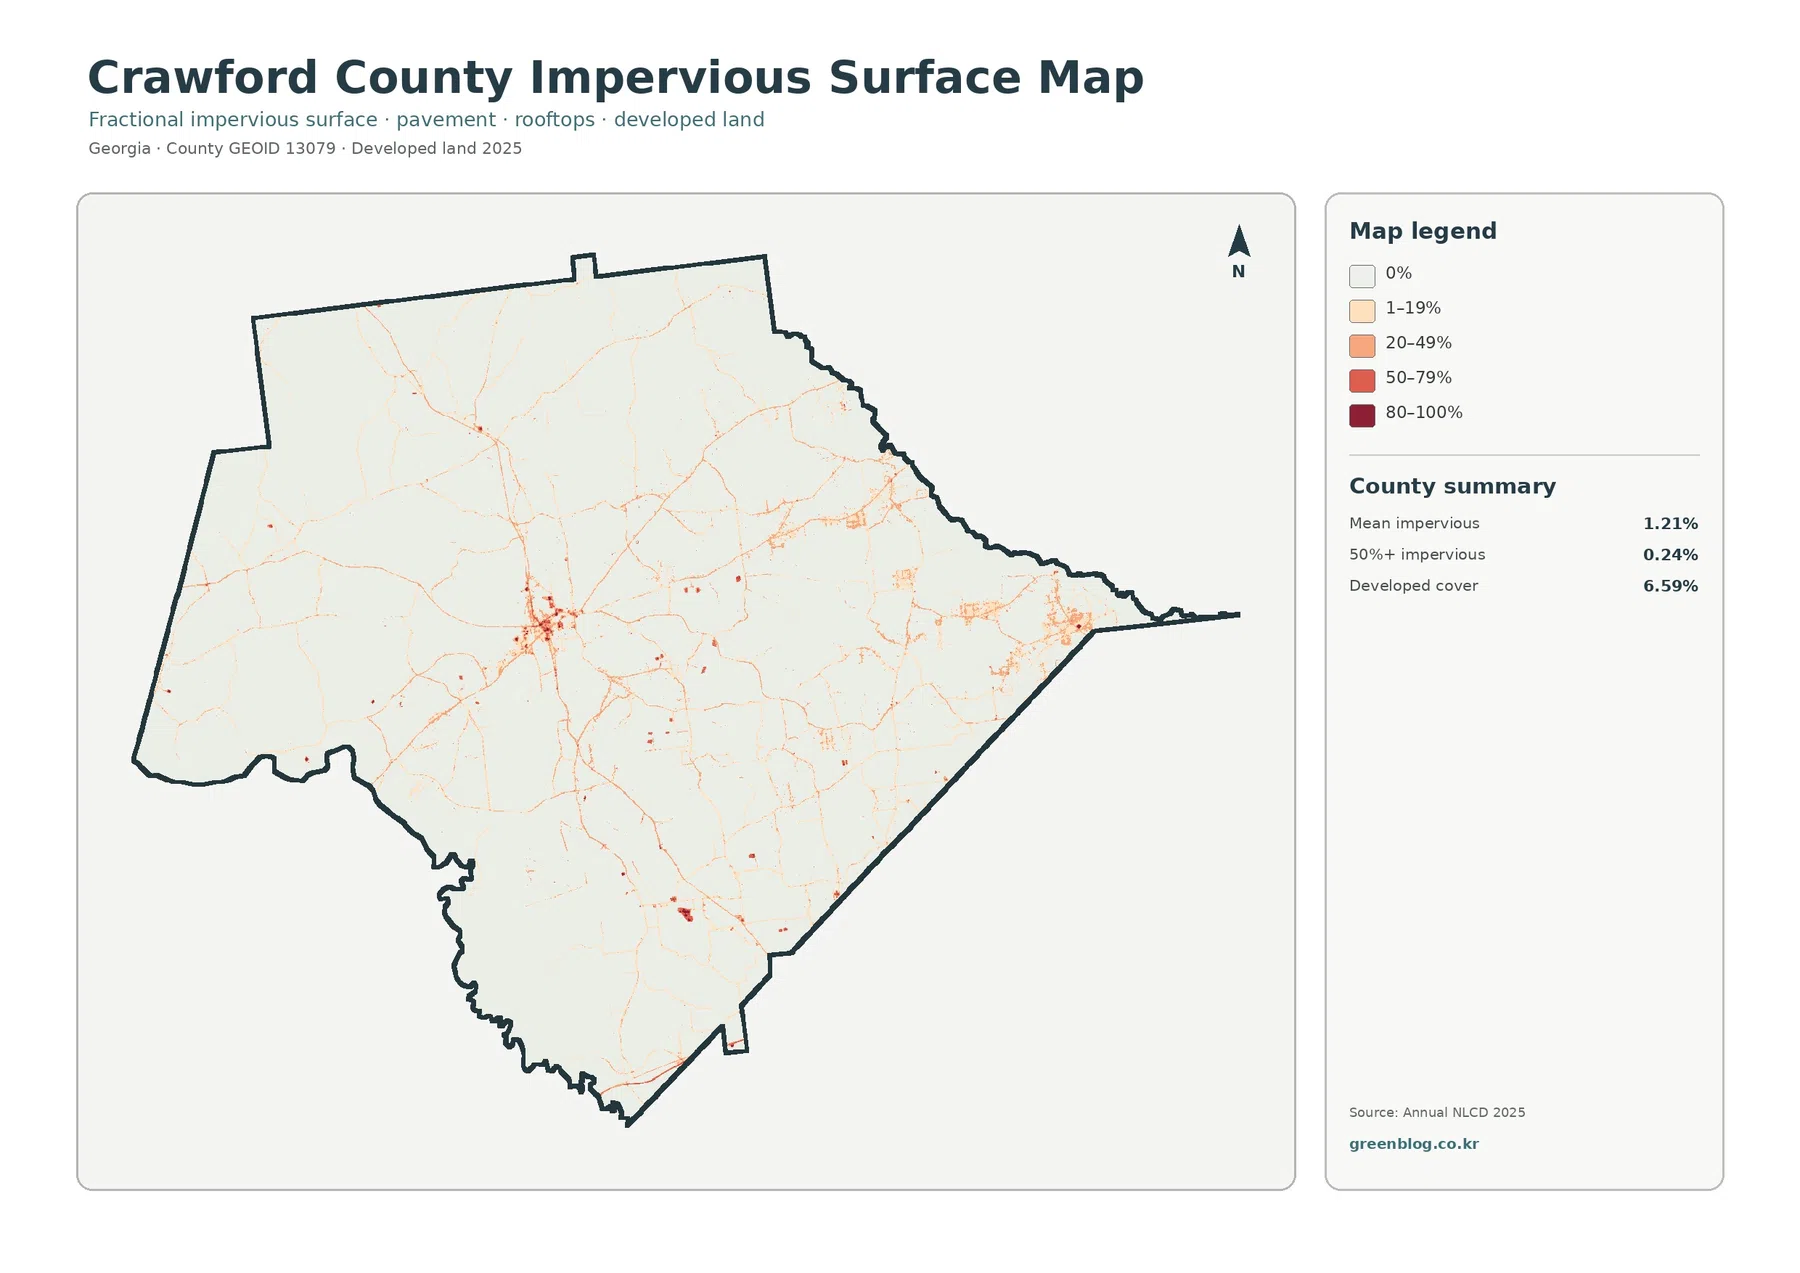
Developed cover is 6.59%, yet mean impervious cover is only 1.21%. The difference is important. A developed land-cover class can include lawns, trees, bare soil, and other surfaces that still absorb water, while impervious cover focuses on roofs, paved roads, parking areas, and similar hard surfaces.
Most of Crawford County is very light on the impervious map. The strongest cluster appears near the central part of the county, with another smaller concentration toward the eastern side and thin lines extending between scattered developed places. County government offices are based in the Roberta area, and the official planning pages also cover the incorporated area of Roberta, which provides useful orientation for the central developed concentration. The map itself does not draw municipal boundaries, so those colors should not be treated as an exact city outline.
Only 0.24% of the county falls in cells with at least 50% impervious cover. Darker red areas are therefore limited and isolated. For a county profile, this is more informative than simply saying that development exists: built surfaces are present, but they occupy a small share of a landscape still dominated by forest and other permeable cover.
The 1985–2025 comparison is mostly about forest loss and other class differences
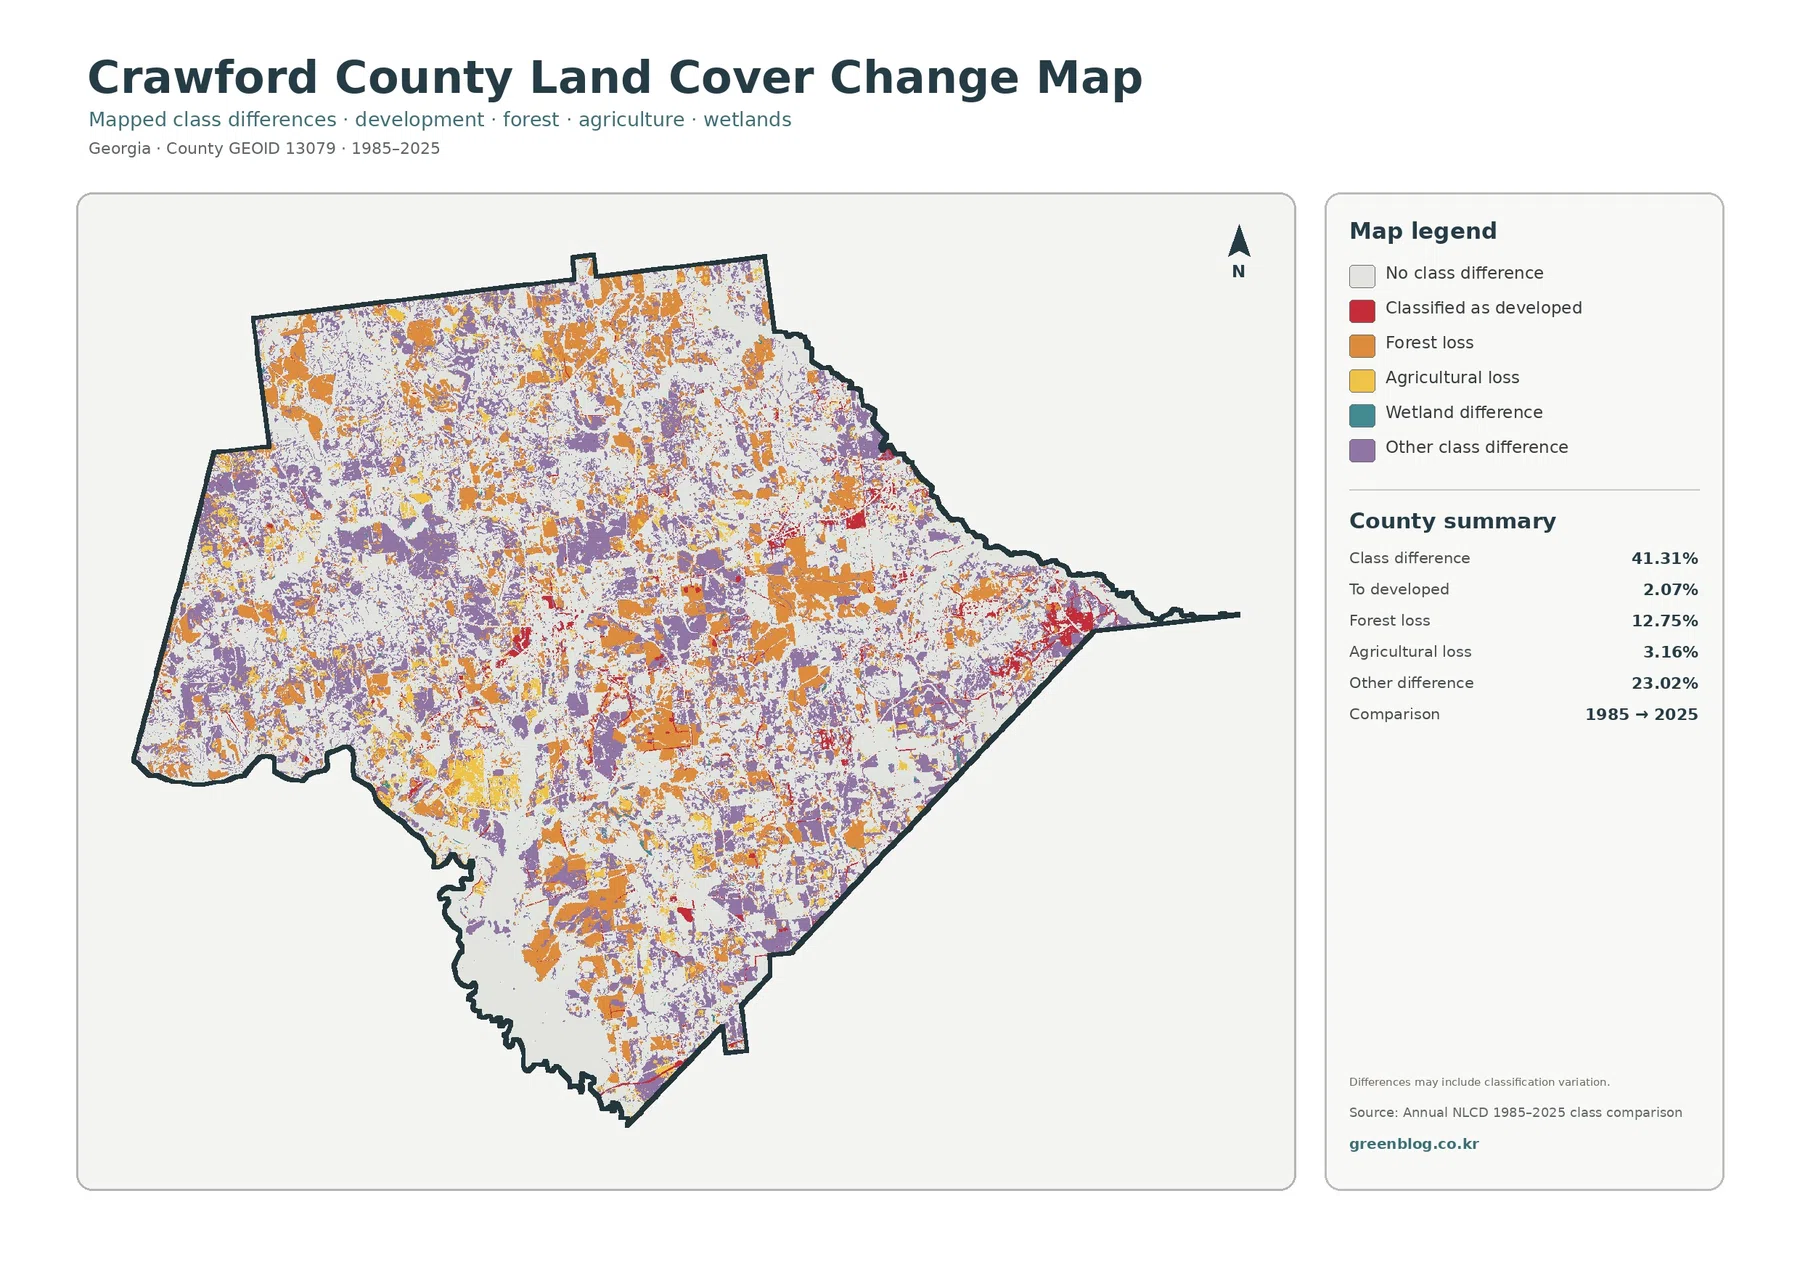
The comparison reports a class difference across 41.31% of the county. That figure is not the same as saying that 41.31% of Crawford County was physically transformed. The map compares classifications at two endpoints, so real surface change can be mixed with differences caused by class boundaries, mixed pixels, or classification variation.
Forest loss is the largest named change category at 12.75%. Agricultural loss accounts for 3.16%, and 2.07% of cells are classified as developed at the 2025 endpoint after another class in 1985. The largest category overall is “other class difference” at 23.02%. On the map, orange forest-loss patches and purple other differences are spread widely, while developed transitions are much more limited and tend to appear around existing concentrations of built cover.
Those numbers make the map useful as a screening tool rather than a final explanation. A researcher can identify places where the two endpoints disagree, then consult intermediate aerial photographs, annual land-cover products, forestry records, agricultural information, or local permit history. The map does not identify the exact year or cause of every change.
Choosing the right map for a county profile or lesson
For a general introduction, the 2025 land-cover map is the best starting point because it keeps every major class together. It quickly establishes the county’s forest majority and shows where agriculture, wetlands, grass or shrub cover, and development interrupt that forest. A short county profile can often use this one map as the overview and then add a second map for the topic being discussed.
An agriculture or habitat lesson benefits from the forest-and-farmland version because it separates field and pasture settings from the surrounding woodland more clearly. The impervious map is better for a discussion of settlement intensity, runoff context, or the difference between developed land and actual pavement. When the subject is long-term change, the endpoint comparison belongs last, after readers already understand the 2025 pattern.
Using the maps in that order also reduces a common interpretation problem. A red cell on the impervious map, a red developed class on the land-cover map, and a red developed transition on the change map are related ideas, but they do not mean exactly the same thing. Keeping the legends separate prevents a reader from combining percentages that measure different features.
What the maps can and cannot tell you
Annual NLCD is designed for broad land-cover analysis. Its 30-meter raster cells generalize the landscape, and a mixed cell can contain more than one real-world surface even though the dataset assigns a predominant class. Enlarging the image makes the cells larger on screen but does not create parcel, driveway, building, or field-boundary detail that was never present in the source data.
Land cover is also different from zoning or legal land use. A forest-classified cell is not automatically protected forest, and an agricultural cell does not establish that a parcel is legally zoned for agriculture. Crawford County Planning and Zoning maintains separate zoning and permitting resources, including a zoning web map, for questions that require legal or regulatory information.
The local UGA Extension office is another useful companion source because it provides research-based agriculture and natural-resource information for Crawford County, including soil and water services and production guidance. Those resources help place the mapped classes in a local management context without treating the land-cover image as a substitute for field observations or current records.
Original JPG files in the download
The ZIP contains one original JPG for 2025 land cover, one for forest and farmland, one for impervious surface and developed land, and one for the 1985–2025 land-cover comparison. Each JPG is 2480 × 1754 pixels. The package does not mark these files as meeting an A3 high-resolution reference, so test a large print before using one for a poster or display board.
Frequently Asked Questions
Does 52.89% forest mean that more than half of Crawford County is protected woodland?
No. It means that 52.89% of the 2025 land-cover cells are classified as forest. The map does not identify ownership, conservation status, timber rights, or legal protection, so those questions require separate official records.
Why is developed cover 6.59% when mean impervious cover is only 1.21%?
Developed classes can contain lawns, trees, soil, and other permeable surfaces along with buildings and roads. Impervious cover isolates the harder surfaces such as rooftops and pavement, so the countywide mean is much lower.
Is the 41.31% class difference a direct measure of land converted since 1985?
No. It is the share of cells assigned a different class at the two endpoints. Real change may be included, but classification variation and mixed-cell effects can also contribute. Intermediate imagery and local records are needed to establish timing and cause.
Sources and Reference Data
- MRLC Annual NLCD Data – official access point for annual land-cover and comparison products
- USGS Annual NLCD Land Cover Classification – definitions and guidance for forest, agriculture, wetlands, developed land, and related classes
- U.S. Census Bureau TIGER/Line Shapefiles – official county-boundary reference for Crawford County
- Crawford County Planning and Zoning – official county zoning, permit, land-use, and zoning web-map resources
- UGA Extension – Crawford County Agriculture & Natural Resources – local agriculture, soil, water, and natural-resource information
Map File Information
The ZIP contains four original JPG maps for comparing Crawford County forest, agriculture, wetlands, sparse impervious surfaces, and 1985–2025 land-cover class differences.
- Included Files: Four JPG maps shown on this page
- File Type: JPG files bundled in a ZIP archive
- Intended Use: Printing, education, presentations, and map-based projects
Related Maps
- Appling County Georgia Land Cover Map
- Atkinson County Georgia Land Cover Map
- Bacon County Georgia Land Cover Map
Green Map creates custom-edited map images using open geographic data sources such as geoBoundaries, Natural Earth, OpenStreetMap, and government open data.
These maps are edited visual materials, not raw data files, and are provided for education, documents, presentations, and graphic reference.