Forest remains the largest 2025 cover in Coweta County, but the county is not uniformly rural. The Coweta County Georgia Land Cover Map places a broad developed concentration around Newnan, extends built cover toward the northeast, and leaves much larger forest and farm areas across the west and south. The four views on this page separate those patterns so the county can be compared without treating every developed cell, field, or wet area as the same kind of surface.
The four original 2480 × 1754-pixel JPG maps are available together in one ZIP. They include 2025 land cover, a forest-and-farmland view, impervious surface, and a 1985–2025 class-difference map for use in county profiles, classroom comparisons, presentations, and general reference work.
Table of Contents
A forest-majority county with a distinctly built center
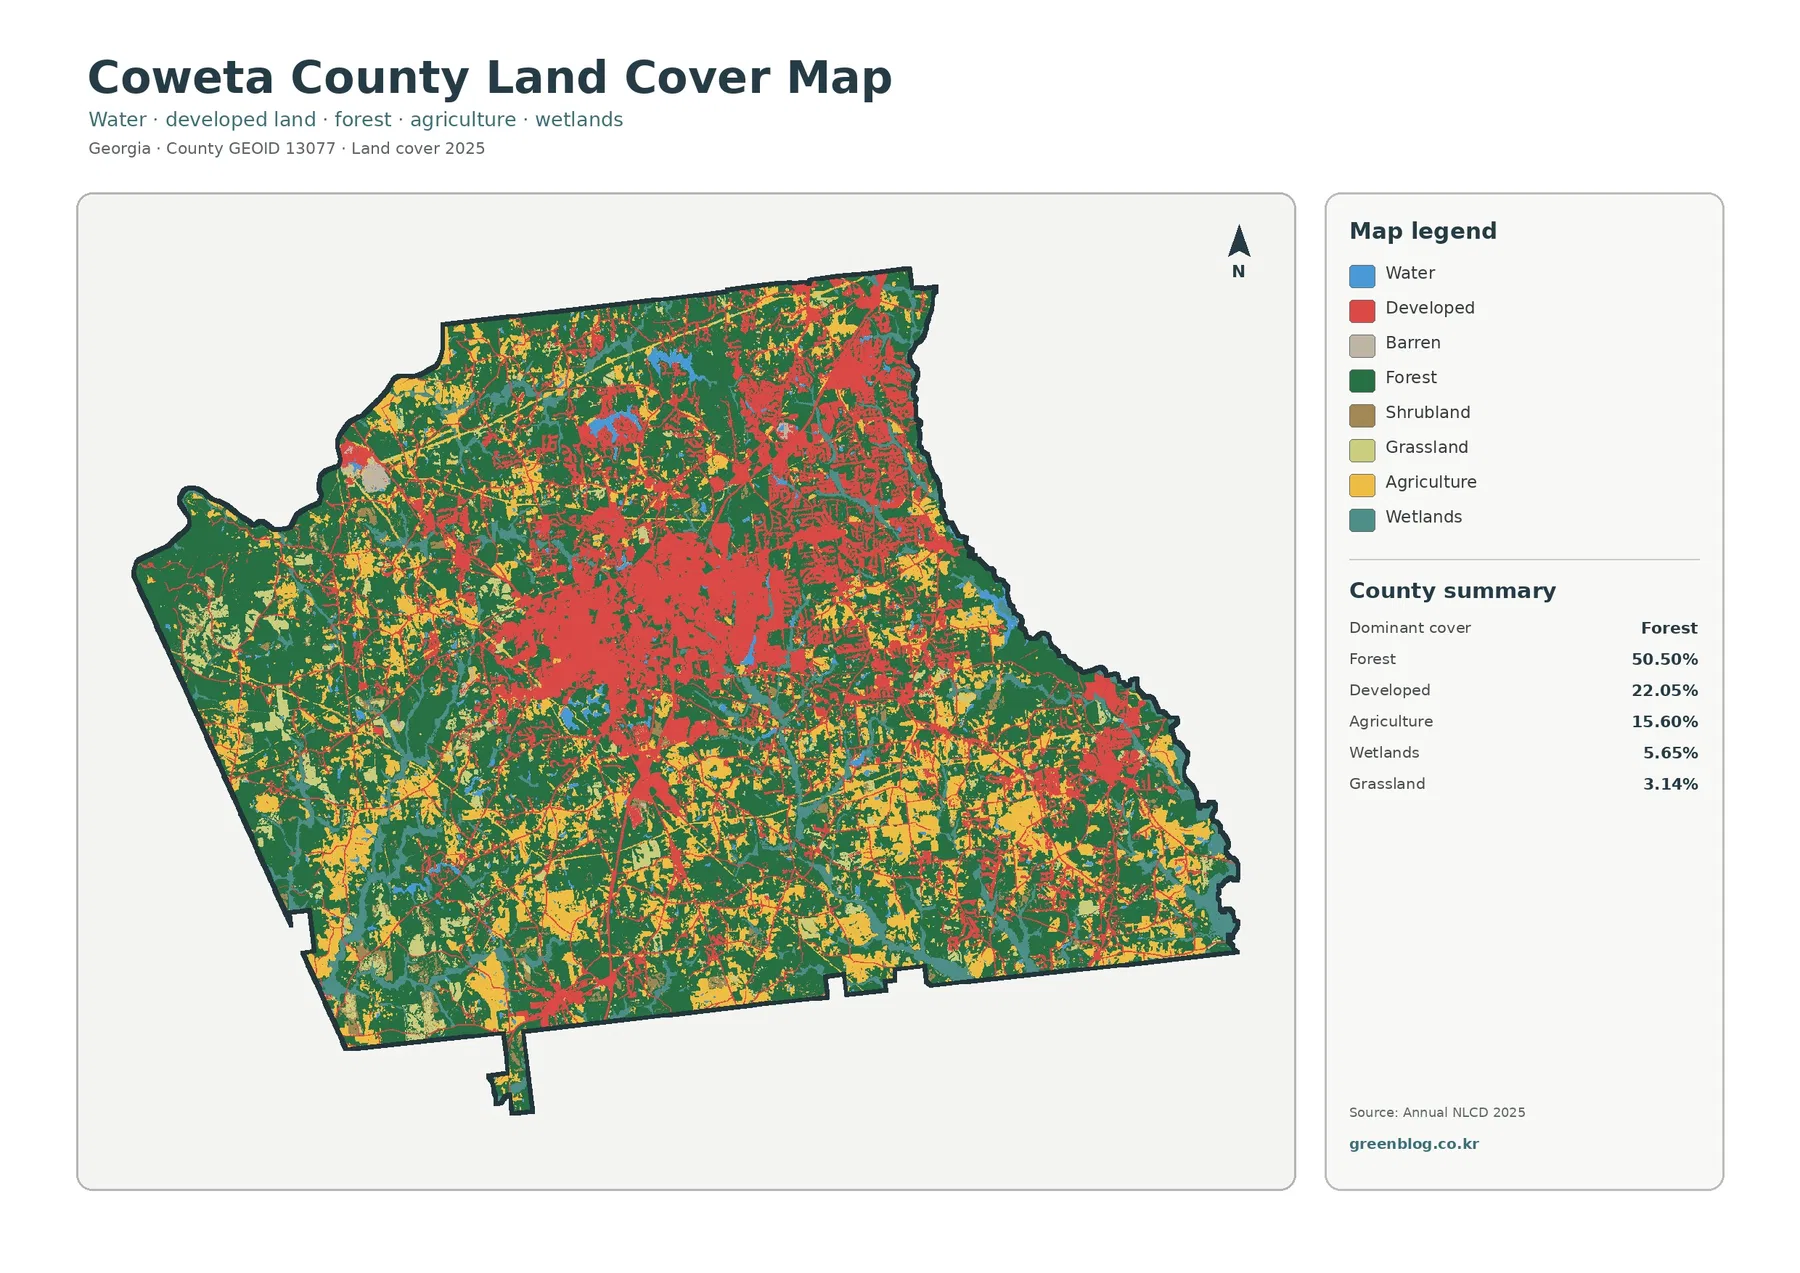
Forest accounts for 50.50% of the county summary, followed by developed cover at 22.05% and agriculture at 15.60%. Wetlands make up 5.65% and grassland 3.14%. Those percentages are useful, but the map adds an important detail: the categories are not evenly spread. Dark green is especially broad in the western part of the county, while the strongest red developed area occupies the middle around Newnan and continues through a more developed northeast.
Coweta County’s official geographic profile identifies Newnan as the county seat and notes that Interstate 85 bisects the county. That context matches the general location of the central and northeastern developed pattern, but it should be used carefully. The land-cover image does not draw city limits or label roads, so an individual red patch cannot be assigned to a municipality or highway from this map alone. An official transportation or boundary map is the right companion when exact place names matter.
South and southeast of the main developed concentration, yellow agricultural blocks become more frequent and forest remains interwoven between them. The eastern edge also contains developed patches, yet they are smaller than the central Newnan concentration. The west is different again, with a more continuous forest background and fewer large built areas. This mix is why the countywide percentage should be read together with location: 50.50% forest does not mean every part of Coweta looks heavily forested.
Fields break up the forest outside the Newnan-centered urban area
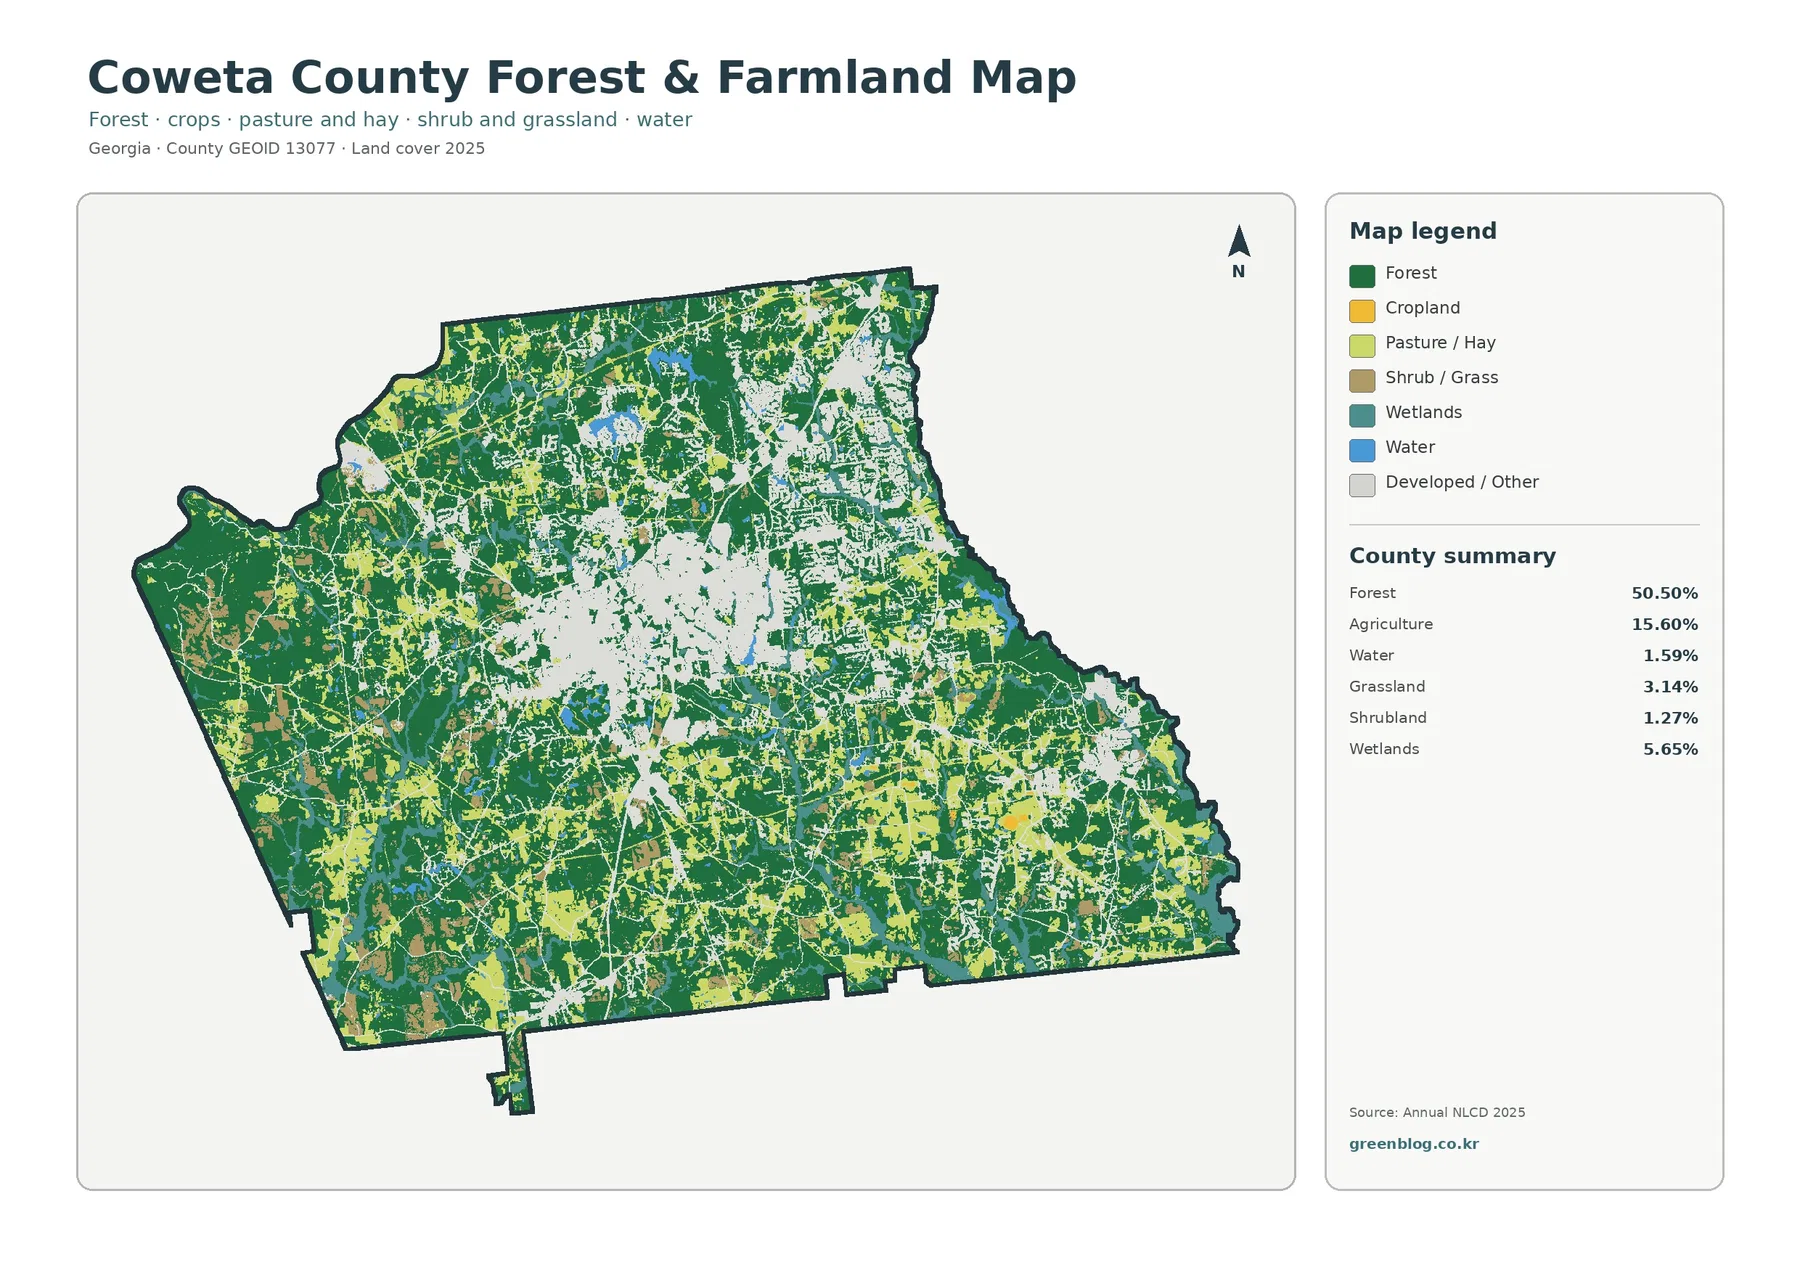
Removing most of the developed-color detail makes the rural pattern easier to see. Forest remains 50.50%, agriculture 15.60%, wetlands 5.65%, grassland 3.14%, shrubland 1.27%, and water 1.59%. The western side contains some of the largest connected forest areas. Agricultural cells appear in many separate blocks instead of one continuous farming district, with particularly visible clusters across the south, southeast, and portions of the northwest.
The light developed-and-other area around Newnan interrupts the forest-and-farm mosaic in the center. Beyond it, farmland repeatedly meets forest edges. This is a useful view for explaining why a county can have a substantial agricultural share without looking like one uninterrupted belt of fields. It also keeps the smaller water and wetland categories visible, which helps prevent open water from being confused with wet ground or vegetation affected by water.
The UGA Extension office in Coweta County provides agriculture and natural-resources education and services for local farmers, landowners, and residents. That local context is useful when reading the map, but the raster itself does not identify crops, farm ownership, pasture management, or parcel boundaries. Annual NLCD assigns a predominant class to each cell. A yellow agricultural cell therefore describes mapped surface cover at that scale, not the legal or operational status of a specific farm.
Hard surfaces concentrate much more tightly than developed cover
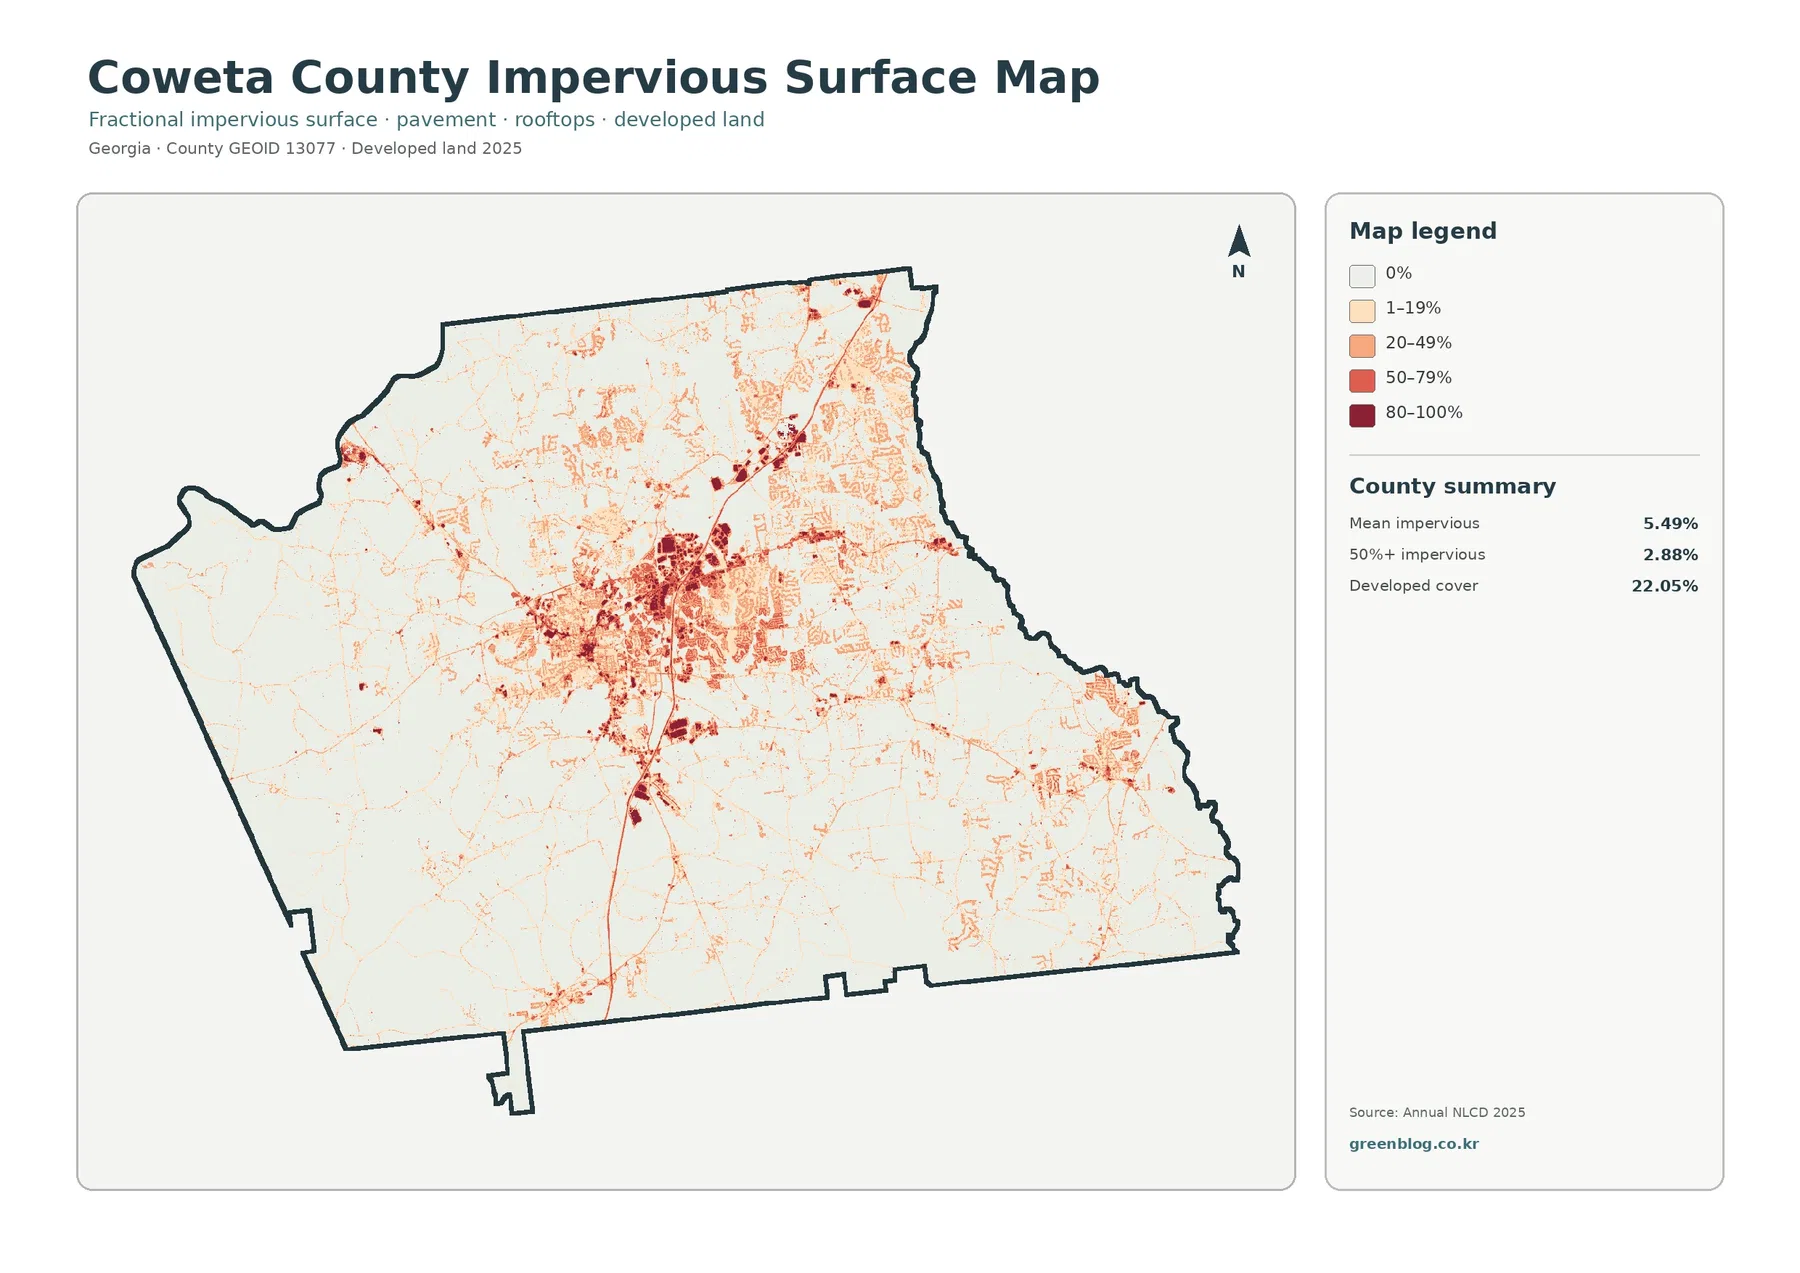
Impervious surface means pavement, rooftops, parking areas, and similar materials that do not readily absorb rainfall. Coweta County’s mean impervious value is 5.49%, while 2.88% of the mapped area is at least 50% impervious. Those numbers are far below the 22.05% developed-cover share because developed classes can contain lawns, trees, bare soil, and other permeable ground in addition to hard surfaces.
The darkest impervious cells form a strong cluster around Newnan. A noticeable line of higher values also runs toward the northeast, and additional built clusters appear toward the southeast and in smaller southern or southwestern locations. The county’s official transportation material shows I-85 and the network that links Newnan with surrounding communities, giving useful geographic context for these concentrations. The map, however, only shows the surface pattern; it does not prove that a particular road caused adjacent development.
This distinction matters in watershed or runoff discussions. A neighborhood may be classified as developed even though much of its surface is still grass or tree cover, while a commercial center can contain a much higher share of pavement and rooftops. Using the impervious map beside the general land-cover map makes those differences visible without assuming that all red developed areas have the same amount of hard surface.
The 1985–2025 comparison is led by cells classified as developed
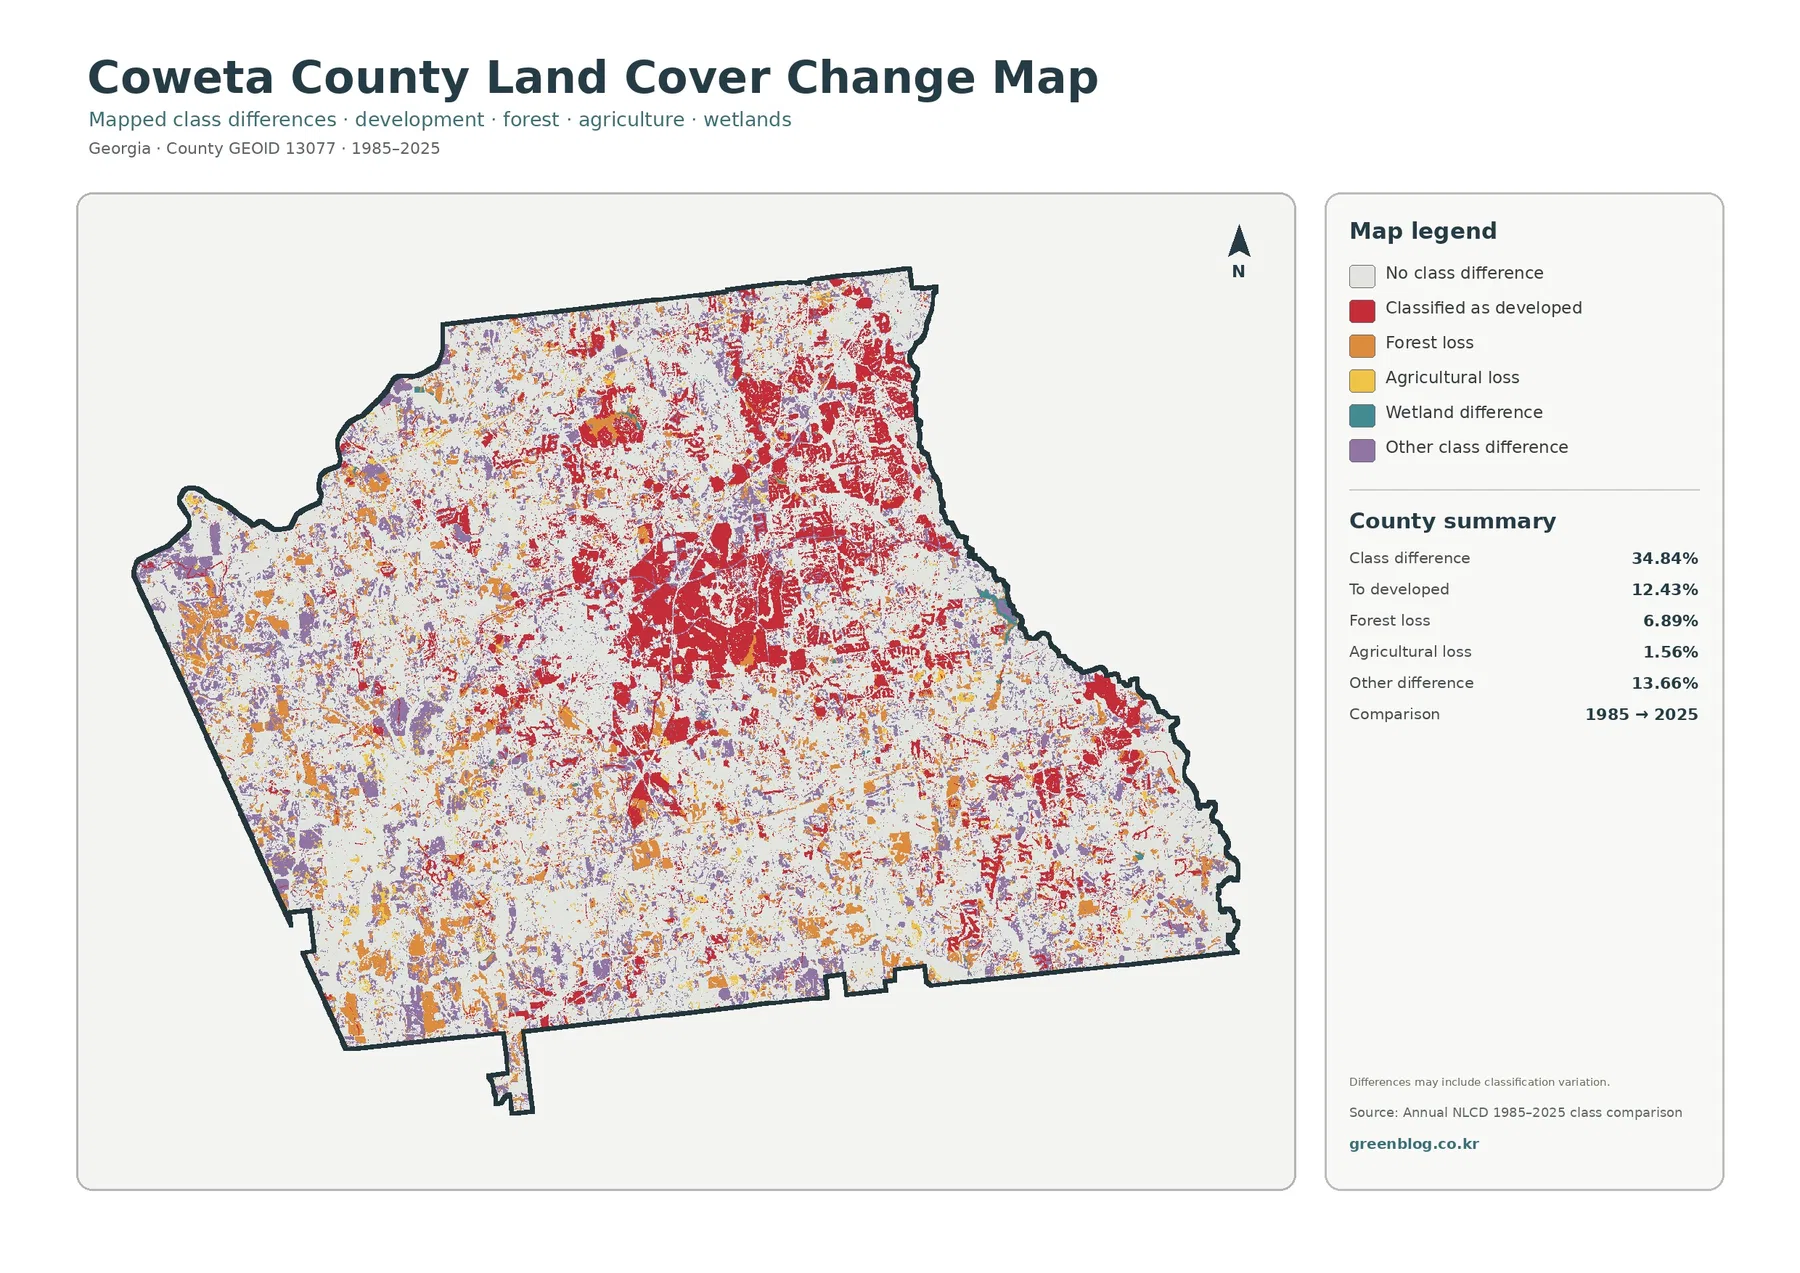
Across the county, 34.84% of cells have a different mapped class at the two endpoints. The summary assigns 12.43% to cells classified as developed in 2025 after another 1985 class, 6.89% to forest loss, 1.56% to agricultural loss, and 13.66% to other class differences. Red development-change cells are especially common around the central developed area and across much of the northeast, with additional groups to the east and southeast.
The western half contains more orange forest-loss and purple other-difference cells in several areas, while large portions of the county remain light because their endpoint class did not change. This is not a year-by-year history. A red cell tells the reader that its 1985 and 2025 endpoint classes differ in a particular way; it does not provide the construction date, project name, or reason for the change.
Classification variation also matters. Differences in imagery, mixed pixels, vegetation conditions, and classification can contribute to an endpoint difference, so the full 34.84% should not be described as confirmed development or land disturbance. Historical aerial photographs, intermediate land-cover years, permits, and local records are needed when the timing or cause of a specific change is important.
Coweta County’s current planning and transportation pages connect growth, land use, infrastructure, and long-range investment. Those documents are useful alongside the change map because they describe policy and future planning, while the map describes classified surface conditions. Keeping those roles separate prevents a common mistake: a future land-use designation is not the same thing as a 2025 land-cover class.
Choosing the map that fits the question
For a quick county profile, the 2025 land-cover map gives the best overall balance of forest, development, agriculture, wetlands, and water. The forest-and-farmland view is more useful when the purpose is to compare rural cover without the visual weight of detailed developed classes. Impervious surface is the better choice for discussions of pavement and rooftops, while the endpoint-change map is designed for a broad 1985–2025 comparison.
Each image uses generalized raster data rather than parcel mapping. Annual NLCD works at a 30-meter cell scale, so a single cell can contain a road, trees, lawn, a building, and bare ground even though only one predominant class is assigned. Zooming the JPG cannot recover property lines, zoning boundaries, wetland jurisdiction, building permits, or ownership that were never part of the source dataset.
The observation year is another limitation. The current cover images represent the supplied 2025 dataset, and construction, clearing, regrowth, storms, or land-management changes after that observation may not appear. For a current parcel or development decision, use recent local GIS, imagery, and official records rather than relying on this countywide reference map alone.
All four original JPGs measure 2480 × 1754 pixels. They work well for on-screen reference, reports, slide decks, and many ordinary print layouts, but the package does not state that they meet an A3 high-resolution standard. Test a large-format print before committing to a poster-sized output, especially if the legend text needs to remain easy to read.
What is included in the JPG download
The ZIP contains one JPG for 2025 land cover, one forest-and-farmland map, one impervious-surface and developed-land map, and one 1985–2025 land-cover change map. A practical sequence is to begin with the full land-cover view, then add the specialized image that answers the question: rural cover, hard surfaces, or endpoint differences.
Frequently Asked Questions
Why is developed cover 22.05% when mean impervious cover is only 5.49%?
Developed land can include lawns, trees, soil, and other permeable surfaces around roads and buildings. Impervious mapping isolates the share occupied by rooftops, pavement, parking areas, and similar hard materials, so its countywide mean is much lower.
Does the large developed patch around Newnan show the exact city boundary?
No. The land-cover map classifies surface cover and does not draw municipal limits. The Newnan-area developed concentration is clear, but official Coweta County boundary or transportation mapping is needed to identify the exact city limit, road, or parcel.
Does the 34.84% class difference mean that one-third of Coweta County was physically disturbed?
No. That figure combines all cells whose 1985 and 2025 endpoint classes differ, including developed conversion, forest loss, agricultural loss, other differences, and possible classification variation. It should be treated as a screening measure for further investigation rather than a confirmed disturbance total.
Sources and Reference Data
- MRLC Annual NLCD Data – official access point for the annual land-cover and comparison data used for countywide interpretation
- USGS Annual NLCD Land Cover Classification – official guidance for forest, agriculture, developed land, wetlands, water, and related classes
- U.S. Census Bureau TIGER/Line Shapefiles – official county-boundary reference for Coweta County
- Coweta County Comprehensive Transportation Plan – official transportation context for Newnan, I-85, and the county network
- UGA Extension – Coweta County Agriculture & Natural Resources – local agriculture and natural-resource education and services
- Coweta County 2024 Annual Comprehensive Financial Report – official geographic profile identifying Newnan and I-85 in the county
Map File Information
The ZIP contains four original Coweta County JPG maps for comparing forest, agriculture, Newnan-area development, impervious surfaces, and 1985–2025 class differences.
- Included Files: 4 original JPG land cover map files shown in this article
- File Type: JPG files in a ZIP archive
- Intended Use: Printing, education, presentations, and map-based projects
Related Maps
- Appling County Georgia Land Cover Map
- Atkinson County Georgia Land Cover Map
- Bacon County Georgia Land Cover Map
Green Map creates custom-edited map images using open geographic data sources such as geoBoundaries, Natural Earth, OpenStreetMap, and government open data.
These maps are edited visual materials, not raw data files, and are provided for education, documents, presentations, and graphic reference.