Chautauqua County combines two very different lake settings with a largely forested and agricultural interior. Chautauqua Lake leads toward Jamestown in the southeast, while the Lake Erie shore in the northwest includes the separate Dunkirk-Fredonia developed area. Between those centers, forest and farmland form a broad rural patchwork, giving the county several distinct land-cover zones rather than one dominant visual pattern.
This page compares four Chautauqua County themes: general land cover, forest and farmland, impervious surface and developed land, and mapped differences from 1985 to 2025. WebP previews are available in the article, and the four original JPG maps can be downloaded together in one ZIP file. The set is especially useful for comparing the two lake corridors, the two urban centers, and the forest-farm landscape between them.
Table of Contents
Three contrasts define the county before any legend is read
First, the Lake Erie side and the inland lake district are not the same landscape. Agricultural cover is conspicuous across portions of the northwest, while Chautauqua Lake sits inside a more mixed setting of woods, farms, settlements, and wetlands. Second, Jamestown and Dunkirk-Fredonia form separate developed nodes rather than one continuous urban corridor. Third, extensive woodland fills much of the space between and around them.
These contrasts provide practical reference points. Find Chautauqua Lake near the south-central part of the county, then locate the dense developed area at its southeastern end. From there, follow the maps northwest toward the Lake Erie shore. The intervening colors shift repeatedly between forest and agriculture, which makes the county’s rural structure easier to understand than simply calling it “mostly forested.”
The countywide view shows where the 50.27% forest share actually sits
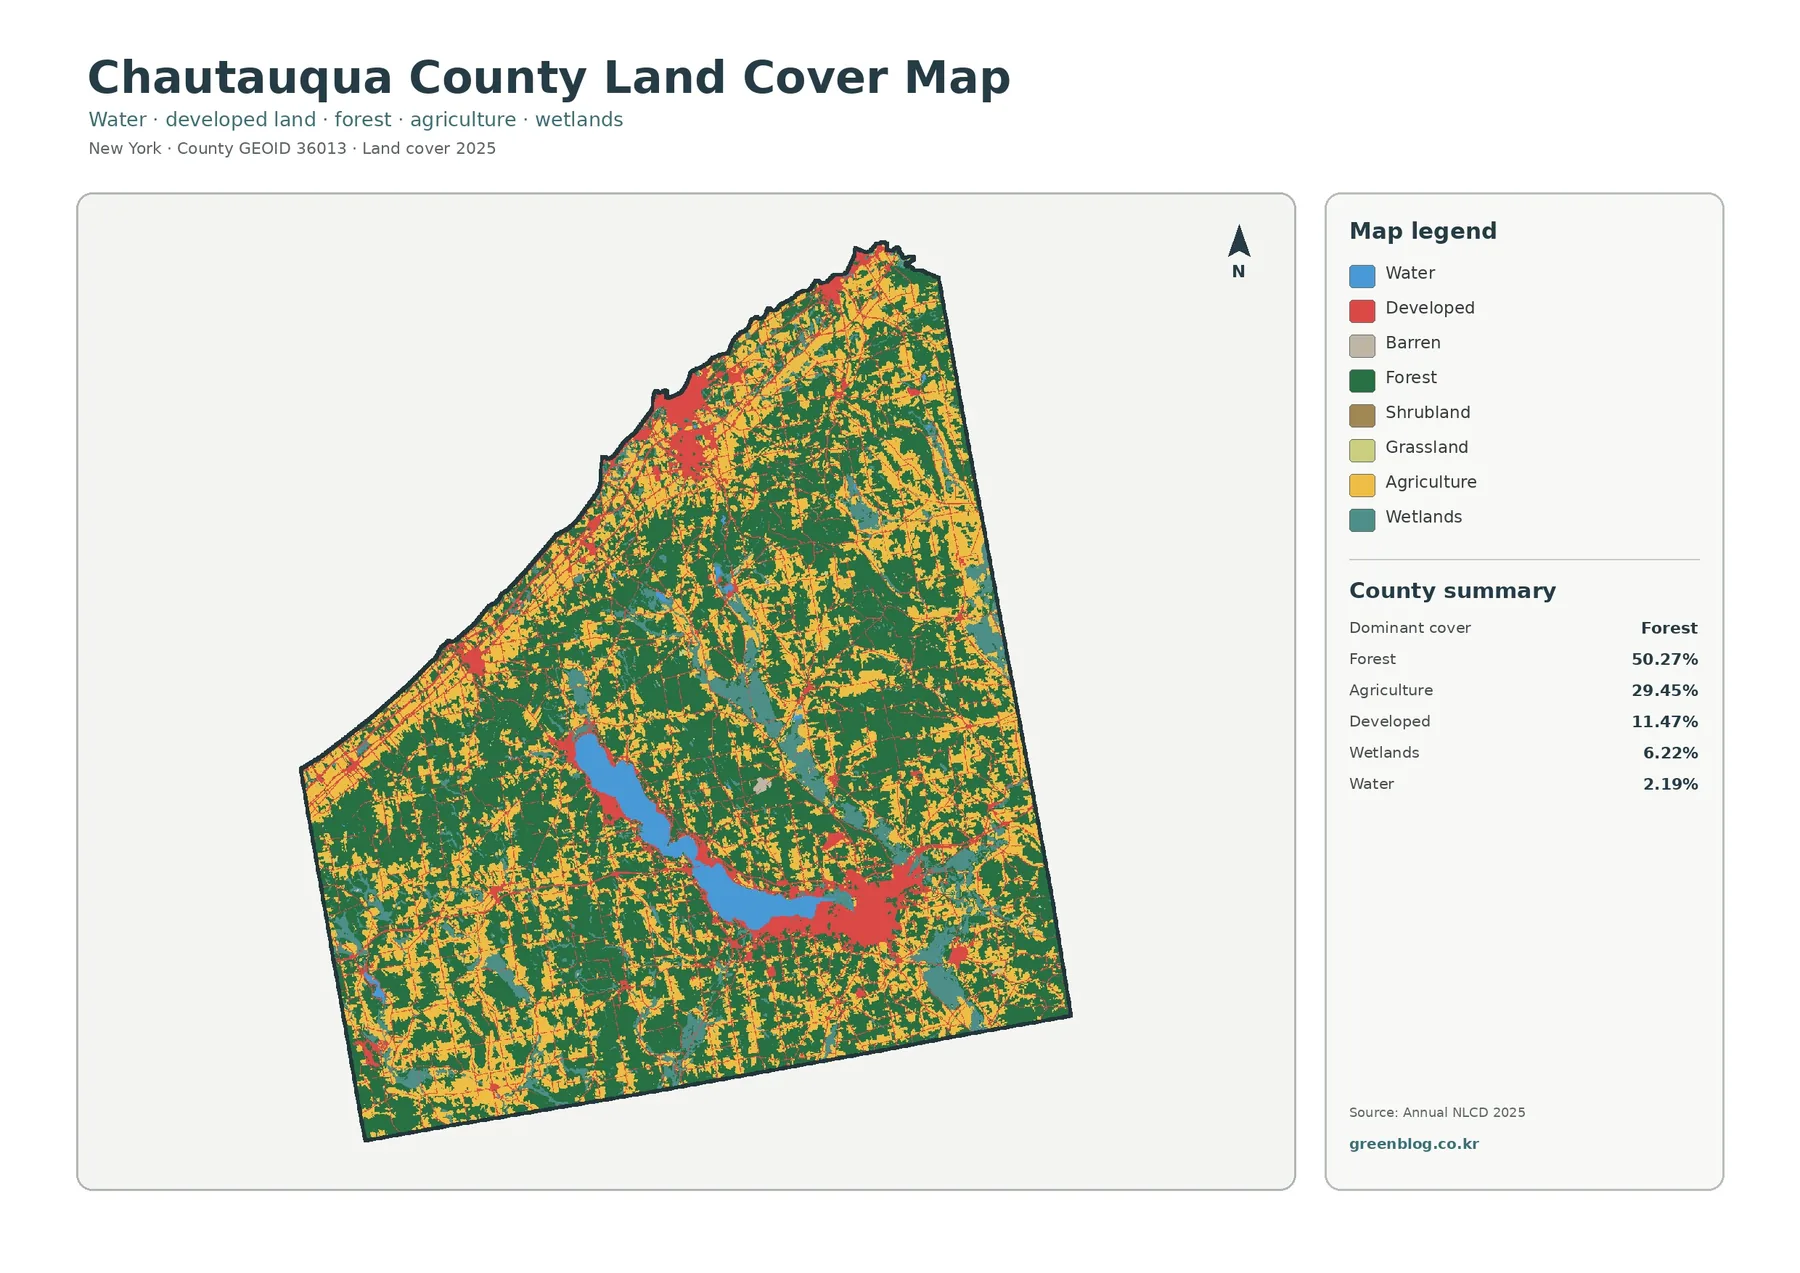
Forest is widespread, but its shape matters. Large dark-green areas occupy much of the interior, south, and east, while agricultural colors break them into blocks, strips, and openings. The northwest has a stronger agricultural presence, and cultivated areas also appear elsewhere where flatter land interrupts the wooded pattern. This arrangement produces a patchwork rather than a single unbroken forest mass.
Developed cover, 11.47% in the summary, is concentrated most clearly around Jamestown and the Dunkirk-Fredonia area. Smaller settlements and transportation routes account for many of the thinner red traces elsewhere. Seeing that geography prevents a common misreading of percentages: the developed share does not mean that roughly one ninth of the county forms one connected city.
Wetlands and water occupy smaller shares, 6.22% and 2.19% respectively, but they interrupt the rural pattern in important places. Chautauqua Lake is the dominant inland water feature. Wetland patches appear around lower ground and drainage corridors. For watershed discussion, those locations are often more useful than the countywide percentages because they show where farms, forest, settlement, and water meet.
Farm openings tell a different story on the simplified rural map
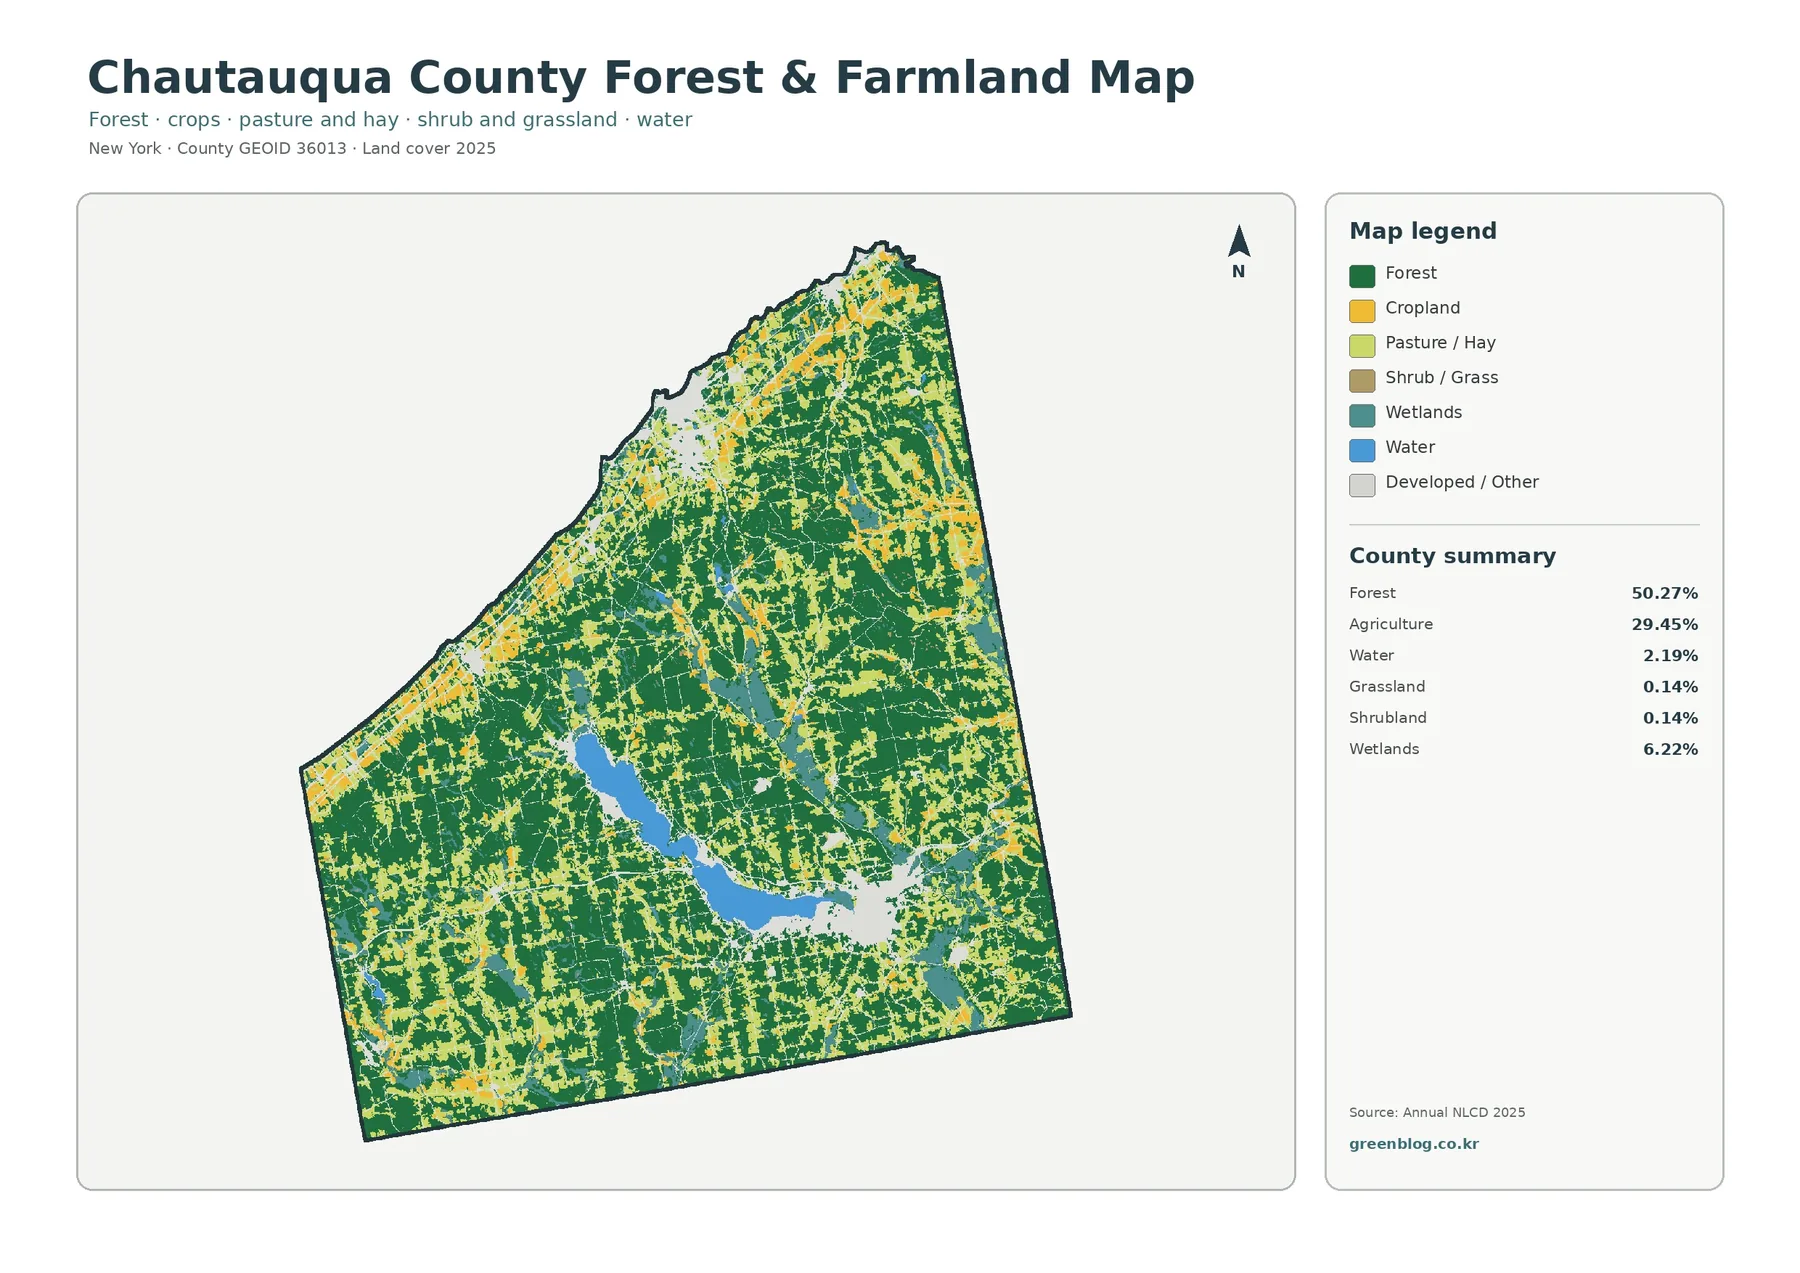
With developed classes subdued, the agricultural pattern becomes easier to follow. Cropland and pasture or hay create broad openings in parts of the northwest and many narrower breaks elsewhere. Forest remains the dominant background, yet the map makes clear that the working landscape is distributed through much of the county rather than restricted to one farming district.
The inland lakeshore is particularly useful for testing generalizations. Its shore does not have one uniform cover type. Some stretches meet wooded land, some are closer to farms, and developed areas become much more prominent toward Jamestown. A county profile that describes the entire lakeshore as developed or entirely forested would miss that local variation.
The agricultural colors represent dominant surface classes within raster cells. They do not mark property lines, ownership, legal agricultural districts, or the exact boundary of an individual field. A parcel-level question therefore belongs with county tax, planning, or agricultural records rather than this regional land-cover layer.
Hard surfaces reveal two urban centers and a web of roads
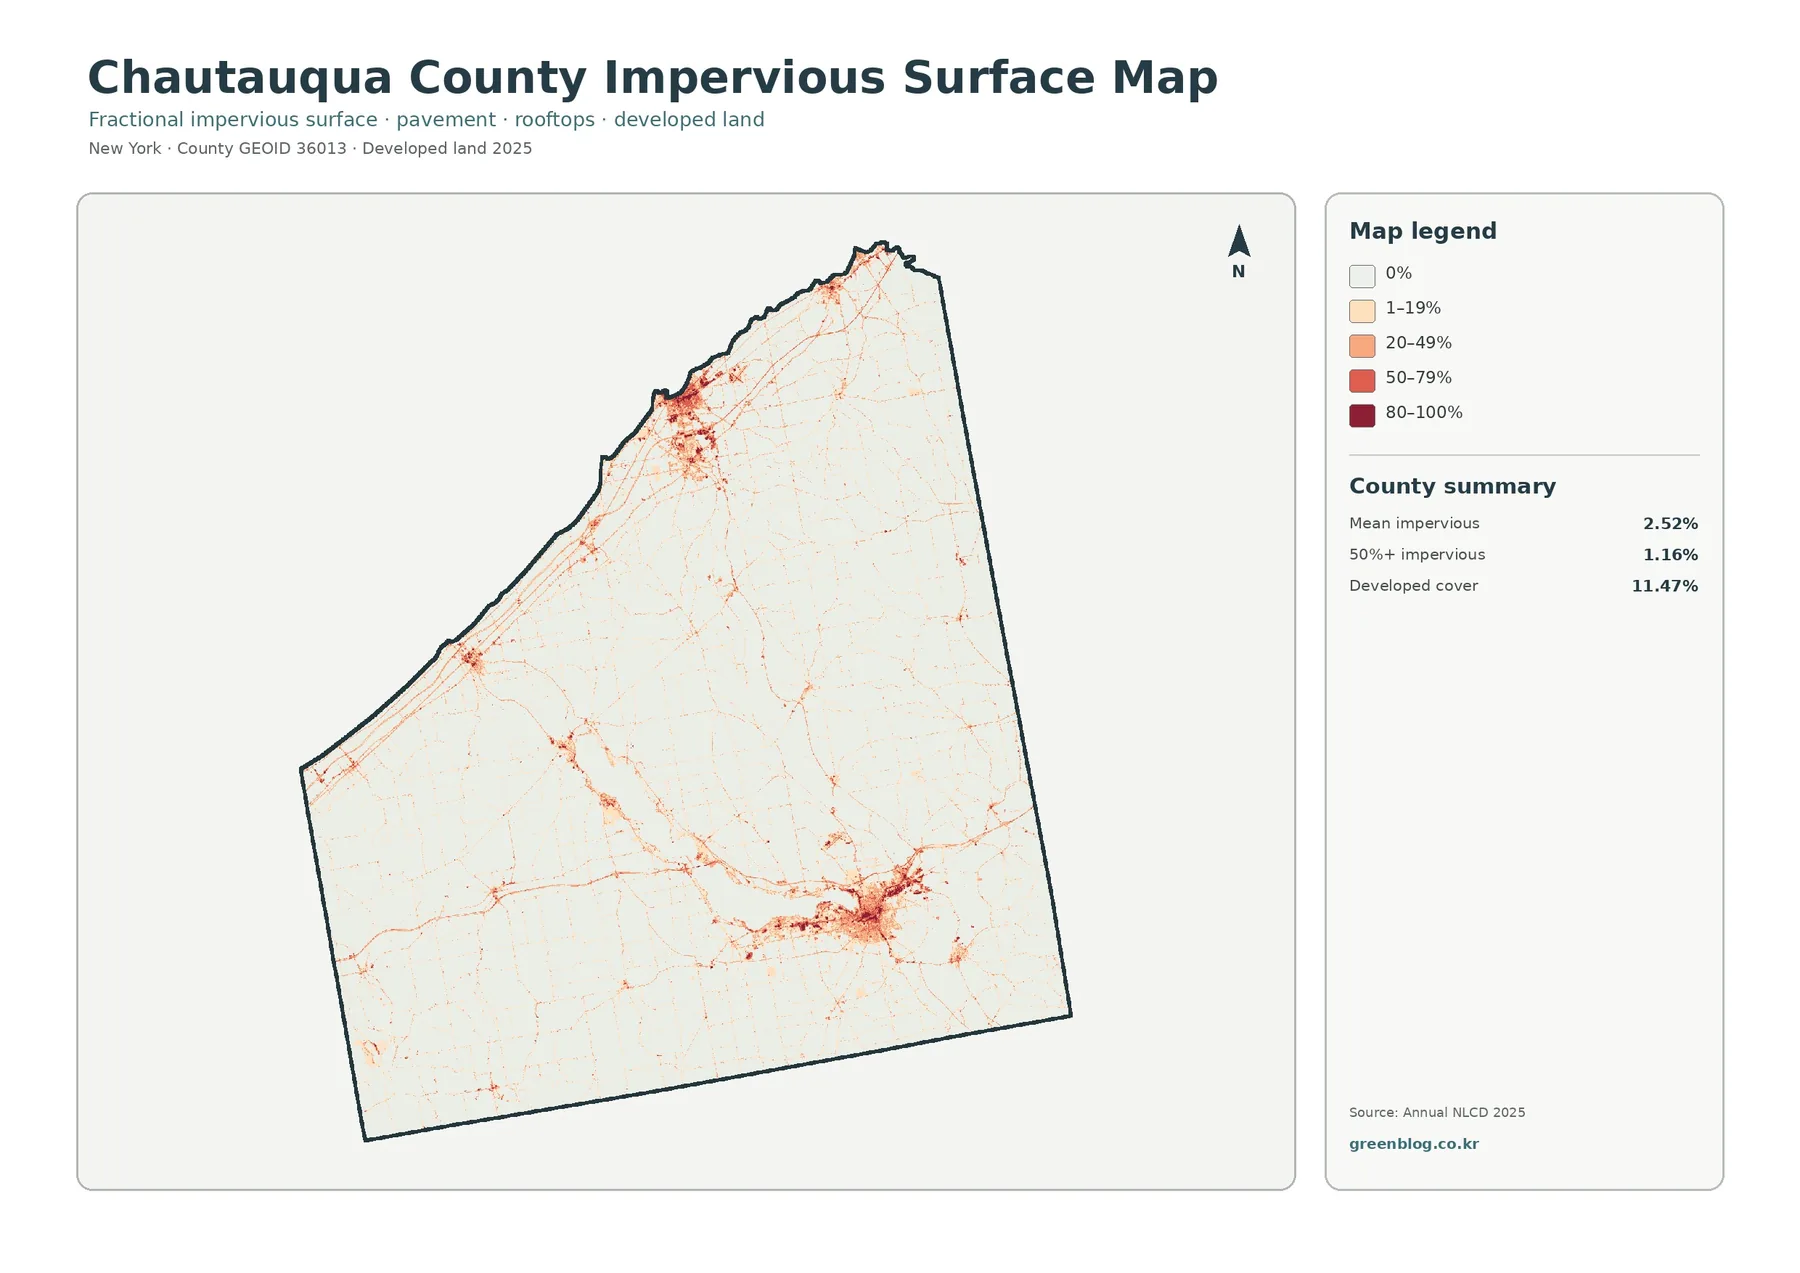
Most of the impervious map is pale. Against that background, Jamestown becomes a dense cluster near the southeastern end of Chautauqua Lake, while Dunkirk-Fredonia forms a second concentration near Lake Erie. Between them, roads show up as fine reddish lines and smaller communities appear as compact spots. The result resembles a network of hard surfaces laid over a largely rural county.
The summary reports mean impervious cover of 2.52%, with 1.16% of the county at 50% impervious or greater. Those numbers are not expected to match the 11.47% developed land-cover share. A developed cell may include lawns, street trees, yards, and other permeable ground, whereas impervious percentage isolates the fraction occupied by hard materials such as pavement and rooftops.
This layer can support a discussion of runoff context, but it is not a flood model. Water movement also depends on slope, soil, drainage infrastructure, rainfall, and proximity to streams or lakes. The useful takeaway is spatial: the hardest surfaces are highly concentrated, while most of the county remains lightly impervious.
The 1985–2025 layer is a map of differences, not a verdict on change
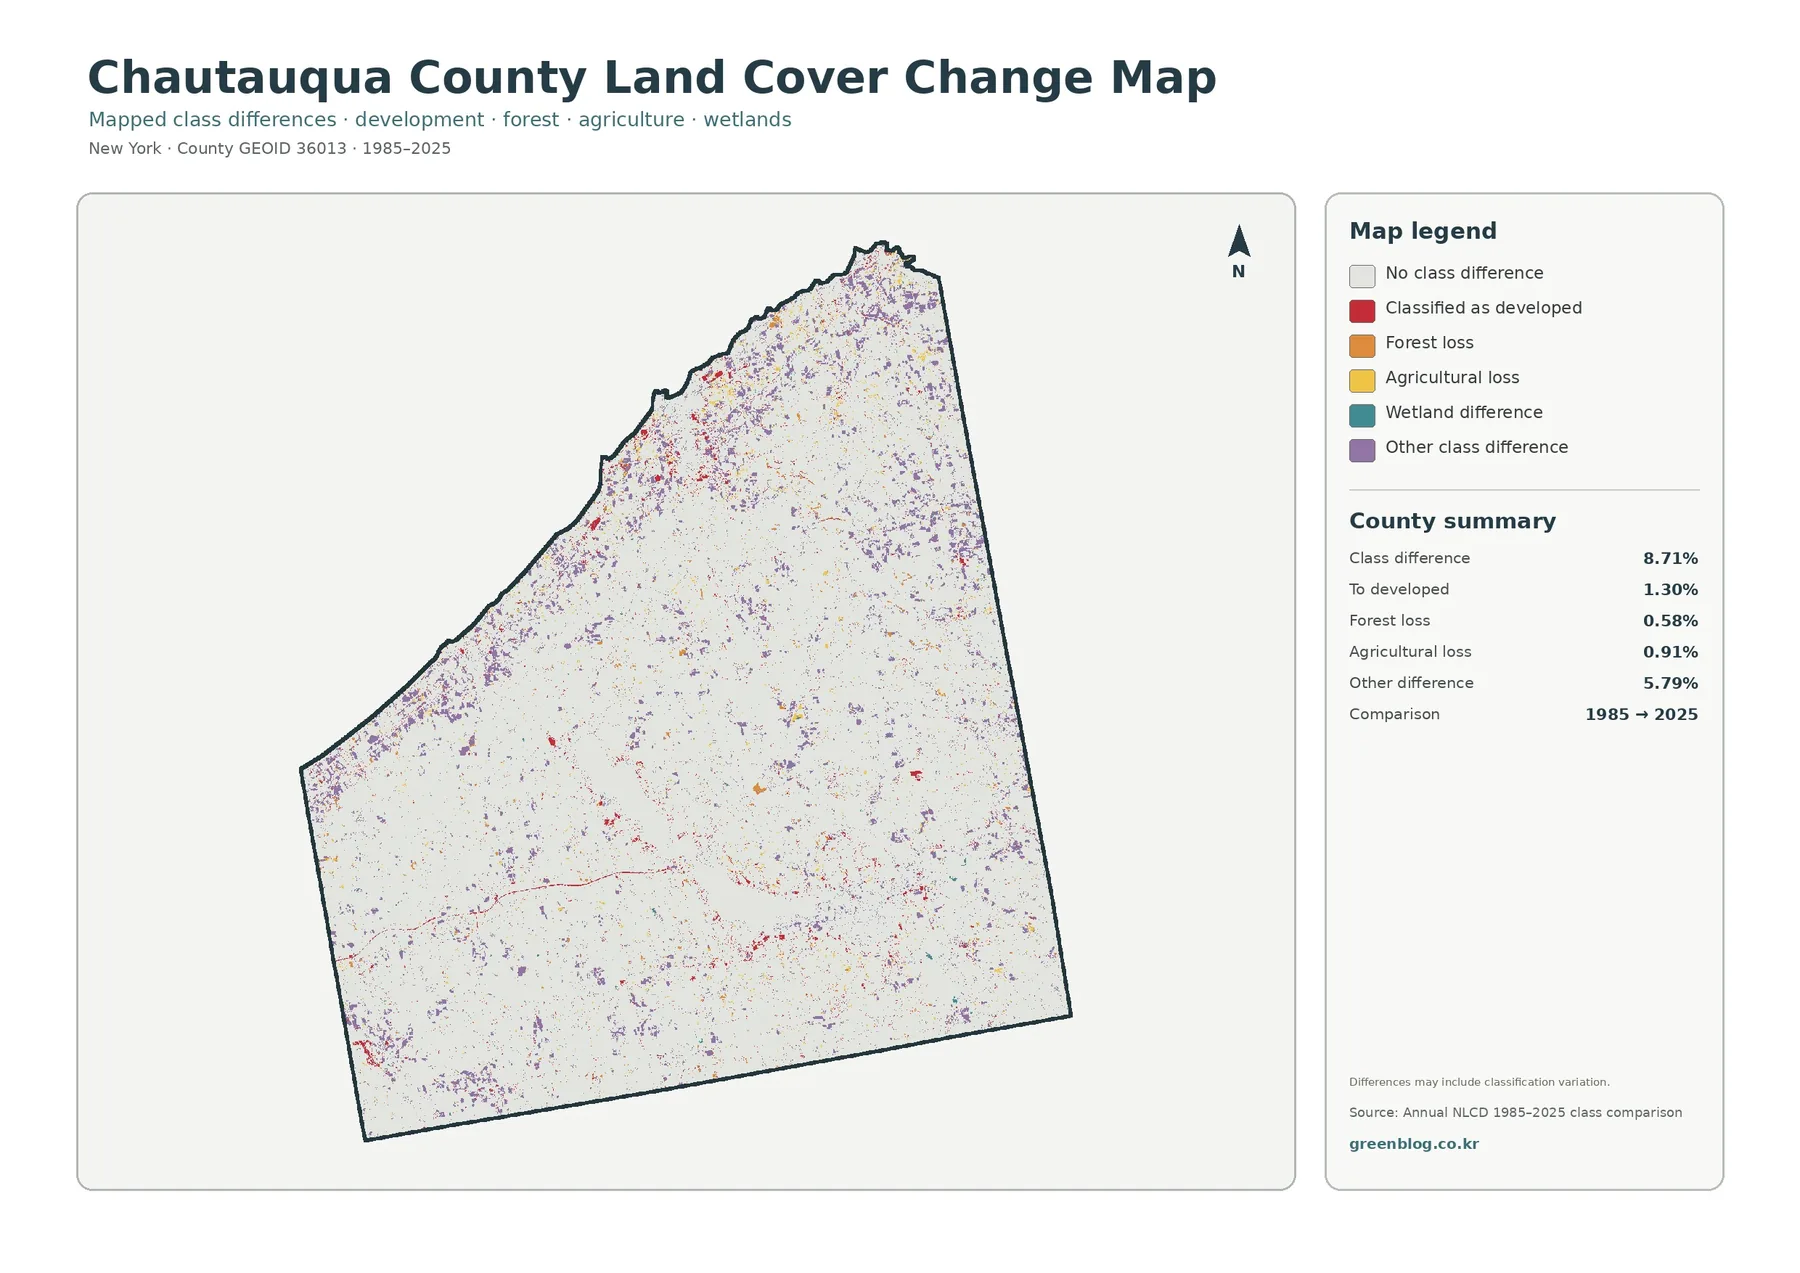
Gray dominates the comparison because most cells retain the same representative class at the two endpoints. The supplied figures put total class difference at 8.71%. Within that total, 1.30% is classified as developed, 0.58% as forest loss, 0.91% as agricultural loss, and 5.79% as other class difference.
Development-related differences are easier to spot near established urban areas and some transportation corridors. Other colors appear as scattered patches rather than a single sweeping front. That distribution makes the layer useful for choosing locations to investigate: a user can identify a cluster and then compare historical aerial imagery or other records for that particular place.
A different class label in 1985 and 2025 may reflect real landscape change, but long-period comparisons can also be affected by sensors, seasons, mixed pixels, or classification procedures. The map should therefore guide follow-up research rather than serve as the final evidence for a parcel-level conversion.
Chautauqua Lake works as a natural cross-section of the county
Following the lake from northwest to southeast passes through several of the county’s key land-cover relationships. Wooded shore segments alternate with settled areas and nearby farmland. The urban footprint becomes much stronger as the lake approaches Jamestown. Wetland and drainage features add another texture around lower ground. That progression makes the lake useful in a classroom or presentation because several map classes can be discussed without jumping to unrelated parts of the county.
Lake Erie provides a contrasting shore environment. Near Dunkirk, hard surfaces and development reach the shoreline, while farmland lies close by inland. A comparison between the two lake settings can therefore illustrate how the same county combines an inland-lake landscape with a Great Lakes edge.
Good uses for this four-map set
- County orientation: Use Chautauqua Lake, Jamestown, Dunkirk-Fredonia, and the Lake Erie edge as recognizable anchors.
- Rural landscape study: Compare broad farm openings in the northwest with more forested sections of the interior, south, and east.
- Built-surface analysis: Show why developed land and highly impervious land produce different percentages and different visual patterns.
- Watershed context: Examine where forest, agriculture, wetlands, settlement, and open water come together around Chautauqua Lake.
- Historical screening: Use clusters on the class-difference map to choose places for a second look in historical imagery.
Scale matters when a 30-meter cell contains several surfaces
Annual NLCD is a regional raster product. A 30-meter cell can contain trees, a driveway, lawn, part of a building, and a field at the same time. The land-cover layer assigns a representative class, while the impervious product estimates the hard-surface fraction. Neither should be expected to trace fences, lot lines, or every road edge precisely.
Legal land use is a separate question. A forest-classified cell does not establish public ownership or protected status, and an agricultural cell does not establish a legal farm district. Zoning, permitting, ownership, and site engineering require the authoritative county or state records created for those decisions.
Download the four original Chautauqua County map files
The download archive contains four original JPGs: the 2025 countywide land-cover map, the forest-and-farmland map, the impervious-surface map, and the 1985–2025 class-difference map. The WebP images in the article are previews; the ZIP retains the original JPG files supplied by the map workflow for printing, teaching, presentations, and comparison.
Frequently Asked Questions
Why does Jamestown stand out more on the impervious map than on the rural-cover map?
The impervious layer emphasizes pavement, rooftops, and other hard surfaces, so dense built areas become visually prominent. The rural-cover map suppresses much of that urban detail in order to make forest and agricultural patterns easier to compare.
Can the 50.27% forest figure be used as a count of protected forest acreage?
No. It is the share of mapped cells assigned to forest cover in the supplied 2025 summary. Ownership, conservation status, timber management, and legal boundaries require other records.
What does a purple cell mean on the 1985–2025 comparison?
Purple represents an “other class difference” between the two endpoints. It is not a stand-alone claim that a specific real-world conversion occurred. Historical imagery or another independent source is appropriate for checking the location. Map File Information Chautauqua County Land Cover Map Package
Map File Information
Download the map files associated with this page for reference, printing, and compatible visual projects.
- Included Files: Use only the versions confirmed in the article and supplied images
- File Type: Use the confirmed download contents
- Intended Use: Printing, education, presentations, and map-based projects
Related Maps
- Allegany County New York Land Cover Map
- Bronx County New York Land Cover Map
- Broome County New York Land Cover Map
Sources and references
- MRLC Annual NLCD Data — the official access point for the national land-cover products used to place the county in a consistent mapping framework.
- USGS Annual NLCD Land Cover Classification — useful for checking what the mapped forest, agriculture, developed, wetland, and related classes represent.
- Chautauqua County Government — a starting point for county planning, land, and administrative information beyond the regional raster maps.
- New York State DEC: Chautauqua Lake South — a separate official source for water-quality assessment when questions move beyond surrounding land cover.
Green Map creates custom-edited map images using open geographic data sources such as geoBoundaries, Natural Earth, OpenStreetMap, and government open data.
These maps are edited visual materials, not raw data files, and are provided for education, documents, presentations, and graphic reference.