Forest dominates Gilpin County in the 2025 land-cover summary, covering 76.59% of this small mountain county. The map is not uniformly dark green, however: western areas contain more shrubland and open high-country cover, while development branches through the southeast around Black Hawk and Central City.
The four maps on this page separate current land cover, forest and open cover, impervious surfaces, and class differences between 1985 and 2025. Original JPG versions of all four are available together in one ZIP near the end of the article for printing, closer inspection, classroom use, and presentations.
Table of Contents
A heavily forested county with two very different edges
The countywide totals are led by forest at 76.59%, followed by shrubland at 14.48%. Developed cover is 4.38%, wetlands 1.73%, grassland 1.63%, and water 0.20%. Agriculture is 0.00% in the supplied summary, so Gilpin County is not a farmland-focused landscape.
Large forest blocks fill the north, center, and east. Moving toward the western edge, the dark forest breaks more often into shrubland, grassland, and pale open surfaces. That change in color makes the west look much more open even though forest remains the largest class countywide.
Southeastern Gilpin County has the strongest developed pattern. Red pixels split into narrow branches and several compact clusters around the general Black Hawk–Central City area. The supplied NLCD maps do not draw municipal boundaries, but verified local sources make those two mountain cities useful reference points for understanding where development is concentrated.
Farther north, Rollinsville provides a different settlement example. Gilpin County’s official history page places it about 13 miles north of Black Hawk. Developed traces continue through the northern forest, but they are smaller and less concentrated than the southeastern cluster.
Land cover describes the surface detected in raster cells; it is not a zoning or ownership map. A developed pixel does not identify a residential, commercial, or gaming district, and a forest pixel does not tell who owns or manages the land. Parcel-level decisions require another source.
The 2025 map shows where deep forest gives way to western openings
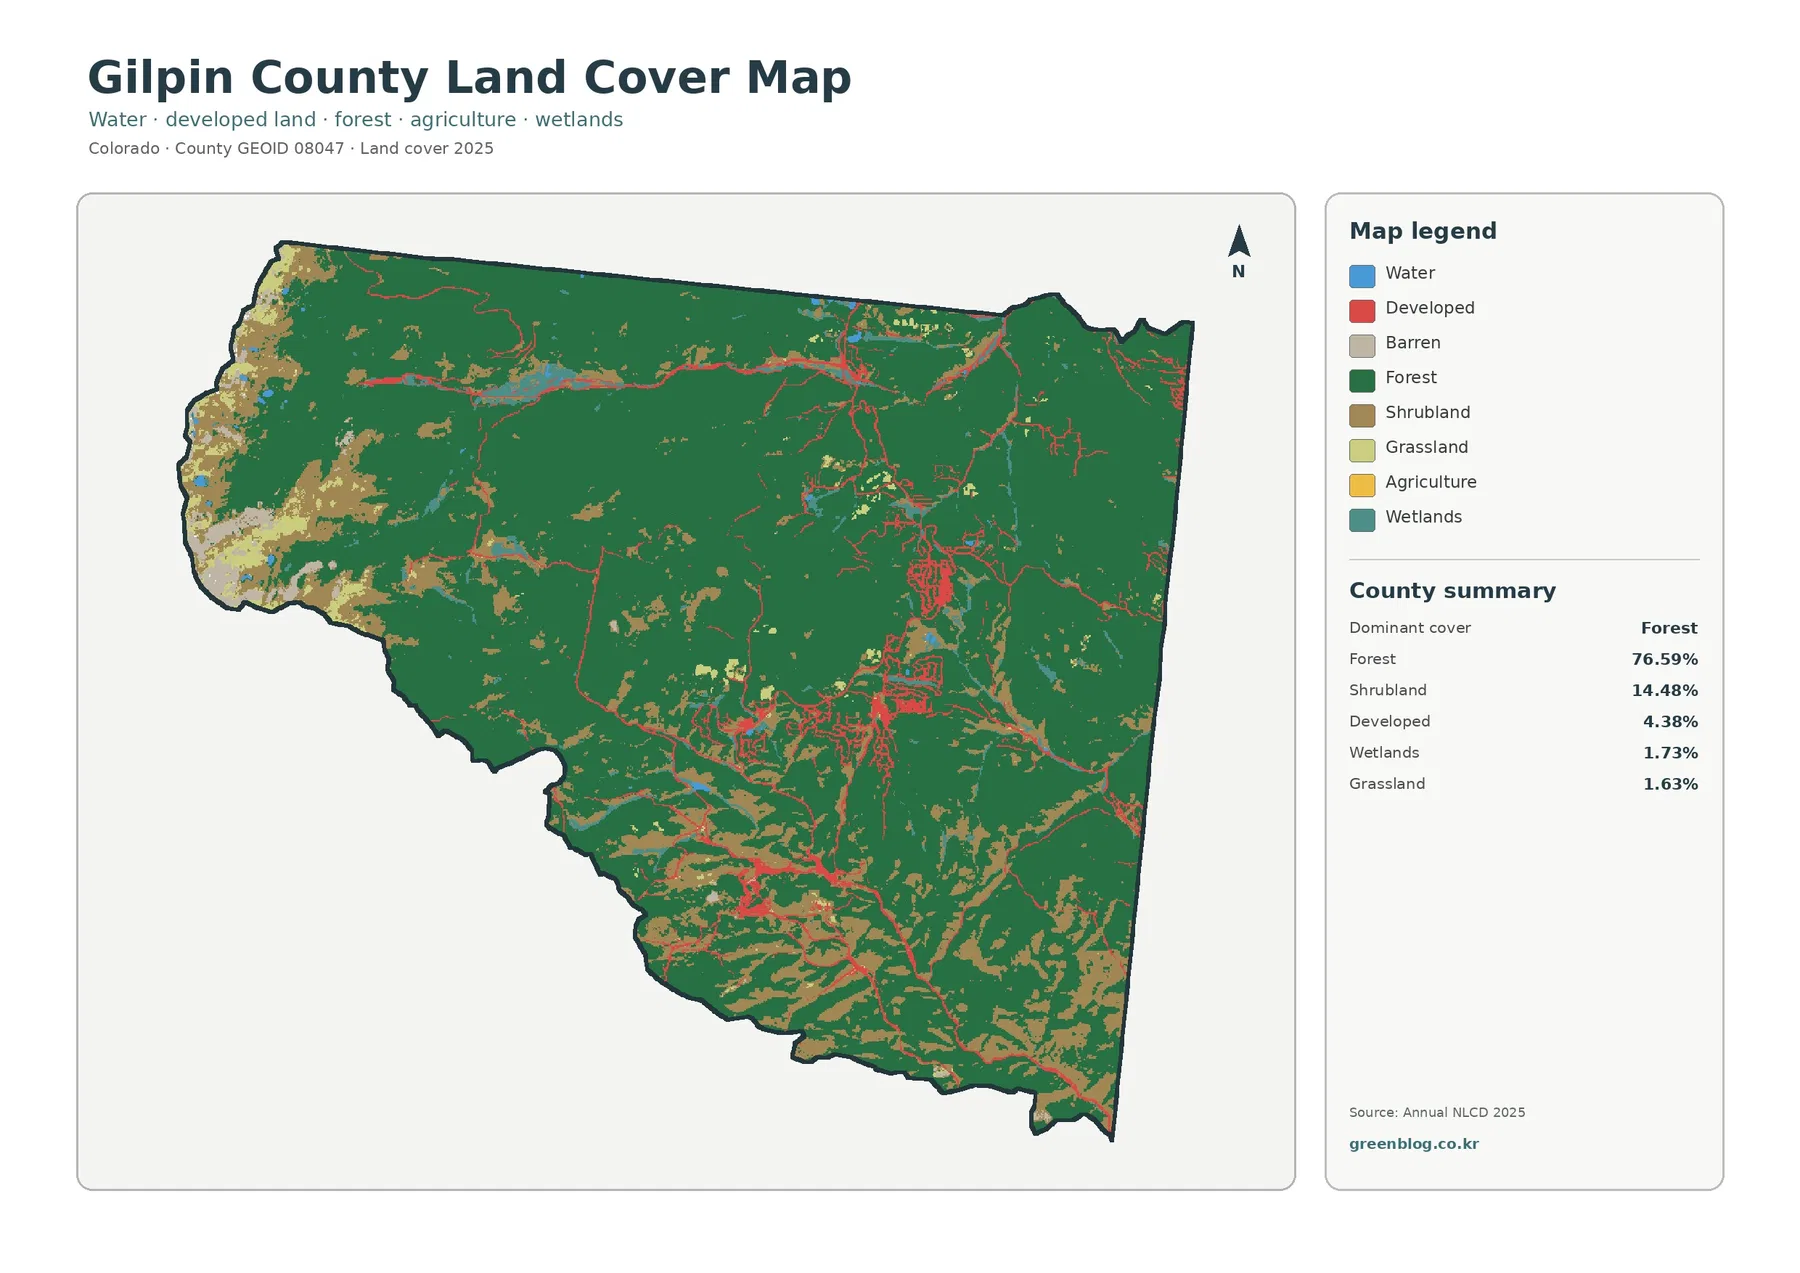
Dark green forest forms the basic background across most of the county. The central and eastern portions contain some of the broadest connected forest, while the west contains more tan and pale openings. The boundary between those classes is irregular, which fits a mountain landscape better than a simple straight east–west division.
Development appears most clearly in the southeast. Thin red lines connect small built patches, and several areas expand into larger red clusters. The pattern is compact and branching rather than the broad rectangular footprint seen in many plains cities.
Western openings create a second major visual feature. Shrubland, grassland, and barren-looking classes interrupt the forest and make high-country terrain look lighter. Those categories should be checked against the legend rather than treated as one single type of open land.
Wetlands account for 1.73% and appear as narrow blue-green traces and small patches. Water is only 0.20%, so small ponds or other water features may be difficult to see at web-preview scale. The original JPG is more useful when those minor classes need close inspection.
The simplified map is more useful for forest versus open cover than for farming
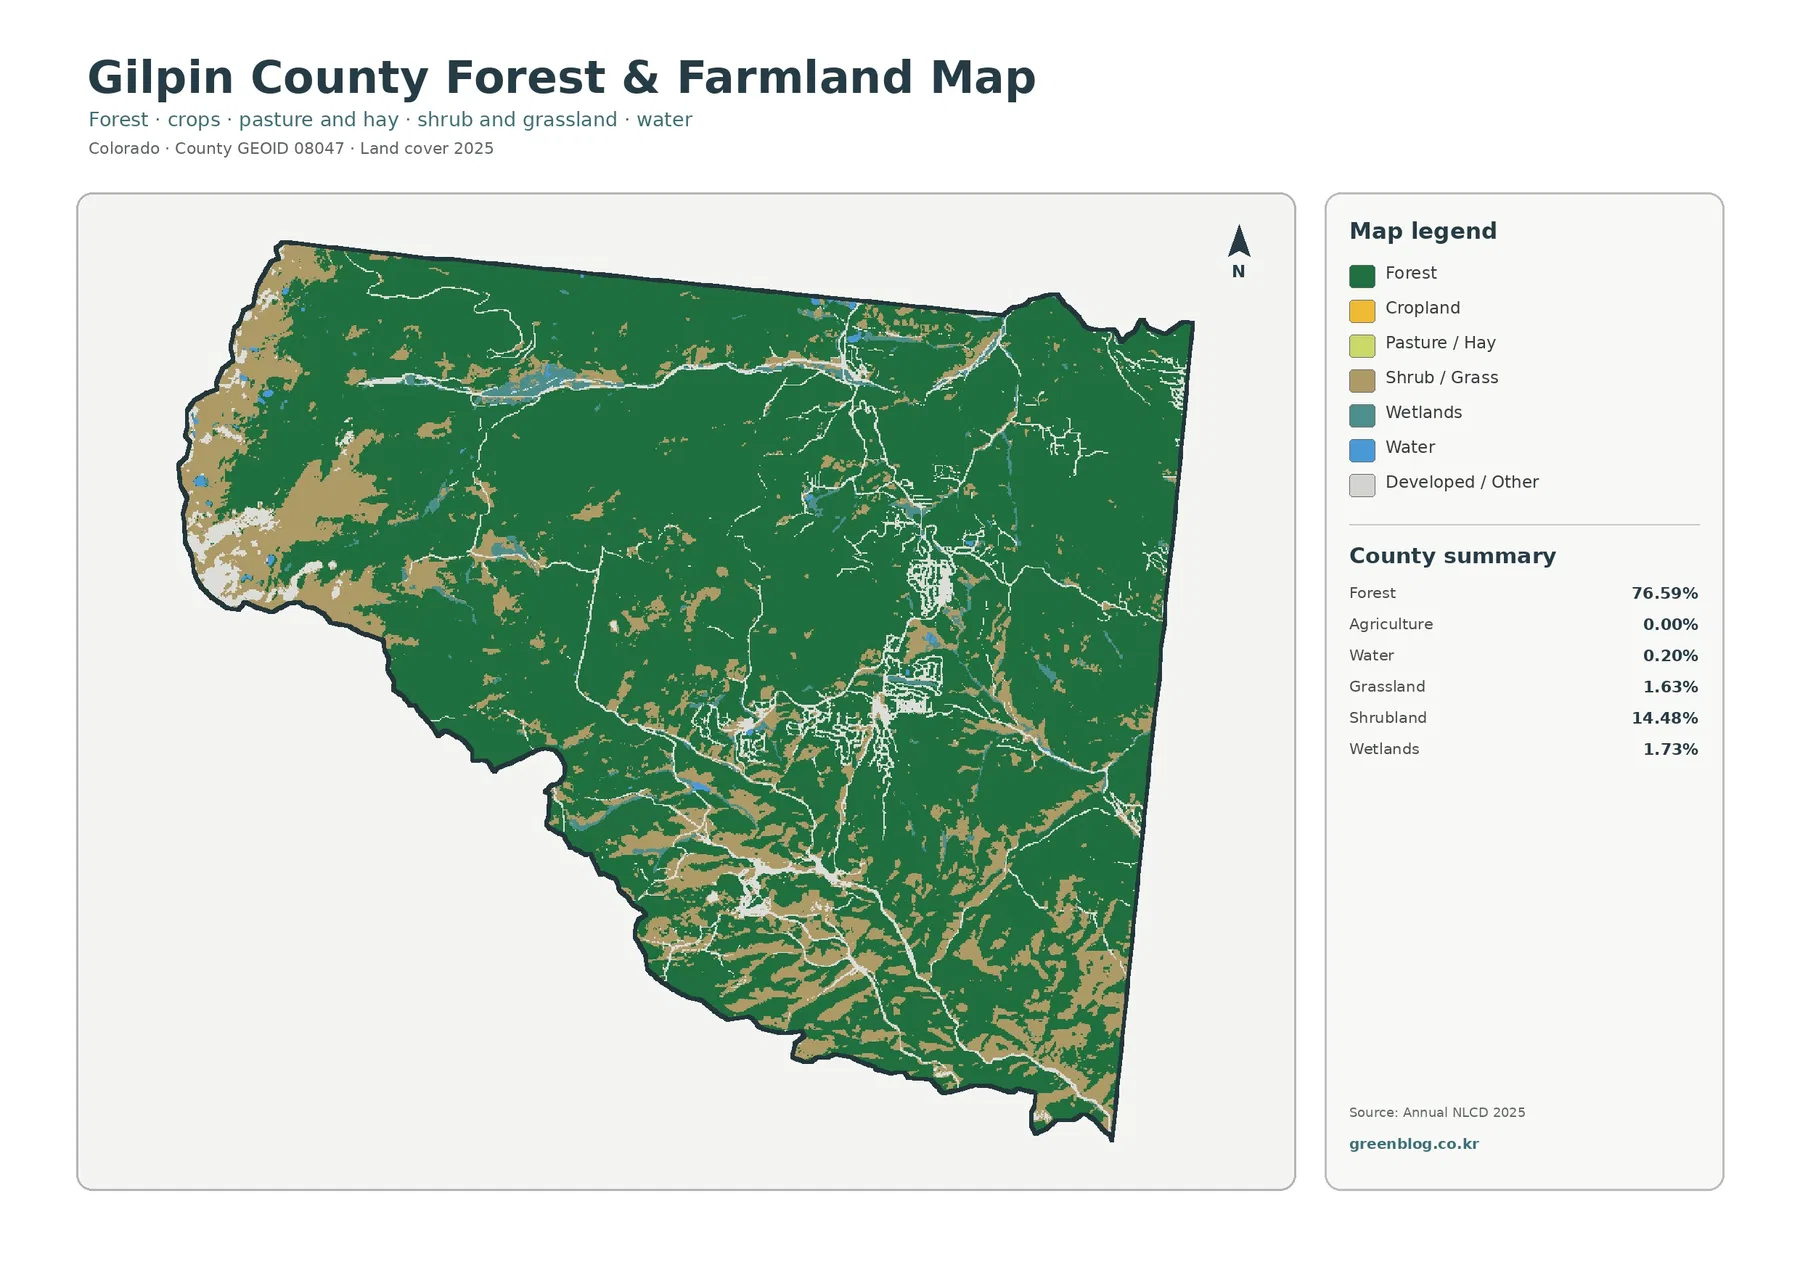
Because agriculture is 0.00% in the supplied summary, the value of this map is not locating cropland. Its main strength is separating the 76.59% forest share from shrub-and-grass openings. With fewer colors, the western high-country openings stand out more clearly against the broad forest.
The Black Hawk–Central City area remains visible as pale developed-or-other cover cutting through the forest. Local information for Maryland Mountain–Quartz Valley Open Space Park describes mountain trails and open space around Black Hawk and Central City. That park boundary is not an NLCD class, but it provides useful local context for a landscape where settlement and forest sit very close together.
A 0.00% agricultural share does not prove that no garden, grazing activity, or other small agricultural use exists anywhere in Gilpin County. It means the supplied 2025 land-cover summary does not show a meaningful agricultural surface category. Ownership and actual land use need separate local data.
For a presentation, this simplified map works well beside the full land-cover map. The first image provides detailed classes; the second makes the forest-to-open-cover boundary easier to explain without adding extra legend categories.
A 0.93% mean impervious surface reveals a very small hard-surface footprint
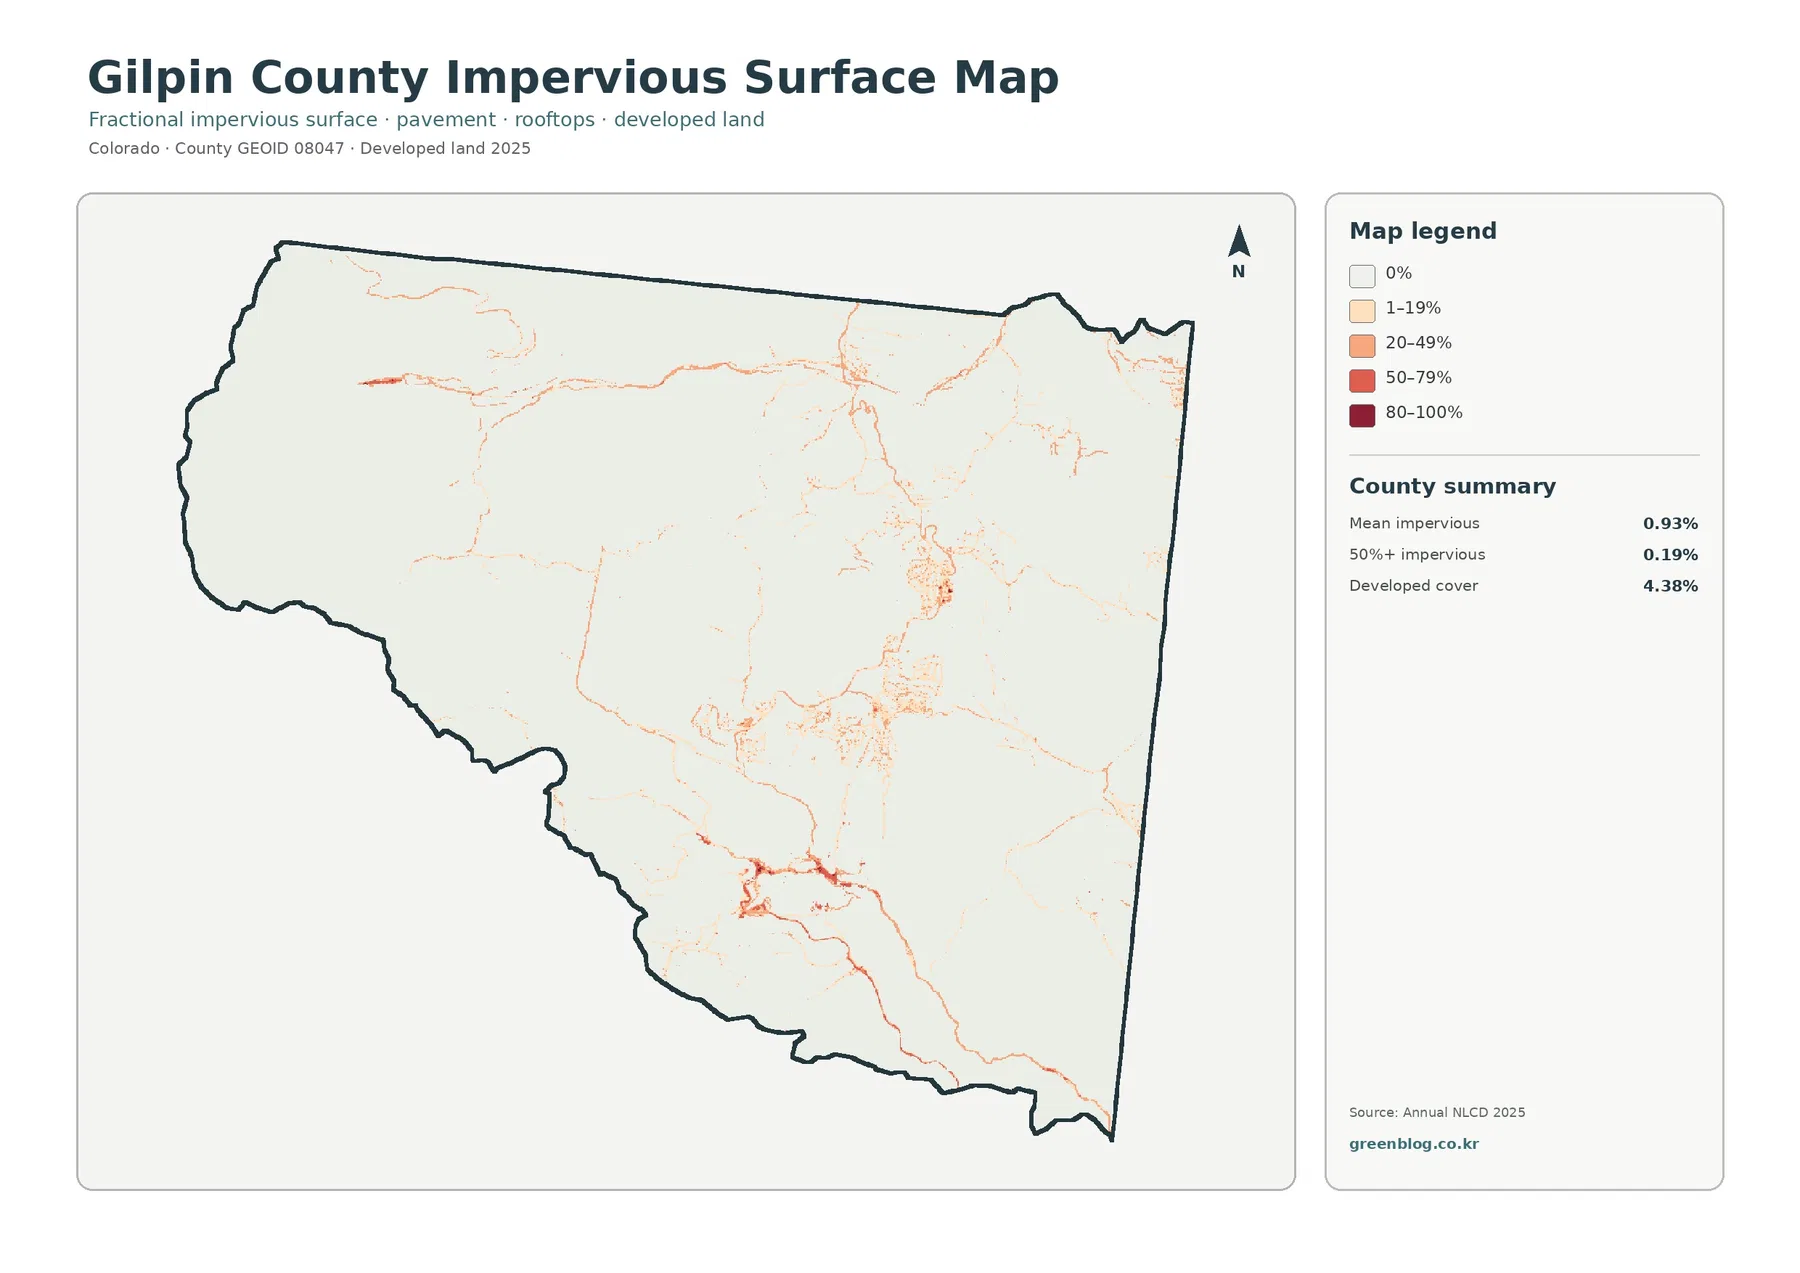
Impervious surface means pavement, rooftops, parking areas, and other hard materials that keep water from soaking directly into the ground. Mean imperviousness is 0.93%, and cells mapped at 50% or greater imperviousness cover just 0.19% of the county. Most of the mountain landscape therefore remains very light on this map.
The higher values are concentrated around the southeastern settlement area and along narrow road-like traces. Black Hawk and Central City provide the clearest reference for those clusters, while the northern pattern around Rollinsville is smaller and more dispersed.
Developed cover at 4.38% is not the same measurement as mean imperviousness at 0.93%. Land cover assigns a categorical class to each cell, whereas fractional imperviousness estimates how much of that cell is physically covered by hard surface. A mountain neighborhood can include homes and roads while still retaining substantial forest, soil, and grass.
Narrow roads also matter at this scale. A paved route may be only a few raster cells wide, so its appearance changes with zoom level. The impervious map is useful for locating concentration, not for measuring road width or tracing individual building footprints.
The 1985–2025 comparison is led by other class differences rather than development
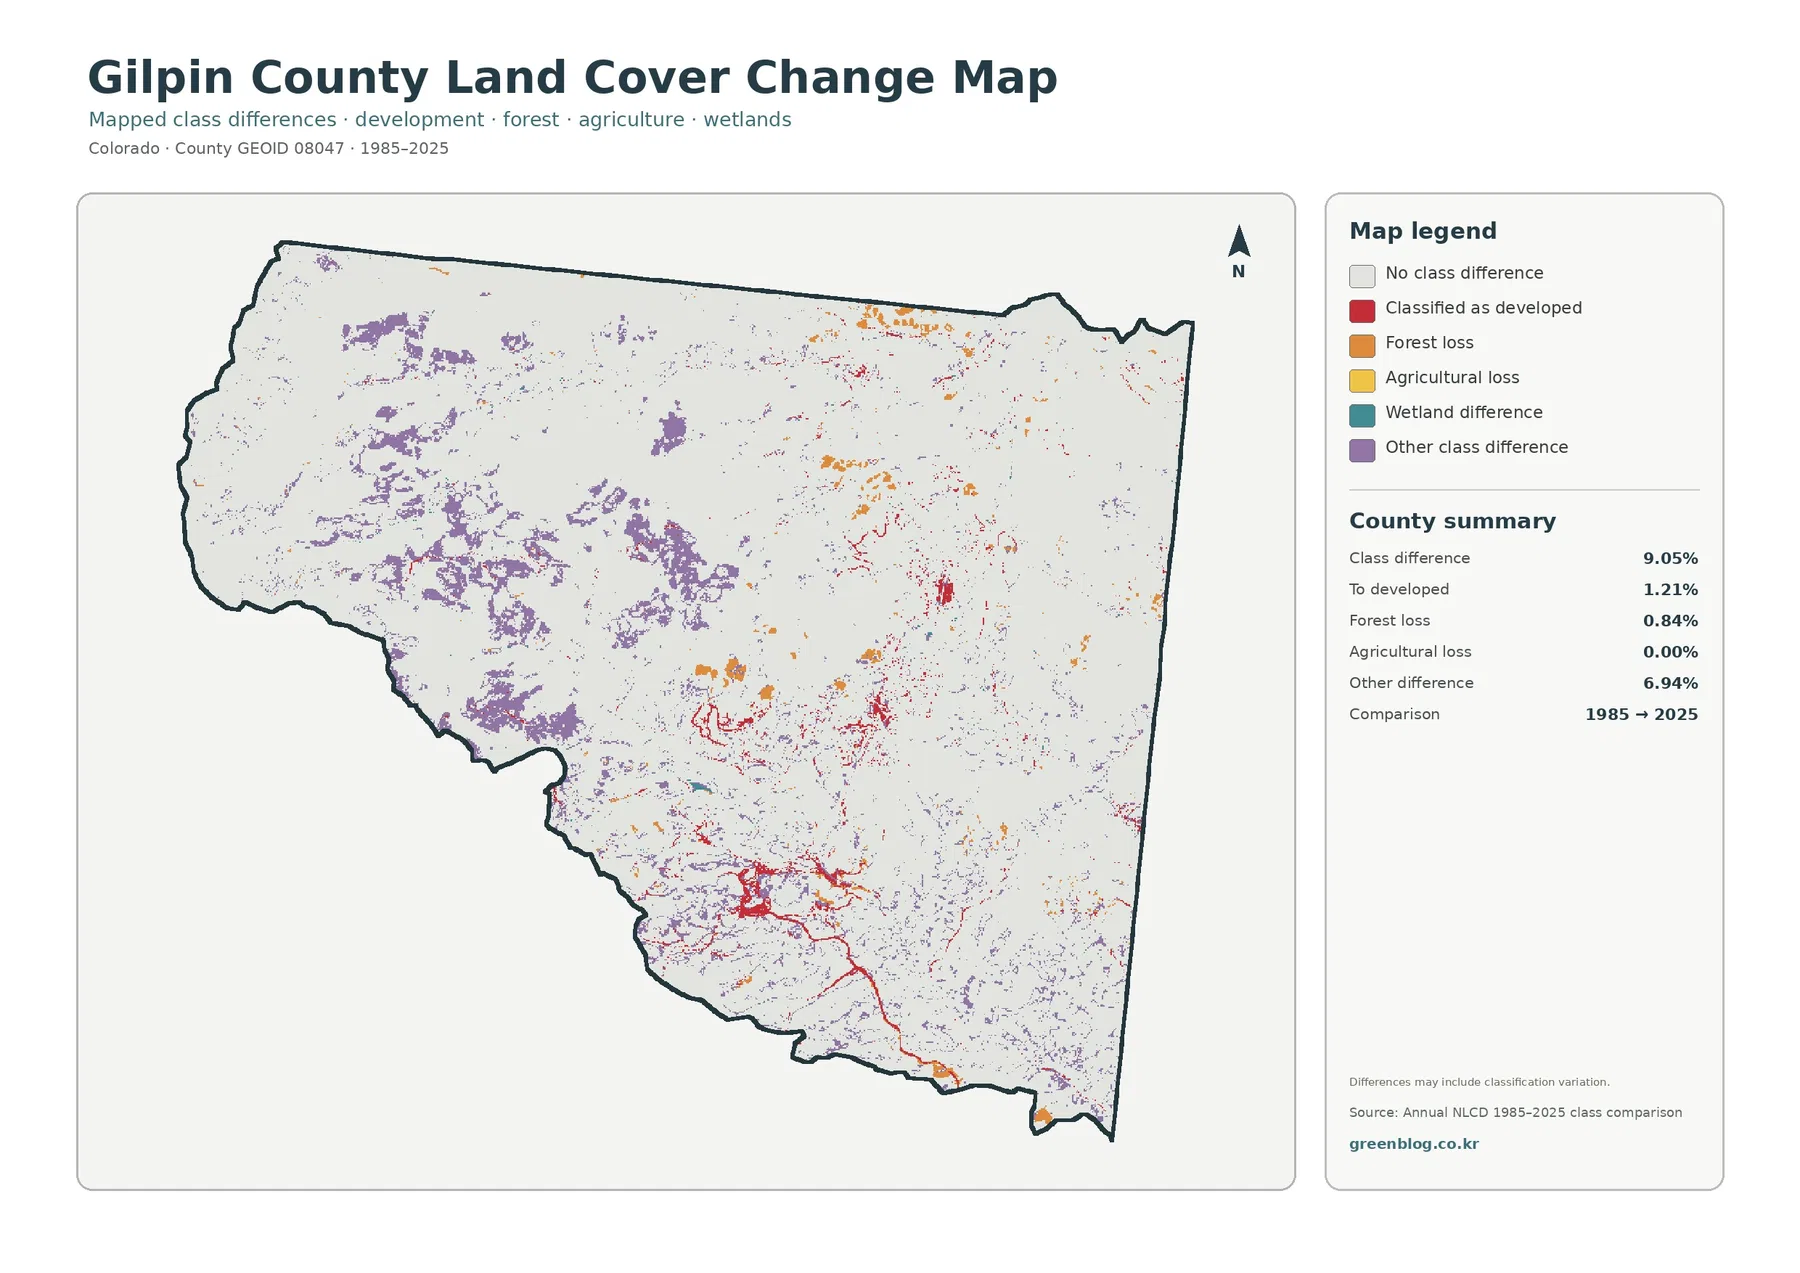
Mapped classes differ across 9.05% of the county between 1985 and 2025. Other class difference is the largest category at 6.94%, followed by conversion to developed at 1.21% and forest loss at 0.84%. Agricultural loss is 0.00%.
Red conversion-to-developed pixels overlap some of the same southeastern territory that has current development, but the change layer does not reproduce the entire 2025 developed footprint. It shows cells that moved into a developed class in the two-date comparison.
Forest loss at 0.84% is small beside the current 76.59% forest share, yet its cause cannot be read from this image. Fire, vegetation disturbance, development, recovery, or classification variability require additional evidence. The map identifies where classes differ, not why they differ.
The 6.94% other-difference category needs the most caution. Small isolated pixels may reflect classification variation as well as physical change. Broad repeated areas are better candidates for follow-up with intermediate-year imagery or local records.
Three reference areas reveal different parts of the county story
Black Hawk and Central City are the best starting points for built-surface comparison. Current land cover shows the broader developed class, imperviousness narrows attention to the hardest surfaces, and the change map identifies some areas classified as conversion to developed since 1985.
Rollinsville offers a quieter northern comparison. Developed traces remain surrounded by extensive forest and lack the larger southeastern cluster. That makes it easier to see how a small mountain settlement can appear developed without producing a large impervious footprint.
The western high country shifts the question away from development. There, the full land-cover and simplified forest maps are more useful because shrubland, grassland, and pale open surfaces interrupt the forest. Comparing the west with the southeast shows why one countywide forest percentage cannot describe every part of Gilpin County.
Treating these three areas separately also reduces repetitive map descriptions. Each location answers a different question: compact settlement in the southeast, dispersed development in the north, and natural-cover transition in the west.
Thirty-meter cells matter in a county with narrow roads and small settlements
Annual NLCD is raster data produced with 30-meter cells. A cell can contain forest, soil, pavement, buildings, grass, or water at the same time, yet the land-cover product assigns a representative class. Fractional imperviousness handles hard surface separately by estimating its share within the cell.
This scale is especially important in Gilpin County because many developed features are narrow. Water is only 0.20% and cells above 50% imperviousness cover 0.19%, so small features can disappear in a reduced preview or look oversized when enlarged. Raster edges should not be treated as surveyed parcel or road boundaries.
The change map has a different limitation: a different class in 1985 and 2025 does not identify a cause. The 0.84% forest-loss category should not automatically be called wildfire or development, and the 6.94% other-difference category is even less suitable for a single-cause explanation.
Current land-cover and impervious maps represent 2025. Construction, vegetation recovery, fire effects, or other changes after that year may not appear. Newer local information is necessary for present-day site decisions.
Which map should you open first?
Use the general land-cover map first for a complete county overview. It shows the broad forest, western openings, southeastern development, and small wetland and water classes in one frame. Readers unfamiliar with Gilpin County can understand the basic pattern quickly from this view.
The forest-and-farmland version is better when the question is forest versus open natural cover. With agriculture effectively absent from the supplied summary, its simplified legend puts the western shrub-and-grass areas in clearer contrast with the forest.
Choose imperviousness for built-surface intensity and the change map for questions involving time. Pairing either one with current land cover prevents categories from being confused, particularly developed cover versus hard surface and current forest versus forest-loss classification.
For teaching or presentations, a Black Hawk–Central City versus western-high-country comparison is particularly effective. It shows compact development, forest, open cover, and hard-surface intensity within a very small mountain county.
Download the four Gilpin County JPG maps
The downloadable ZIP contains four original JPG files: general land cover, forest and farmland, impervious/developed land, and 1985–2025 land-cover change. The WebP images in the article are intended for fast online viewing, while the JPG files can be opened separately for closer inspection and printing.
Keep the title, year, and legend with each image when reusing it. Current development, conversion to developed, and imperviousness are different measurements, just as current forest and forest loss are different statistics.
Frequently Asked Questions
Why does western Gilpin County look more open even though forest covers 76.59% of the county?
Shrubland, grassland, and barren-looking classes are more common along the western side, while forest is especially extensive across the interior, north, and east. A high countywide forest percentage does not mean every part of the county has the same cover.
Why is mean imperviousness only 0.93% when developed cover is 4.38%?
Developed cover is a categorical land-cover class, while imperviousness estimates how much of each cell is covered by hard surfaces such as pavement and rooftops. Developed mountain areas can still contain substantial forest, soil, and other permeable surfaces.
Does the 9.05% 1985–2025 class difference mean that all of that land physically changed?
No. The value represents cells whose mapped classifications differ between the two dates. Real land-cover change can contribute, but classification variation can also be present. A specific cause requires additional imagery or local records.
Map File Information
The download ZIP contains four original Gilpin County land-cover JPG maps.
- Included Files: land cover, forest and farmland, impervious/developed land, and land-cover change
- File Type: ZIP archive containing 4 JPG files
- Intended Use: Printing, education, presentations, and map-based reference
Related Maps
- Adams County Colorado Land Cover Map
- Alamosa County Colorado Land Cover Map
- Arapahoe County Colorado Land Cover Map
Sources and References
- MRLC Annual NLCD Data – official access point for Annual NLCD products and data.
- USGS Annual NLCD Land Cover Classification – official documentation for interpreting Annual NLCD classes and 30-meter raster data.
- 2020 Gilpin County Comprehensive Plan – county planning context for mountain development, growth, and environmental sustainability.
- Gilpin County – Rollinsville – official county history and location context for Rollinsville and Black Hawk.
- Maryland Mountain–Quartz Valley Open Space Park – official local context for the mountain landscape around Black Hawk and Central City.
Green Map creates custom-edited map images using open geographic data sources such as geoBoundaries, Natural Earth, OpenStreetMap, and government open data.
These maps are edited visual materials, not raw data files, and are provided for education, documents, presentations, and graphic reference.