Grand County is a mountain-basin landscape where forest, shrubland, and grassland share the map rather than one class covering everything. Forest accounts for 38.59%, shrubland for 33.58%, and grassland for 16.81%, while large eastern water bodies make the Three Lakes area easy to locate.
This page compares current land cover, forest and farmland, impervious surface, and mapped differences from 1985 to 2025. Four original JPG maps are available together in one ZIP near the end of the article for printing, teaching, presentations, and closer inspection.
Table of Contents
Middle Park explains why forest, shrubland, and open grass areas all matter
Set in Colorado’s north-central Rocky Mountains, Grand County occupies a large part of Middle Park. The county’s official overview identifies Middle Park as a large mountain basin containing the headwaters of the Colorado River. That setting helps explain why the 2025 map contains broad open areas between forested mountain blocks instead of one continuous forest.
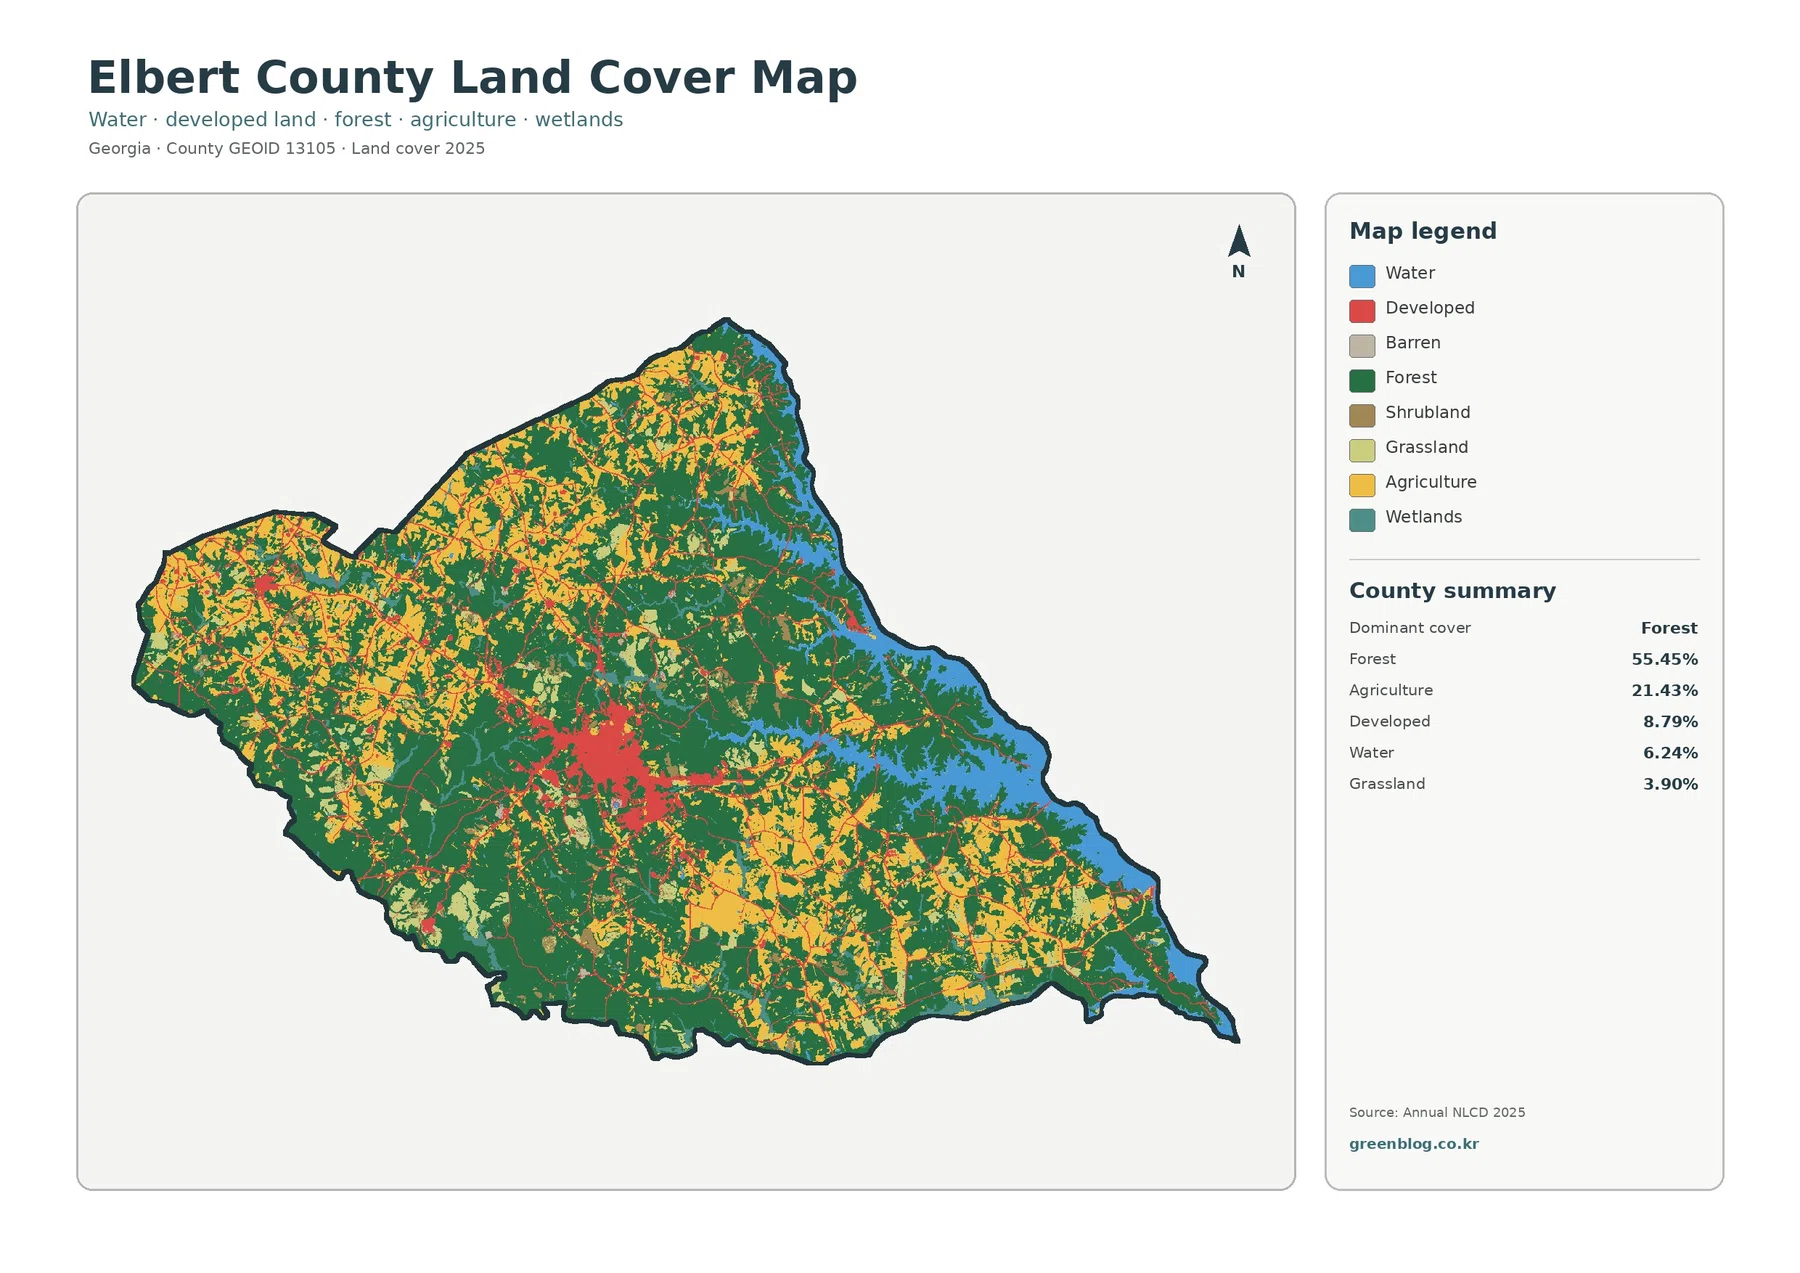
Forest is the largest current class at 38.59%, followed closely by shrubland at 33.58%. Grassland adds another 16.81%. Wetlands account for 4.88%, developed cover for 1.78%, barren cover for 1.96%, agriculture for 1.25%, and water for 1.14%.
The west and southwest contain extensive shrubland mixed with large forest patches. Forest becomes especially broad through northern and eastern mountain areas, while pale grassland occupies much of the open central and northeastern basin. Those regional differences matter more than the countywide percentages alone.
Recent county hazard and natural-resource material describes lower elevations as sagebrush shrubland, conifer forest becoming more common around 9,000 feet and above, and rock or alpine tundra above timberline. The land-cover map does not measure elevation, but that official context helps explain why shrubland, forest, grassland, and barren cover form distinct belts across the county.
The Three Lakes area gives eastern Grand County a strong water signature
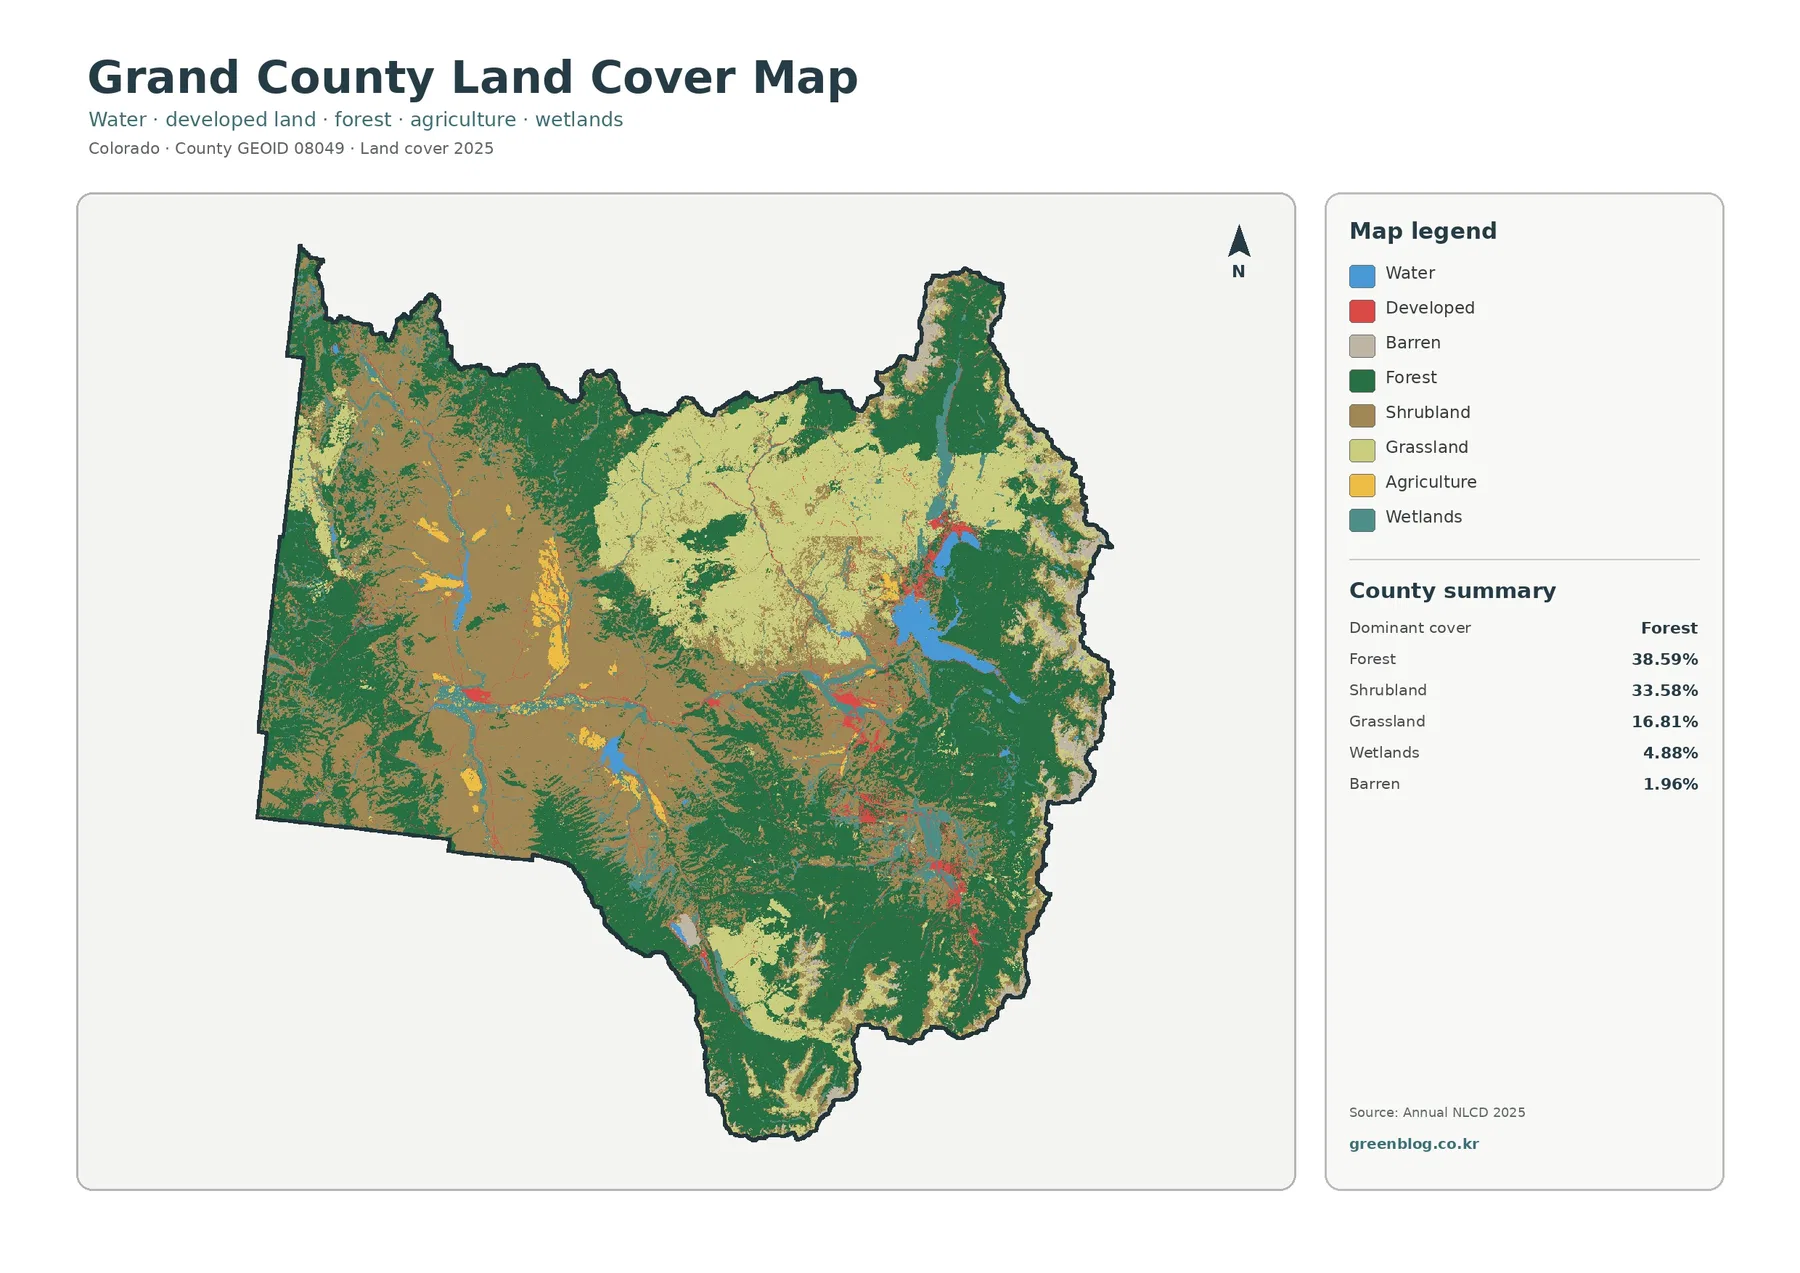
Water covers only 1.14% of Grand County, yet the eastern side contains some of the map’s most recognizable blue features. Grand County’s official Grand Lake information explains that Grand Lake is connected with Shadow Mountain Reservoir and forms the Three Lakes System with Lake Granby.
Concentration makes those lakes visually important despite their small countywide percentage. Large blue surfaces sit beside forest, grassland, wetlands, and developed patches, giving the east a very different appearance from the broad shrubland and open basin farther west.
Wetlands cover 4.88%, considerably more area than open water. Blue-green wetland traces appear around water bodies and along narrow drainage-like features through the basin. The layer is useful for broad environmental context, but its pixels are not legal wetland boundaries or surveyed stream edges.
Moving away from the large eastern lakes, grassland and shrubland become more prominent before forest expands again on surrounding mountain slopes. The full land-cover map is therefore useful not just for locating water but for seeing how the Three Lakes area sits within the larger Middle Park landscape.
The simplified map separates forested mountains from open basin cover
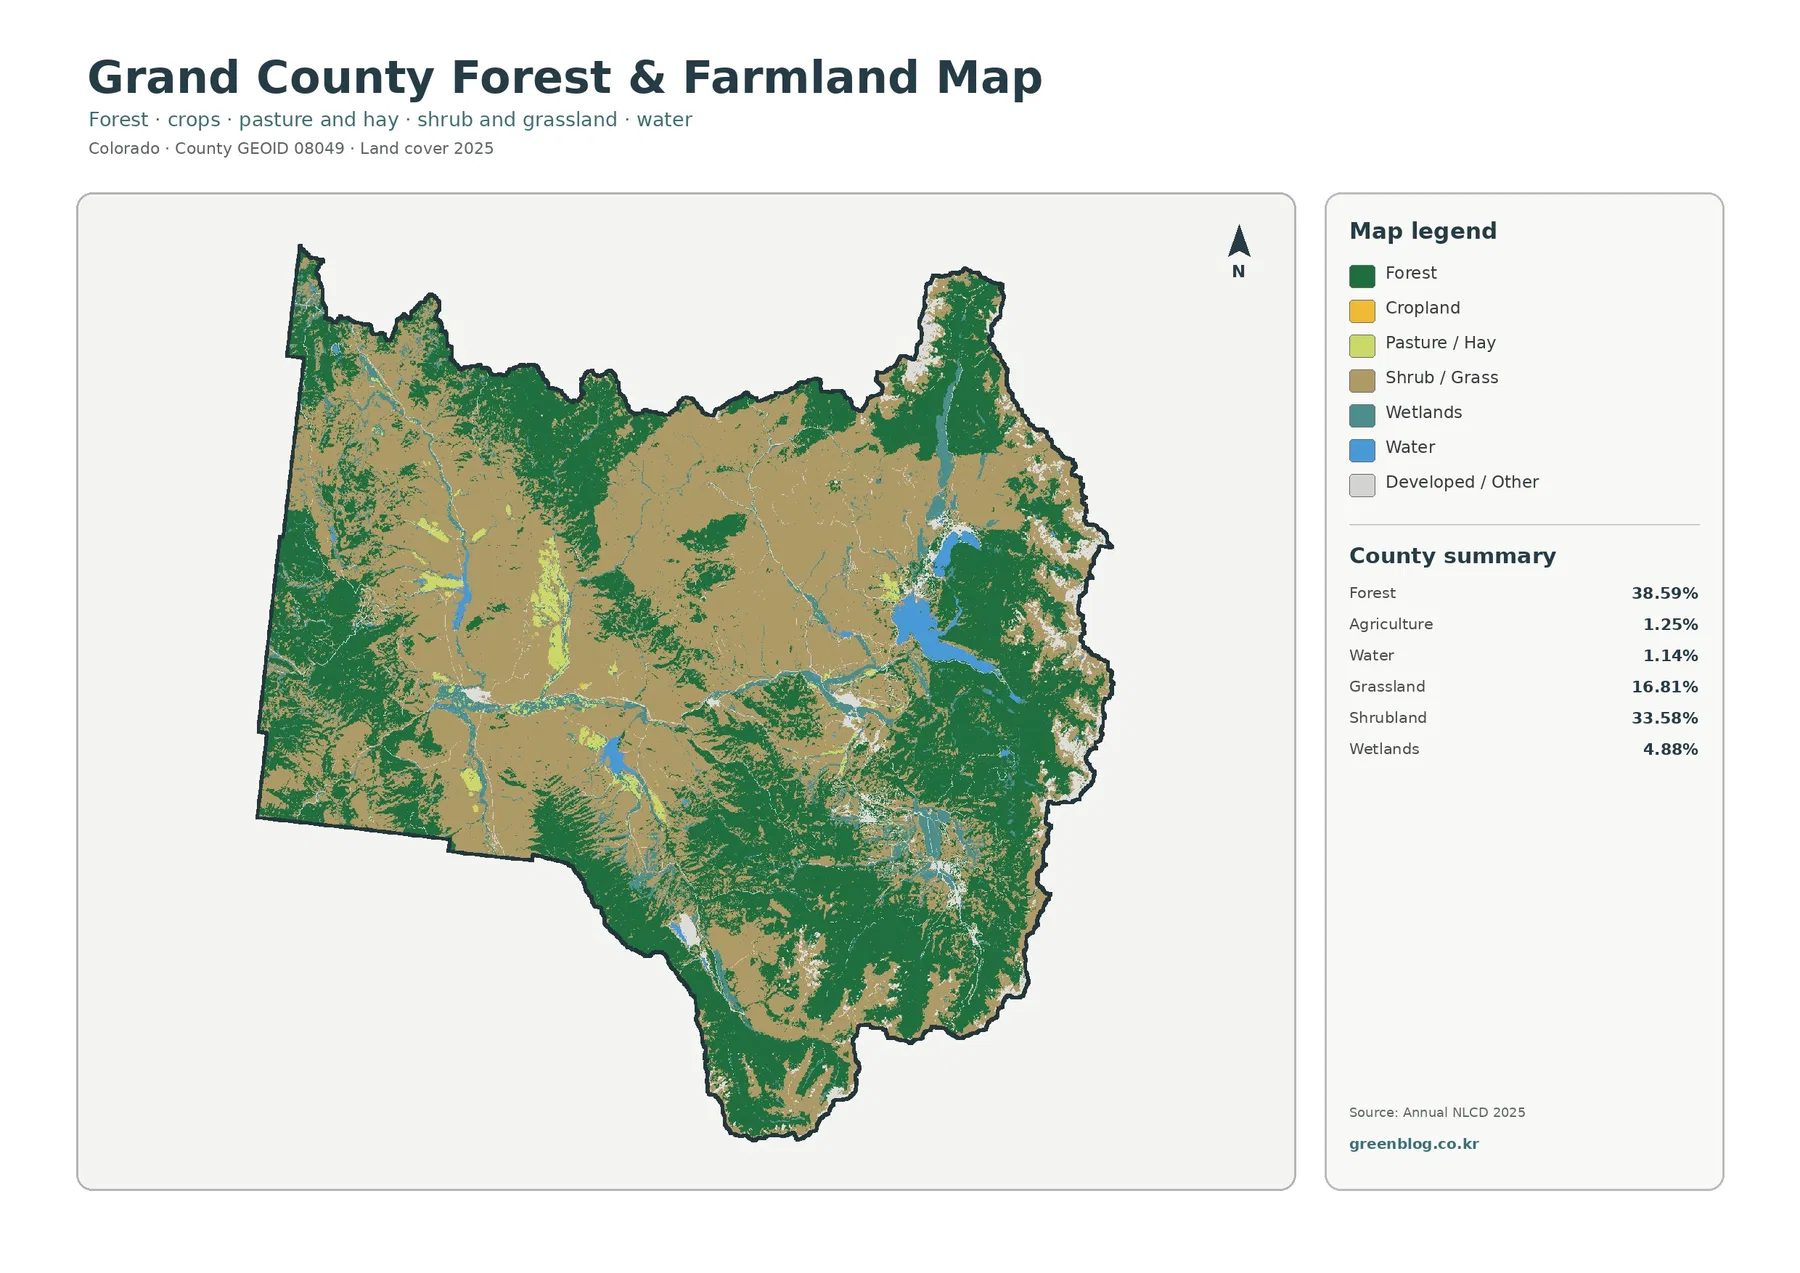
The forest-and-farmland version reduces the number of legend classes and makes the county’s main natural-cover contrast easier to follow. Dark forest fills broad northern, eastern, and southern mountain areas, while shrub-and-grass cover dominates much of the open interior and west.
Agriculture is only 1.25%. Small yellow or light agricultural patches appear mainly in selected open parts of the basin rather than forming a broad farm belt. Grand County therefore reads very differently from eastern Colorado counties where cropland or grassland can cover most of the map.
The Grand County Master Plan discusses Winter Park, Fraser, Granby, Grand Lake, Hot Sulphur Springs, Kremmling, and associated growth areas. The NLCD map does not show town boundaries, but those names provide useful reference points for the bright developed-or-other patches scattered through the otherwise natural landscape.
Raster agricultural colors should not be treated as farm-parcel boundaries. A 30-meter cell can contain vegetation, exposed soil, a road, or several surface types. Ownership, crop type, grazing rights, and zoning require separate county or agricultural datasets.
A 0.40% mean impervious surface reveals how localized development is
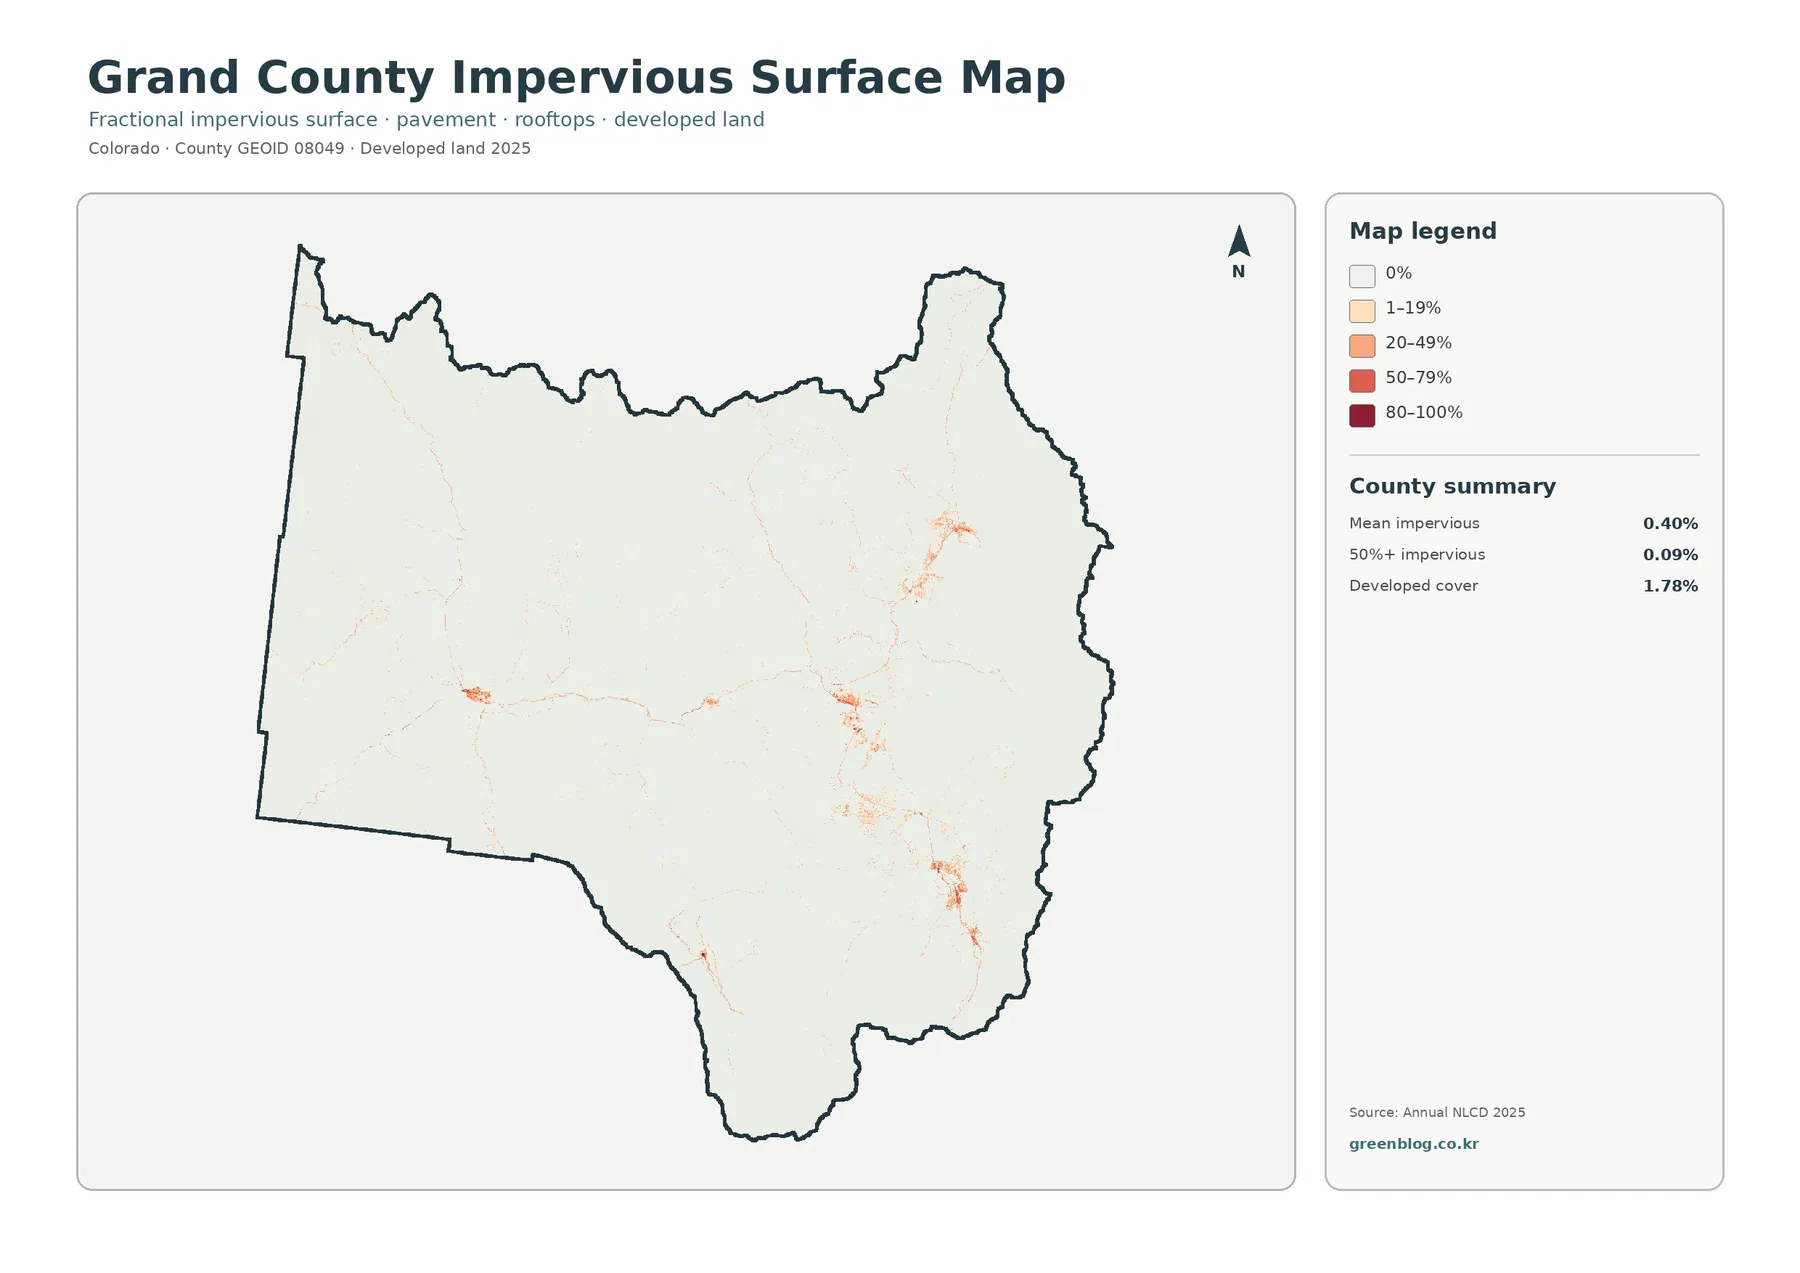
Impervious surface means pavement, rooftops, parking areas, and other hard materials that limit how quickly water soaks into the ground. Across the county, mean imperviousness is 0.40%, and cells mapped at 50% or greater imperviousness cover only 0.09%.
Most of the map is nearly white. Higher values appear in several small clusters in the east and southeast, with additional spots in the center and west. Comparing those clusters with towns identified in the county master plan makes it easier to understand why hard surfaces are concentrated around particular settlement areas rather than spread across Middle Park.
Developed land cover is 1.78%, which is not the same measurement as the 0.40% impervious mean. Land cover assigns a categorical class to each cell. Fractional imperviousness estimates how much of that cell is physically covered by pavement, buildings, or similar hard surface.
That distinction matters in mountain communities, where homes and roads can be interspersed with forest and open ground. Grand County’s official Mapping/GIS service provides parcel, public-land, and planning information when a question requires more detail than a county-scale raster can provide.
Forest loss dominates the 23.80% class-difference summary
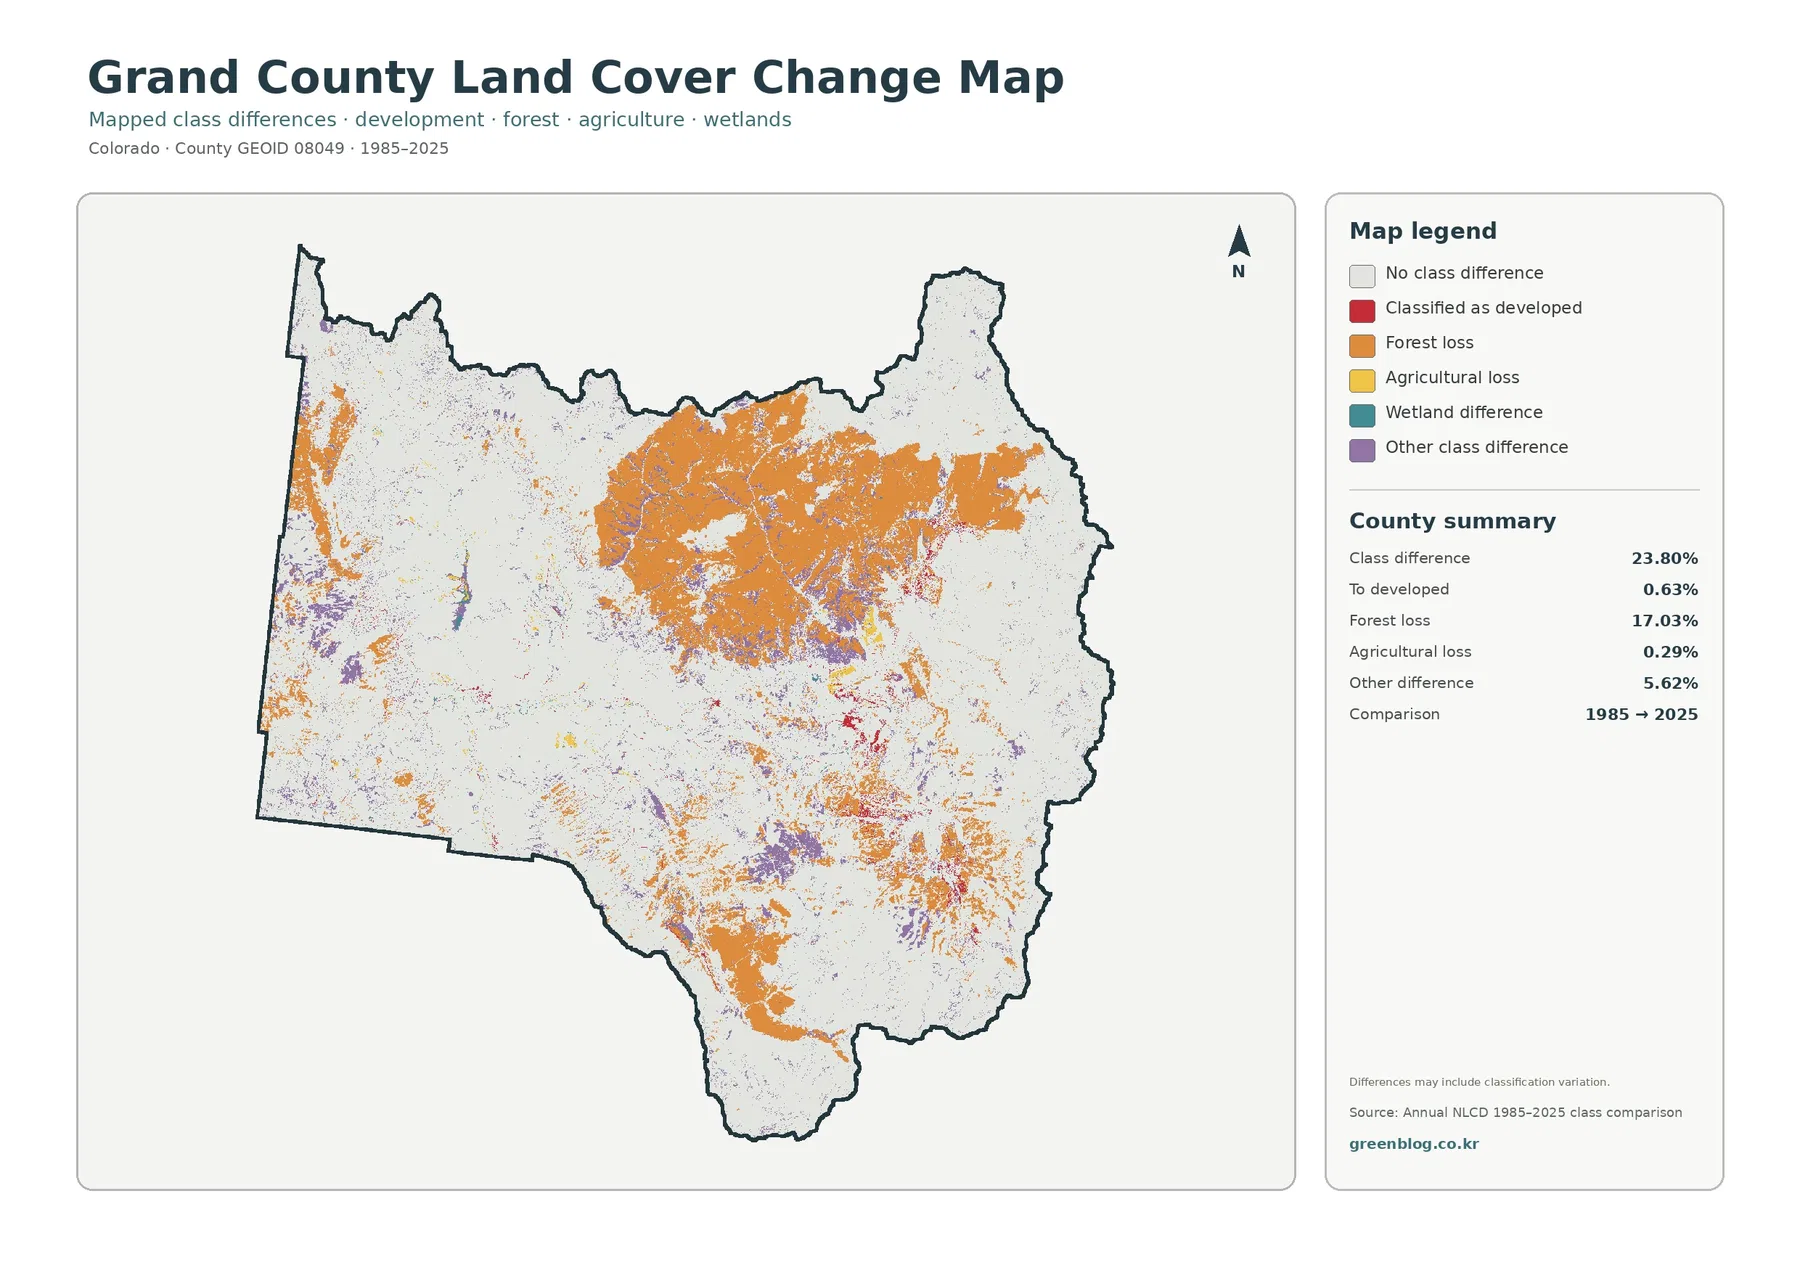
Mapped classes differ across 23.80% of Grand County between 1985 and 2025. Forest loss is by far the largest named category at 17.03%. Other class difference accounts for 5.62%, conversion to developed for 0.63%, and agricultural loss for 0.29%.
Large orange forest-loss areas dominate the north-central and eastern portions of the change map. Additional concentrations appear along the western edge and in southern mountain areas. The distribution is broad enough that long-term vegetation change is a much larger part of this map than urban conversion.
That 17.03% forest-loss category does not identify a cause. Wildfire, insect disturbance, timber change, vegetation recovery, and classification variability cannot be separated from this two-date layer alone. Intermediate-year imagery and local forest or fire records are needed before assigning an explanation to a specific orange area.
Red conversion-to-developed pixels are much more limited. They appear around some of the same eastern, southeastern, central, and western settlement areas that show current developed or impervious cover. Current development at 1.78% and conversion to developed at 0.63% are different statistics and should not be combined.
Granby, Winter Park, and Kremmling help orient three different map patterns
The Granby and Grand Lake side of the county is the easiest place to begin because the large water bodies provide strong visual landmarks. Once Lake Granby and the Three Lakes area are located, nearby forest, wetlands, and developed cover can be compared without relying on unlabeled raster pixels alone.
Fraser and Winter Park provide a southeastern reference for settlement and imperviousness. Current developed cover and harder surfaces are visible there, while the change map adds a separate layer of long-term class differences. Forest loss remains the dominant countywide change category even near areas with noticeable development.
Kremmling offers a western contrast. Shrubland and open basin cover are more important there, while forest occurs in large patches and hard surfaces remain localized. Comparing west and east makes the Middle Park basin easier to understand than treating Grand County as a single forested region.
Hot Sulphur Springs and the upper Colorado River corridor provide another useful geographic reference. The county’s official overview places the Colorado River headwaters within Middle Park. Because the supplied land-cover images do not label rivers, a county GIS or separate hydrography map is better for exact stream locations.
Thirty-meter cells and large change percentages require careful reading
Annual NLCD is raster data produced with 30-meter cells. A cell can contain trees, shrubs, grass, soil, water, roads, or buildings at the same time, yet the land-cover product assigns a representative class. Fractional imperviousness treats hard surfaces differently by estimating their share within the cell.
Small countywide percentages can still produce strong local features. Water is only 1.14%, developed cover 1.78%, and highly impervious cells 0.09%, yet Grand Lake, Lake Granby, and settlement clusters are easy to see because they are geographically concentrated.
Reconstructing an earlier forest total by subtracting the 17.03% change category from the current 38.59% forest share would be incorrect. One statistic describes current cover; the other describes a class-change category between two selected years.
Current land-cover and impervious maps represent 2025. Fire effects, forest recovery, new construction, or other changes after that year may not appear. More recent county or agency data are necessary for present-day site decisions.
Choose the map based on whether the question is water, vegetation, development, or time
Start with the general land-cover map for a countywide overview. It is the only one of the four that places the forest–shrubland mosaic, open grass areas, Three Lakes water, wetlands, development, and agriculture in the same legend.
The simplified forest-and-farmland map works better for explaining the difference between forested mountains and the open Middle Park basin. The impervious map is more useful for built-surface intensity because it removes most natural-cover detail and makes settlement clusters easier to see.
Use the change map when the question involves 1985–2025 differences, especially the large forest-loss pattern. Pair it with current land cover so forest loss is not mistaken for the present forest class and conversion to developed is not mistaken for all current development.
For a classroom or presentation, three reference areas work especially well: the Three Lakes area in the east, the Winter Park–Fraser side in the southeast, and the open western basin around Kremmling. Together they show why Grand County cannot be summarized by one land-cover percentage.
Download the four Grand County JPG maps
The downloadable ZIP contains four original JPG files: general land cover, forest and farmland, impervious/developed land, and 1985–2025 land-cover change. The WebP images in the article are optimized for quick online viewing, while the JPG files can be opened separately for closer inspection and printing.
Keep the map title, year, and legend with each image when reusing it. Current forest and forest loss, current development and conversion to developed, and developed cover and imperviousness are related but different measurements.
Frequently Asked Questions
Why do Grand Lake and Lake Granby stand out if water covers only 1.14% of Grand County?
Water is geographically concentrated rather than spread evenly across the county. Large eastern lakes occupy compact areas, so they are visually prominent even though the countywide water percentage is small.
Can the 17.03% forest-loss category be subtracted from the 38.59% current forest share?
No. The 17.03% value is a 1985–2025 change category, while 38.59% describes current 2025 forest cover. They are different measurements and cannot be subtracted to reconstruct a previous forest percentage.
Why is developed cover 1.78% while mean imperviousness is only 0.40%?
Developed cover assigns cells to a land-cover category, while imperviousness estimates the share of pavement, rooftops, and other hard surfaces within each cell. Developed mountain areas can still contain substantial forest, grass, and soil.
Map File Information
The download ZIP contains four original Grand County land-cover JPG maps.
- Included Files: Use only the versions confirmed in the article and supplied images
- File Type: Use the confirmed download contents
- Intended Use: Printing, education, presentations, and map-based projects
Related Maps
- Adams County Colorado Land Cover Map
- Alamosa County Colorado Land Cover Map
- Arapahoe County Colorado Land Cover Map
Sources and References
- MRLC Annual NLCD Data – official access point for Annual NLCD products and data.
- USGS Annual NLCD Land Cover Classification – official documentation for interpreting Annual NLCD classes and 30-meter raster data.
- Grand County – About Grand County – official county context for Middle Park, the Colorado River headwaters, Grand Lake, and public lands.
- Grand Lake Clarity – official county information about Grand Lake, Shadow Mountain Reservoir, Lake Granby, and the Three Lakes System.
- Grand County Mapping / GIS – official local mapping for parcels, public lands, planning, zoning, and related geographic information.
Green Map creates custom-edited map images using open geographic data sources such as geoBoundaries, Natural Earth, OpenStreetMap, and government open data.
These maps are edited visual materials, not raw data files, and are provided for education, documents, presentations, and graphic reference.