The Cayuga County New York Land Cover Map is easiest to orient by starting with Owasco Lake. Agriculture covers much of the central and southern county, Auburn forms the clearest developed concentration near the lake’s northern end, and the far north shifts toward a wetter mix of marshes and open water. These three areas give the county a land-cover pattern that is more varied than a simple “farm county” label suggests.
This page compares four Cayuga County themes: general land cover, forest and farmland, impervious surface and developed land, and mapped change from 1985 to 2025. WebP previews are available in the article, while the four original JPG maps can be downloaded together in one ZIP file. Used side by side, they make it easier to compare farm country, Auburn, Owasco Lake, northern wetlands, and long-term classification differences.
Table of Contents
Start with Owasco Lake, Auburn, and the northern wetlands
Three landmarks make the maps much easier to navigate. Owasco Lake is the long blue water body near the middle of the county and provides an immediate north-south reference. Auburn appears as the largest developed cluster just northwest of the lake’s northern end. Farther north, wetland and water classes become more prominent and less regular, signaling a landscape very different from the broad farm country to the south.
This approach matters because countywide percentages can hide location. A 47.45% agriculture share does not mean every part of Cayuga County looks equally agricultural. Likewise, a 10.19% developed share does not mean development blankets one tenth of every township. The maps show concentration and transition: broad cultivated areas, wooded breaks, a compact urban focus, lake shorelines, and wet northern terrain. Those spatial relationships are more informative than any single number.
The countywide map is a patchwork, not a single rural color
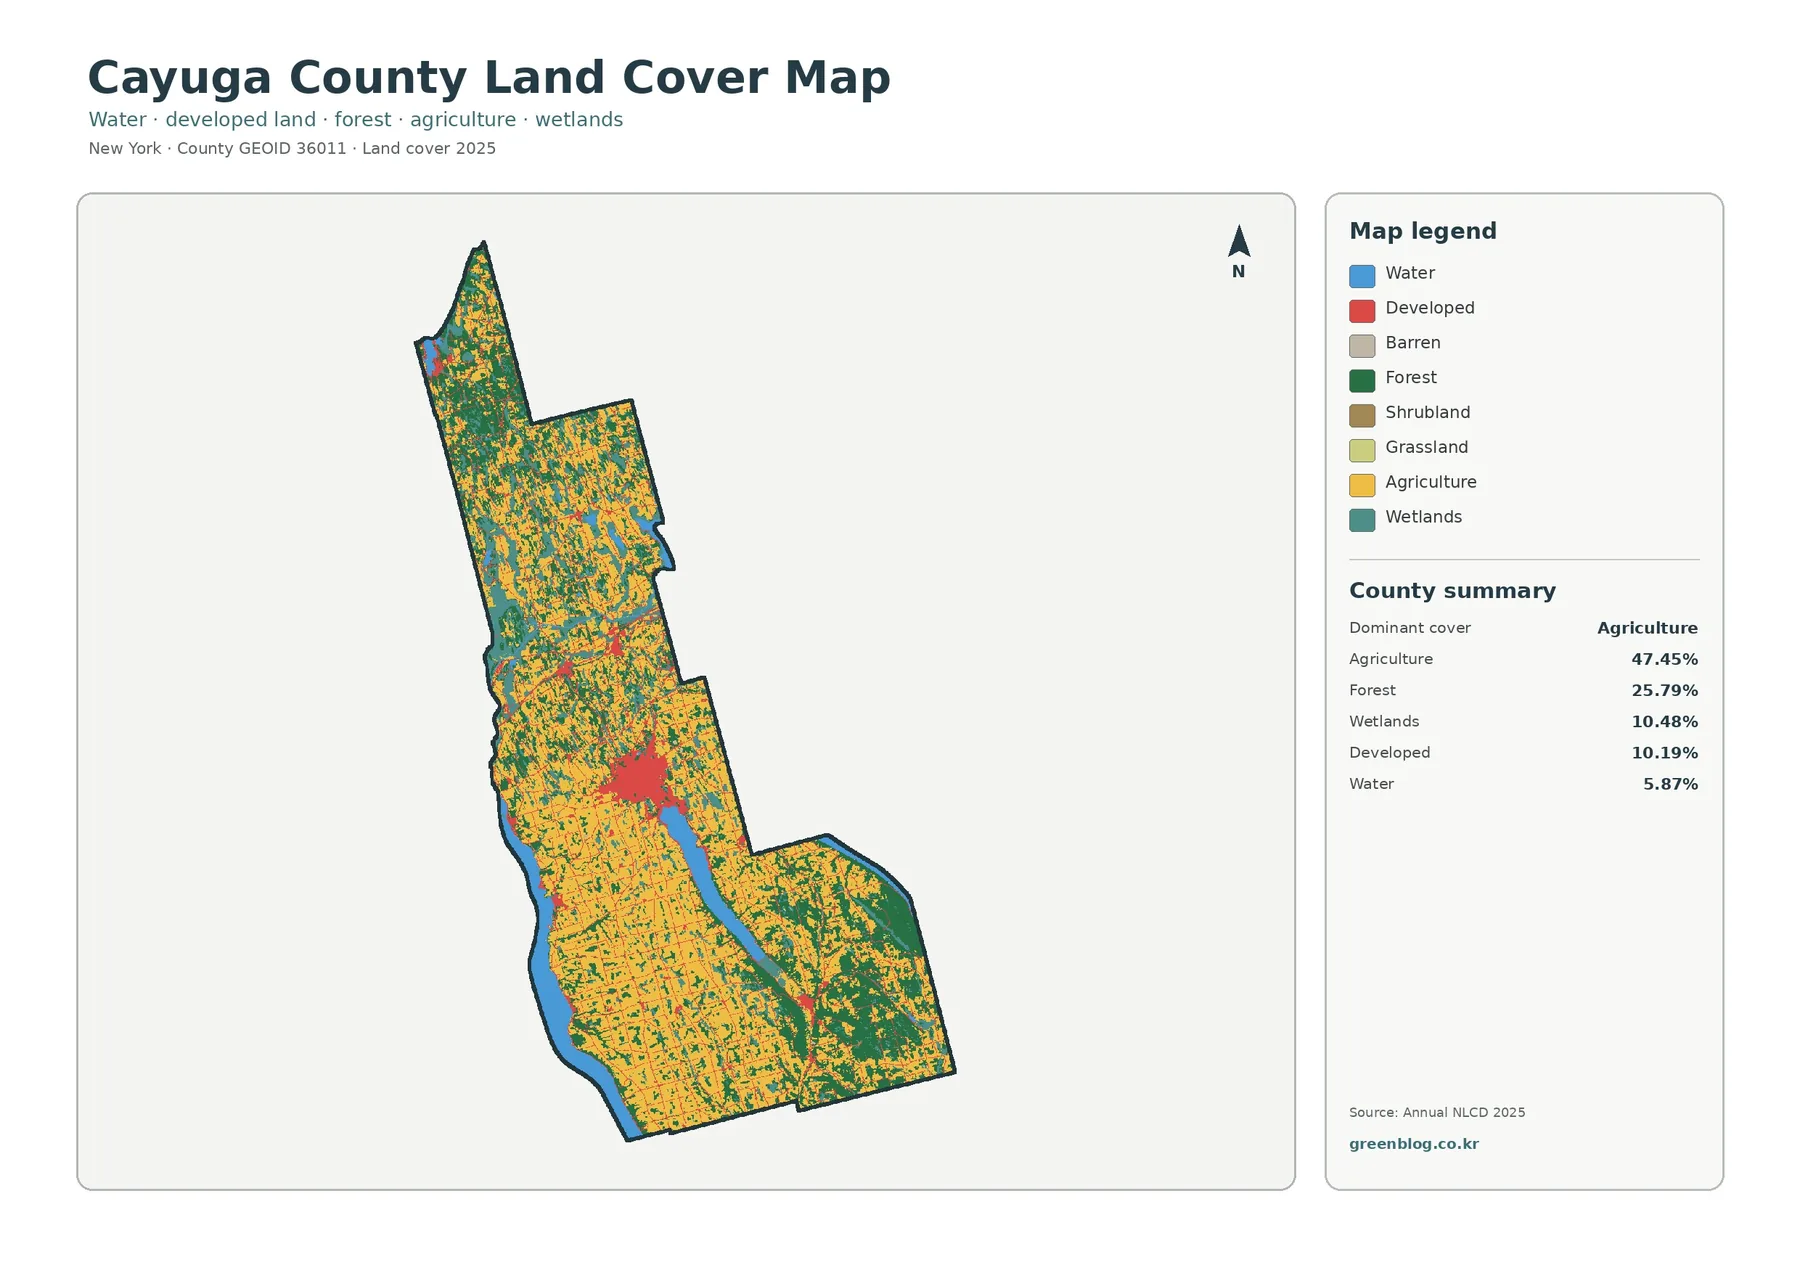
Yellow agricultural cover occupies much of central and southern Cayuga County, but it is repeatedly broken by dark green forest. The southeastern portion contains larger wooded tracts, while the northern reaches mix agriculture with wetland and water classes. This is not the visual pattern of an uninterrupted agricultural plain. It is a working landscape threaded with forest blocks and shaped by lakes and wet ground.
Water provides the strongest visual anchors. Owasco Lake runs through the middle of the county, while the Cayuga Lake shoreline forms part of the western edge. In the north, blue water and teal wetland areas occur close together. These features are useful when discussing watershed context because farmland, forest, and developed land can be compared directly with the surfaces that receive runoff. The map cannot identify a pollution source, but it can show where different cover types lie in relation to water.
Developed land appears in a very different pattern. Auburn is the most obvious red cluster. Elsewhere, development is thinner and more dispersed, often appearing as narrow traces and small nodes within the rural matrix. This contrast is one reason the countywide view is valuable: it shows that Cayuga’s built environment is concentrated rather than evenly spread across the county.
Why the 47.45% agricultural share matters spatially
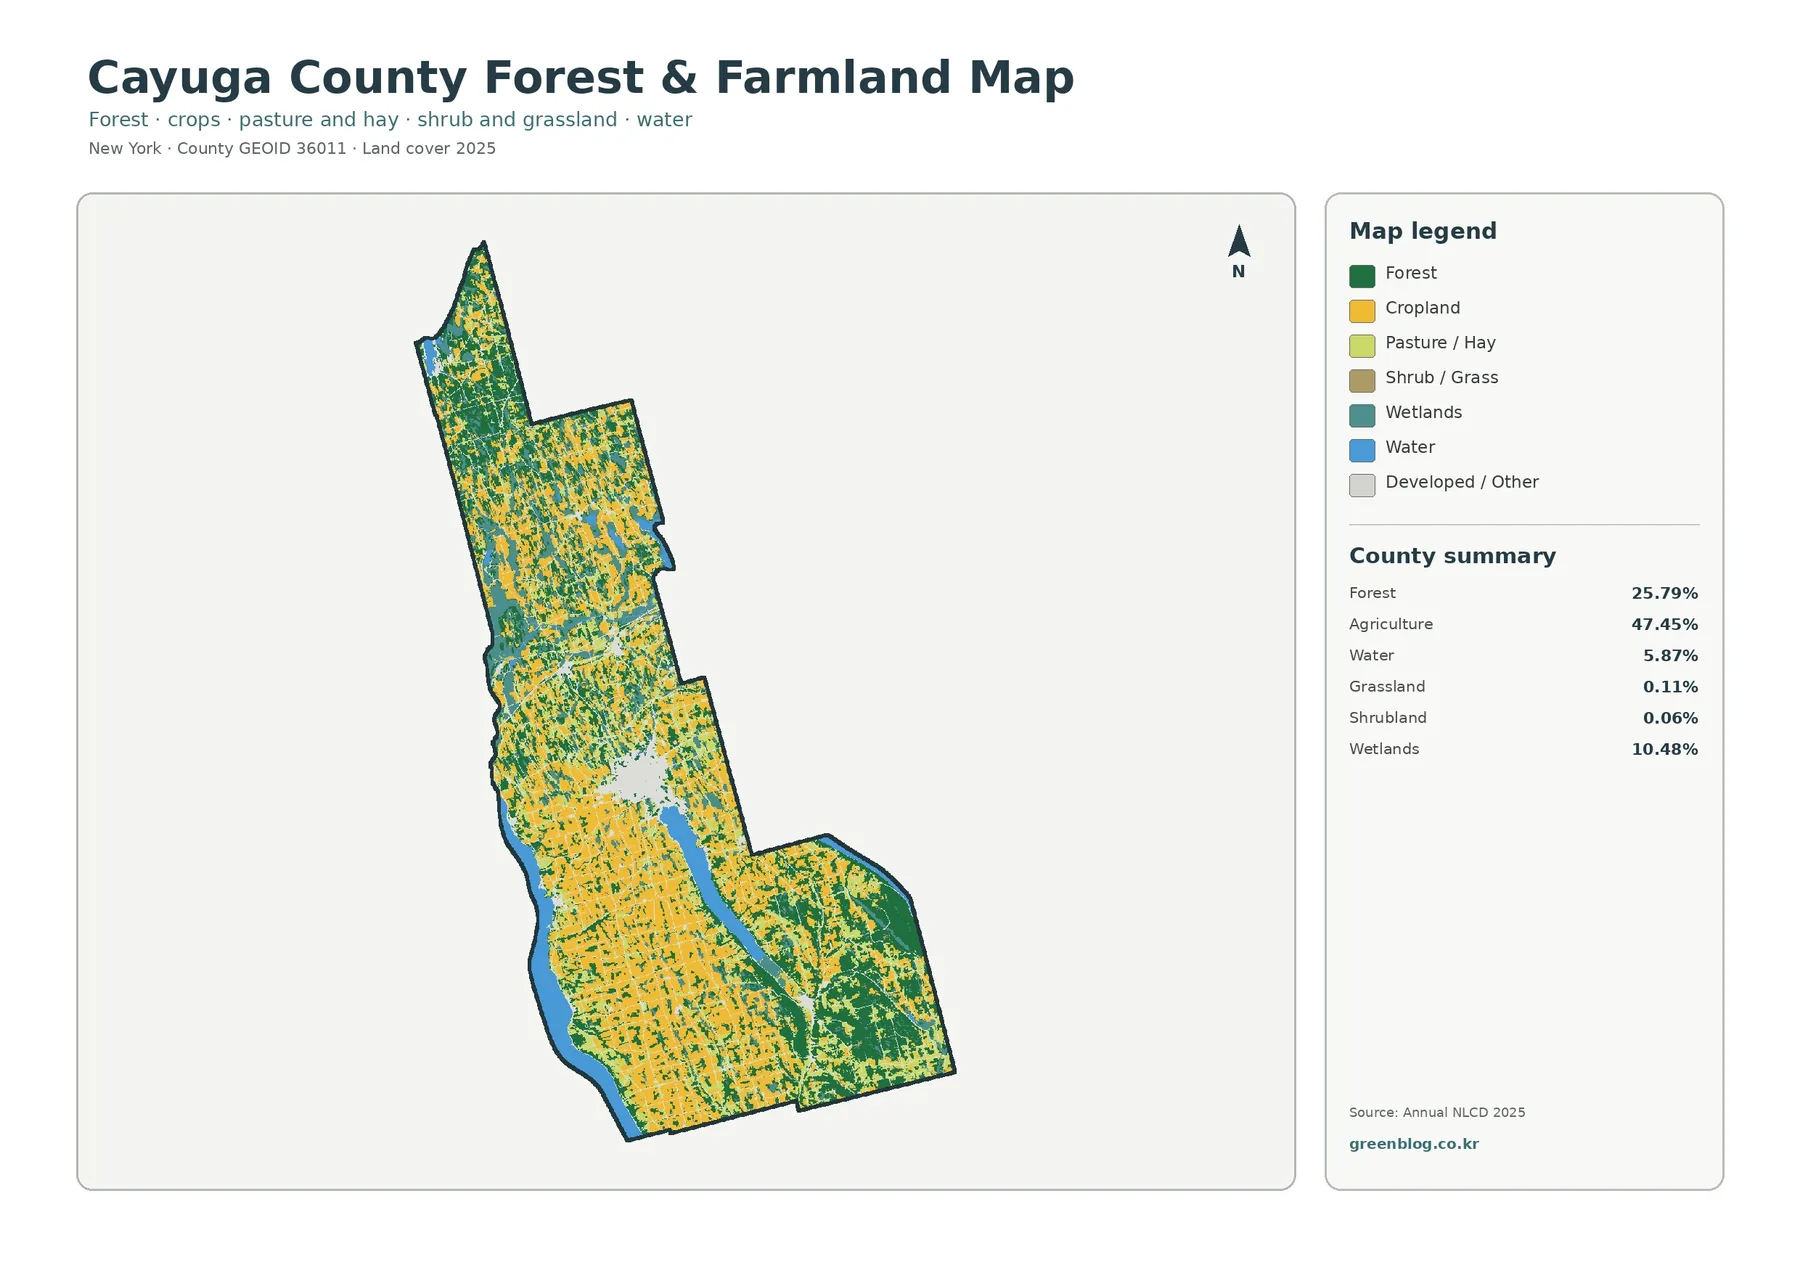
The forest-and-farmland map strips away some of the visual complexity and makes the rural structure clearer. Cropland and pasture or hay spread across a large part of the county, while forest accounts for 25.79% of mapped cover. In central and southern areas, cultivated cover often forms broad runs. In the southeast and in parts of the north, forest becomes more frequent and interrupts those runs more strongly.
The northern end is especially useful for comparison. Wetlands occupy 10.48% countywide, and in the north they break the regular geometry of agricultural cover. Instead of reading the area as simply “more farms” or “more forest,” the map shows places where productive land, wet ground, and water are interwoven. The New York State Department of Environmental Conservation’s information on the Montezuma Wetlands Complex provides a useful real-world reference for this part of the county.
None of the agricultural colors should be interpreted as parcel ownership or a crop inventory. A raster cell classified as cropland does not identify a farm boundary, and the map does not distinguish every crop species. Cayuga County’s own agriculture GIS service is a better source for agricultural-district and soil context. The land-cover map works at a broader scale: it answers where agricultural surfaces are concentrated and where forest or wetlands interrupt them.
Impervious cover turns Auburn into the clearest hotspot
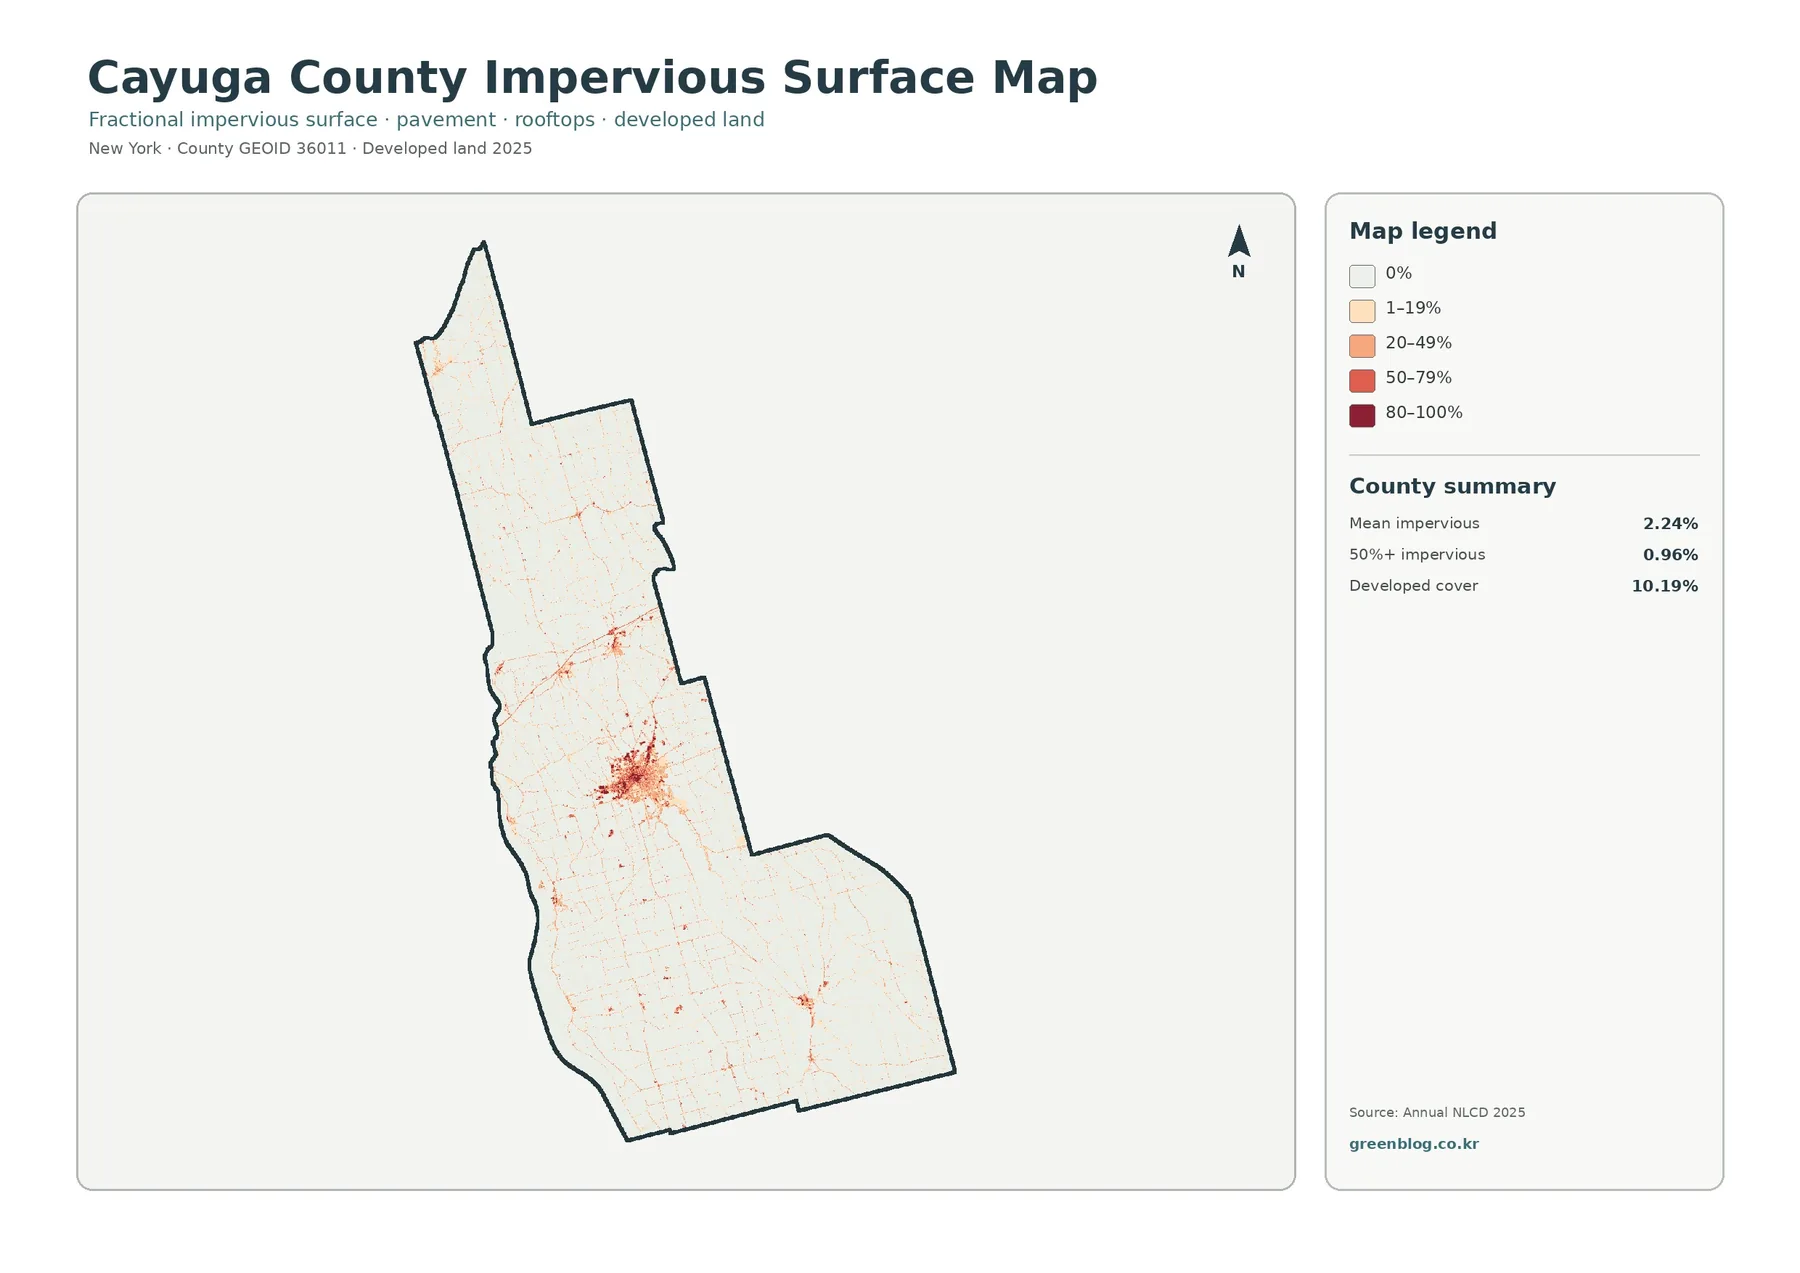
The impervious-surface map almost reverses the visual emphasis of the land-cover maps. Most of the county is pale, while Auburn stands out as a dense orange-to-red concentration. Impervious surface refers to hard cover such as rooftops, parking areas, and pavement that limits direct infiltration into soil. The county summary reports a countywide mean impervious value of 2.24%, with 0.96% of the county mapped at 50% impervious or greater.
Those figures should not be confused with the 10.19% developed-land share. “Developed” is a land-cover class that can include vegetation within developed settings, while impervious percentage measures how much of a cell is physically hard-surfaced. A low-density residential area, for example, may be classified as developed even though lawns and trees occupy most of the cell. The two maps therefore answer related but different questions.
Outside Auburn, darker impervious values are generally narrow or nodal rather than expansive. Road corridors and smaller settled places can be traced as fine lines and small clusters, while the large farm and forest areas remain light. This makes the map particularly useful for illustrating the difference between a county’s legal or administrative extent and the much smaller footprint of its heavily paved surfaces.
What changed between 1985 and 2025—and what the map cannot prove
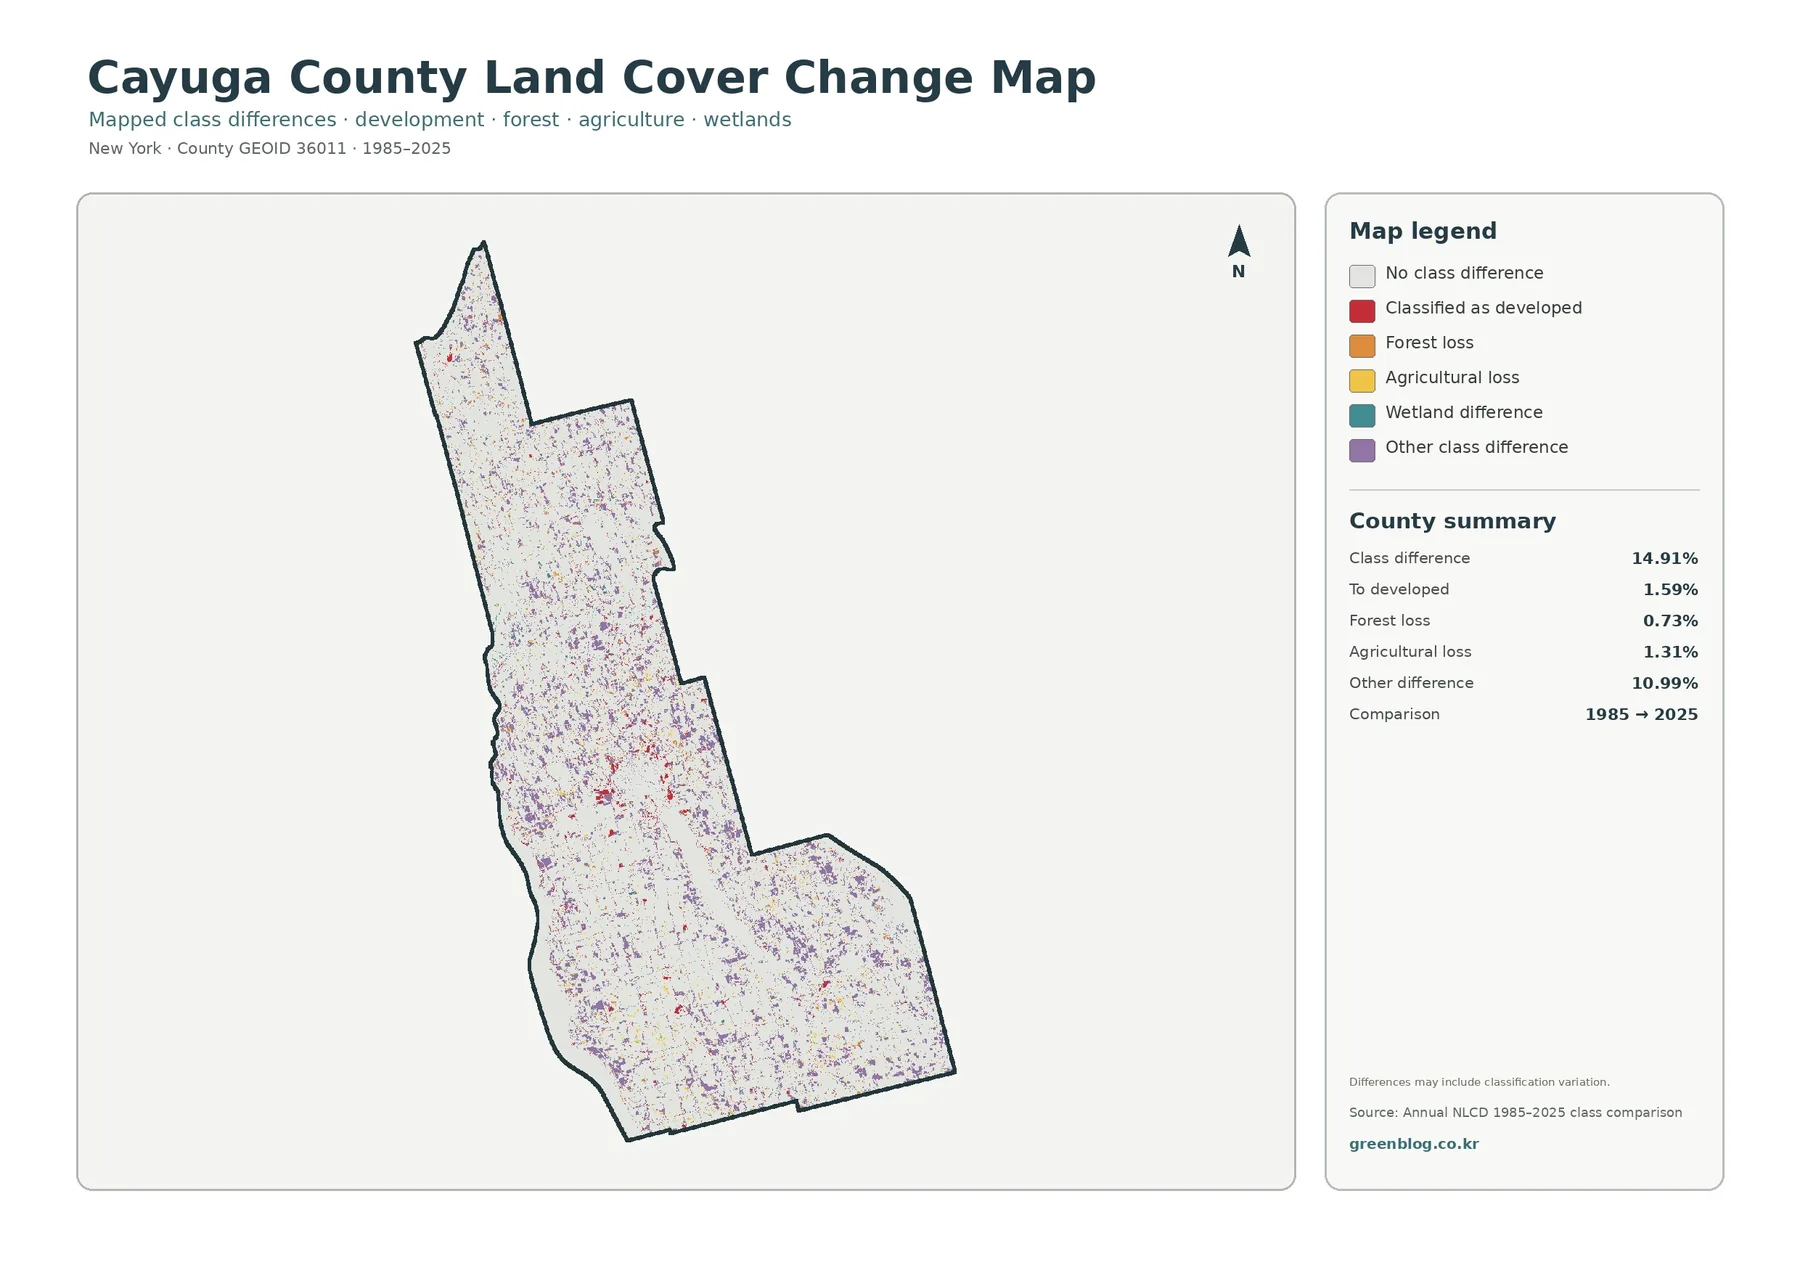
The change map is deliberately dominated by light gray. Gray indicates that the representative class is the same at the two comparison endpoints; colored cells indicate a difference. The supplied summary gives a total class-difference value of 14.91%. Of that, 1.59% is shown as classified to developed, 1.31% as agricultural loss, 0.73% as forest loss, and 10.99% as other class difference. Taken as a whole, the change layer does not tell a simple story of one transition overwhelming the county.
Red change cells are relatively noticeable around Auburn, which is consistent with the developed and impervious maps. Elsewhere, purple and other change colors are dispersed as many small patches through agricultural and wooded areas. That scattered pattern is important: it suggests that anyone investigating land-cover history should sample multiple parts of the county rather than assume one uniform trend.
A colored cell is not automatic proof of a real-world land conversion. Endpoint comparisons separated by decades can be affected by sensor differences, seasonal conditions, mixed pixels, and changes in classification methods. The map itself notes that differences may include classification variation. For site-specific claims—such as whether a particular field became forest or a woodland became developed—historic aerial photography, parcel records, and local documentation are needed.
Wetlands give northern Cayuga a different visual rhythm
Wetlands deserve more attention here than they would in many county profiles because they make up 10.48% of the supplied 2025 land-cover summary. Wetlands are unevenly distributed, with the northern end showing a pronounced wetland-water mosaic that contrasts with the more regular agricultural pattern farther south. This northern texture also helps explain why a single “farm county” description is incomplete for Cayuga County.
The Montezuma Wetlands Complex, described by the New York State Department of Environmental Conservation, provides an official ecological reference for this northern landscape. Owasco Lake offers a different reference point: the wetland complex spreads broadly across the north, while the long Finger Lake cuts through the county farther south. Together they demonstrate why surface water and wetland classes are not peripheral details in these maps—they help organize the entire geography of land cover.
Practical ways to use the four maps
- Regional geography: Use Owasco Lake, the Cayuga Lake edge, Auburn, and the northern wetlands as landmarks for explaining the county’s internal contrasts.
- Agricultural landscape study: Compare the continuity of cropland and pasture with the locations of forest fragments and wetland interruptions.
- Urban footprint discussion: Contrast the 10.19% developed class with the much smaller area of high impervious cover to explain why “developed” and “paved” are not equivalent.
- Watershed education: Examine where farm, forest, urban cover, wetlands, and open water meet around Owasco Lake and in northern Cayuga County.
- Change screening: Use the 1985–2025 comparison to locate areas worth checking in historic imagery rather than treating every colored cell as a confirmed land conversion.
Scale, mixed pixels, and land-use limits
Annual NLCD products are designed for consistent regional comparison, not parcel surveying. At a 30-meter raster scale, a single cell may contain some combination of trees, lawn, field, road, and buildings. The classification assigns a representative category, so mapped boundaries will not necessarily match fences, tax parcels, road edges, or shorelines at very fine scales.
Land cover is also different from land use, zoning, ownership, and legal protection. Forest cover does not mean that a parcel is a park. Developed cover does not establish a zoning category. Agricultural cover does not define an agricultural district. For property decisions, permitting, engineering, or regulatory work, use the authoritative dataset created for that purpose. These maps are best used to recognize countywide patterns, compare landscapes, and identify questions for further research.
Download the Cayuga County land-cover map set
The download package contains the four original JPG maps represented in this article: countywide land cover, forest and farmland, impervious surface and developed land, and the 1985–2025 land-cover change comparison. They are suitable for printing, classroom handouts, presentations, and side-by-side geographic analysis.
Frequently Asked Questions
Does 47.45% agriculture mean that nearly half of Cayuga County is active farmland?
It means that 47.45% of the mapped cells fall into the agriculture grouping used for this land-cover product. It is not a farm-ownership statistic, an agricultural-district boundary, or a measure of acreage currently planted in a particular crop. County agricultural GIS sources are better for those questions.
Why is Auburn so prominent on the impervious-surface map?
Auburn contains the county’s strongest concentration of rooftops, paved streets, parking areas, and other hard surfaces. That makes it stand out on a map based on impervious percentage. The map does not, however, measure flood risk or drainage performance by itself.
Are all colored cells on the 1985–2025 map confirmed land-cover conversions?
No. A color indicates that the endpoint classifications differ. Real landscape change may be responsible, but classification variation, mixed pixels, sensor differences, or seasonal effects can also contribute. Site-level conclusions should be checked against historical imagery and local records. Map File Information Cayuga County Four-Map Package
Map File Information
Download the map files associated with this page for reference, printing, and compatible visual projects.
- Included Files: Use only the versions confirmed in the article and supplied images
- File Type: Use the confirmed download contents
- Intended Use: Printing, education, presentations, and map-based projects
Related Maps
- Allegany County New York Land Cover Map
- Bronx County New York Land Cover Map
- Broome County New York Land Cover Map
Sources and references
- MRLC Annual NLCD Data — official access to national land-cover and related raster products.
- USGS Annual NLCD Land Cover Classification — class definitions and interpretation guidance for Annual NLCD products.
- Cayuga County GIS Agriculture Map Service — official county spatial information for agricultural districts and soils.
- New York State DEC: Owasco Lake — official lake information and watershed context.
- New York State DEC: Montezuma Wetlands Complex — official background on the wetland complex spanning northern Cayuga County and nearby areas.
Green Map creates custom-edited map images using open geographic data sources such as geoBoundaries, Natural Earth, OpenStreetMap, and government open data.
These maps are edited visual materials, not raw data files, and are provided for education, documents, presentations, and graphic reference.