This page starts with Raymondville as the inland reference for a Willacy County Map, then follows the county south toward Lyford and Sebastian and far east toward Port Mansfield on Laguna Madre. Download the high-resolution A3 JPG map ZIP from the box below when you need printable or editable files; it contains separate county-reference, ranked-city, terrain-and-water, and elevation maps.
Willacy County has an unusually strong inland-to-coast contrast. Raymondville, Lyford, and Sebastian are grouped along the western road corridor, while San Perlita lies farther east and Port Mansfield sits at the end of a long route toward Laguna Madre. The water map is equally distinctive because straight drainage channels dominate much of the interior, while the eastern edge opens into broad coastal water. Elevation is very low countywide, but the western and northwestern interior still stands noticeably above the coast-facing east.
Table of Contents
Raymondville separates the inland road corridor from the Port Mansfield route
Raymondville is the easiest place to locate first on the county reference map. Route labels 69E and 77 continue south toward Lyford and Sebastian, forming the clearest inland settlement corridor. Lasara lies west of Raymondville and provides a separate western reference. With those places fixed, the western half of the county is easy to orient before following the much longer road east.
Routes 497 and 186 extend east from the Raymondville area. San Perlita appears along that direction, while Port Mansfield is much farther away on the Laguna Madre side. Zapata Ranch and Santa Monica are smaller southern references. This long eastward gap is one of the defining features of the map: the county’s main inland communities are clustered in the west, but its coastal endpoint is separated by a broad, sparsely settled interior.
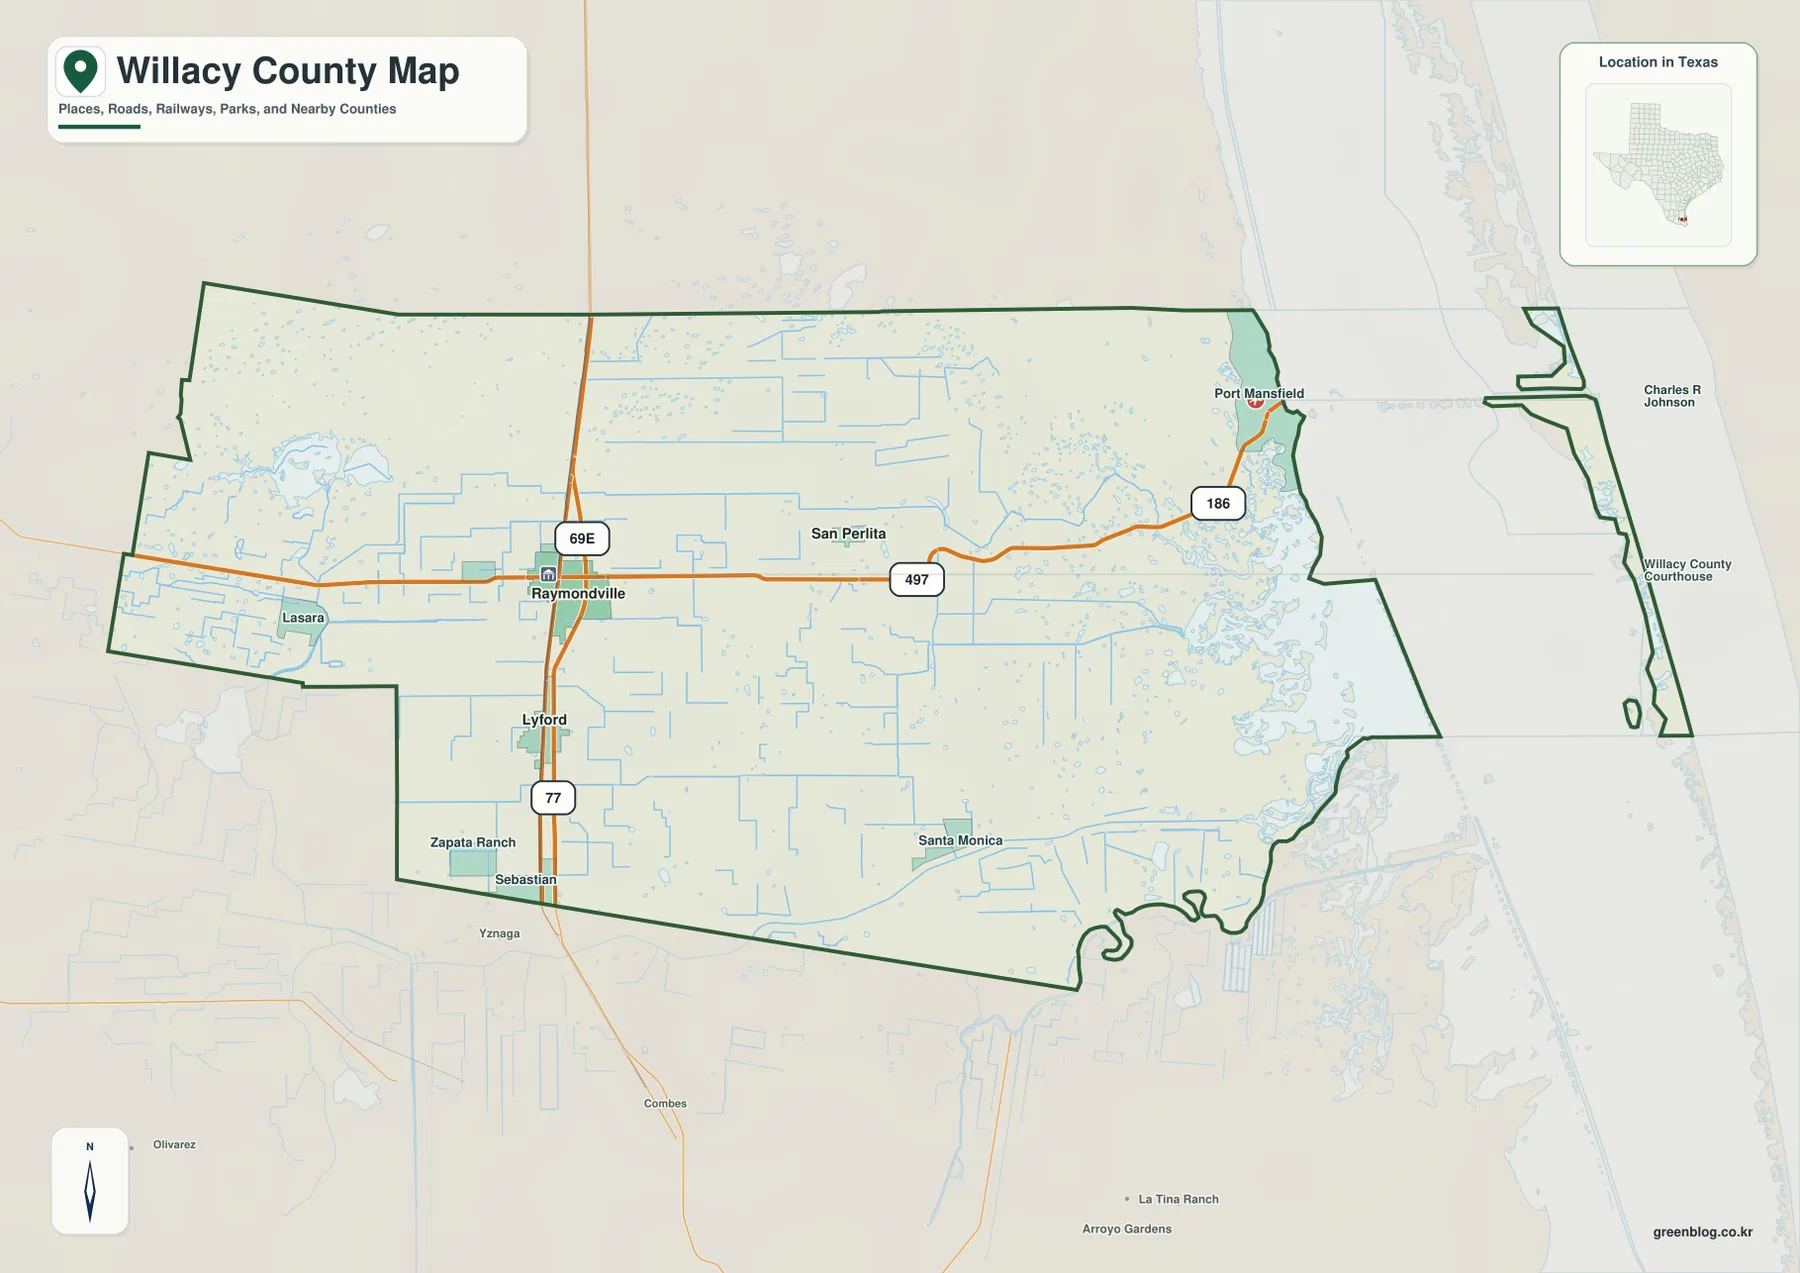
The eastern boundary looks very different from the straight interior county lines. Laguna Madre and the narrow coastal strip create an irregular outline around Port Mansfield, while many small interior water lines follow much straighter paths. The contrast hints at an engineered drainage landscape inland and a naturally complex lagoon shoreline on the coast.
Raymondville, Lyford, and San Perlita form the ranked city pattern
The ranked-city view highlights three communities. Raymondville is number 1 in the western interior, Lyford is number 2 to the south, and San Perlita is number 3 to the east. Port Mansfield remains an important coastal place on the county reference map, but it is not included among the three ranked cities in this particular city layer.
The CITY INDEX prints map values of 10,185 for Raymondville, 2,054 for Lyford, and 462 for San Perlita. These figures explain the ranking and relative symbol size used in the supplied graphic and should be treated as map values rather than guaranteed current population estimates. For geographic reading, the useful point is that Raymondville clearly dominates the inland settlement pattern while San Perlita provides the transition toward the long eastern coastal corridor.
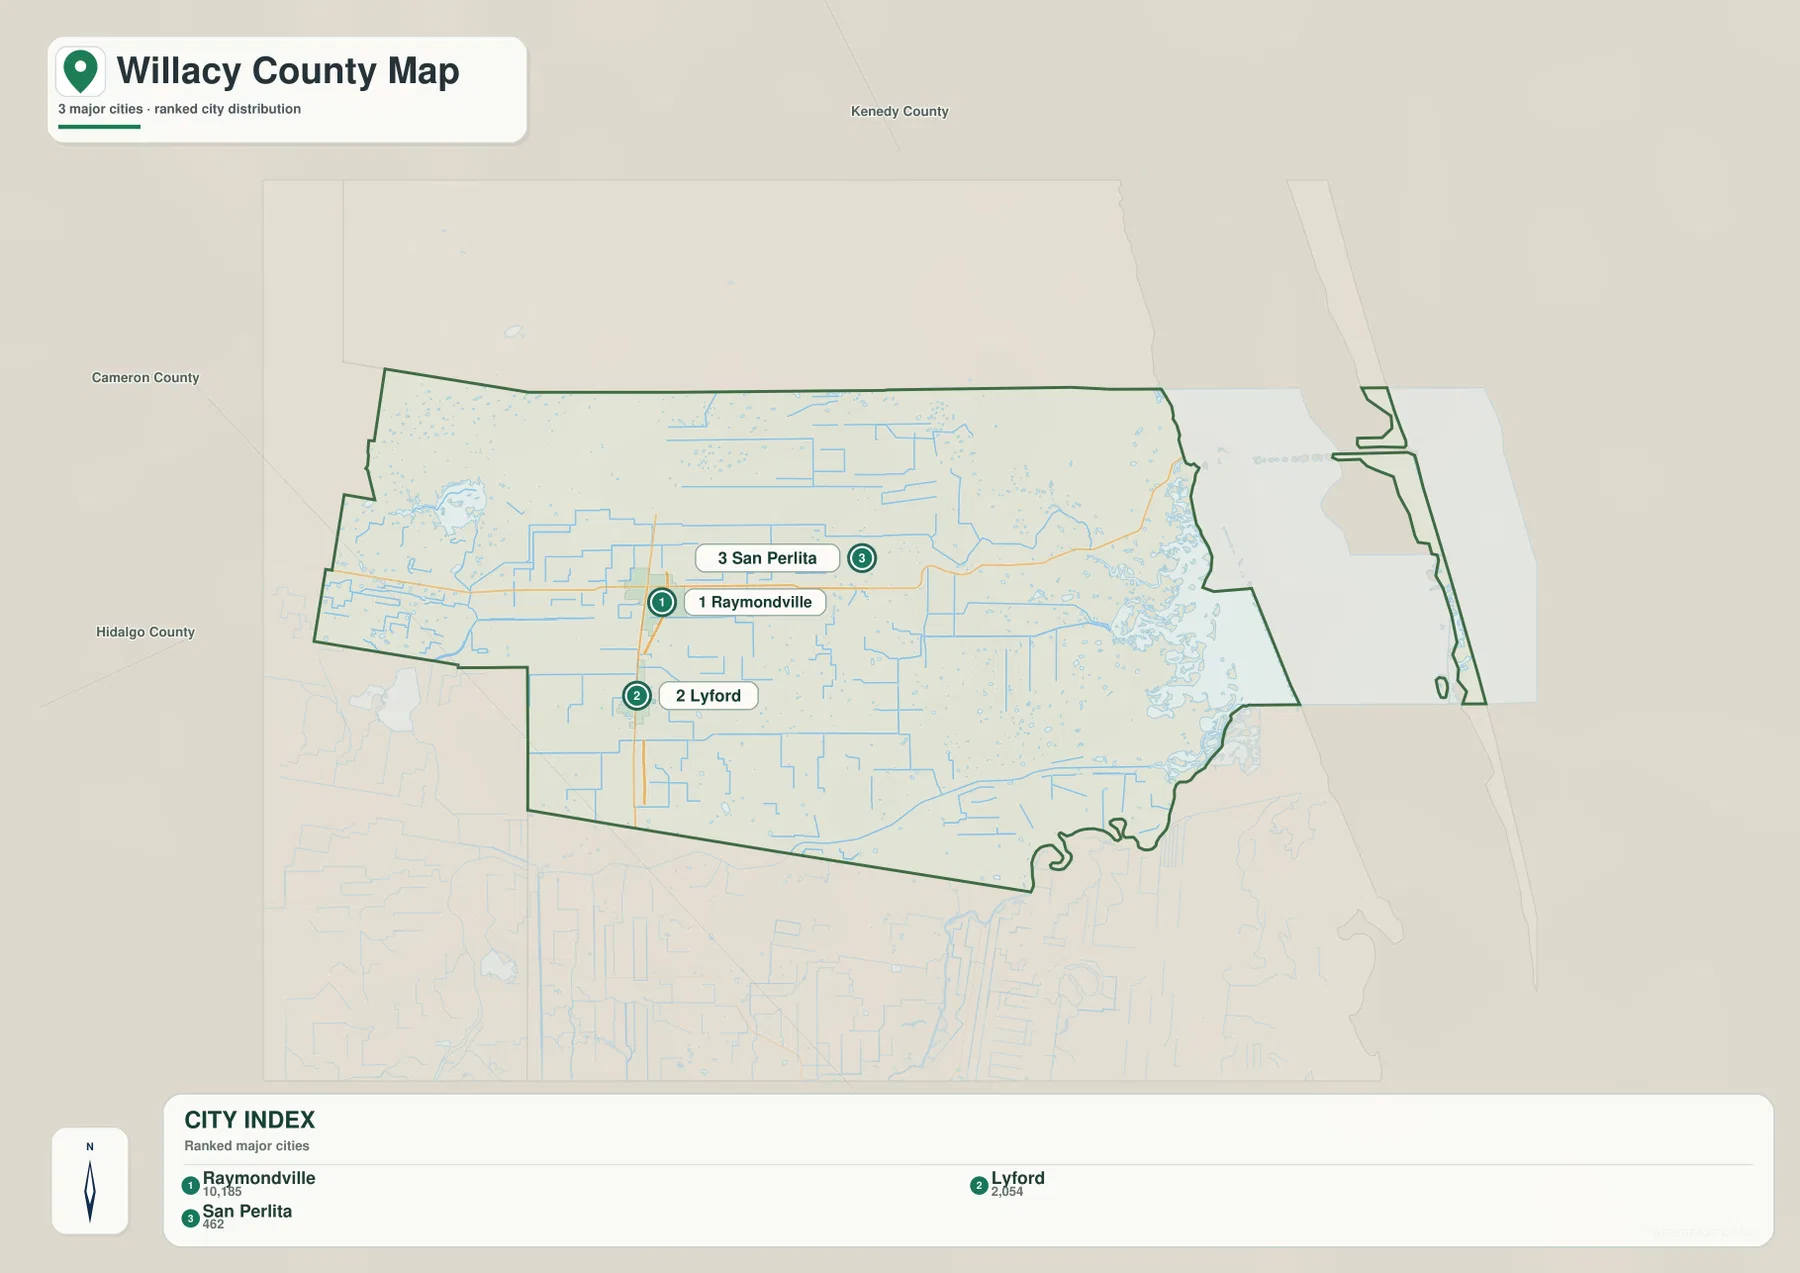
Hidalgo and Cameron counties appear along the western and southwestern side of the city map, while Kenedy County lies to the north. Those outer references make the settlement imbalance easy to see: nearly all ranked urban detail is concentrated in the western portion, and the eastern half contains far more open land and coastal water than city symbols.
Laguna Madre and straight interior drains define the water map
Laguna Madre is the dominant water feature on the eastern side of the terrain-and-water map. The broad lagoon runs along the coast, while the Gulf Intracoastal Waterway follows the same general north-south direction farther east. El Realito Bay, Stover Cove, Cayo Atascoso, and Laguna Atascosa are labeled near the southeastern coastal side and give the Port Mansfield area a very different water geography from the interior.
Inland, the most noticeable named channels are drains rather than large natural rivers. Salt Lake Drain and West Main Drain appear west and northwest of Raymondville, while East Main Drain extends across the eastern interior. Many additional straight blue channels follow the rectangular field pattern, making the interior water network look highly organized compared with the irregular lagoon shoreline.
La Sal Vieja and Harbin Reservoir are labeled in the western part of the county, and Santa Rosa Lake provides another named water reference near the southern interior. These smaller water bodies are useful for orientation because Willacy County lacks a single large inland river dominating the map. The key contrast is between small inland lakes and drainage channels on one side and the expansive Laguna Madre coast on the other.
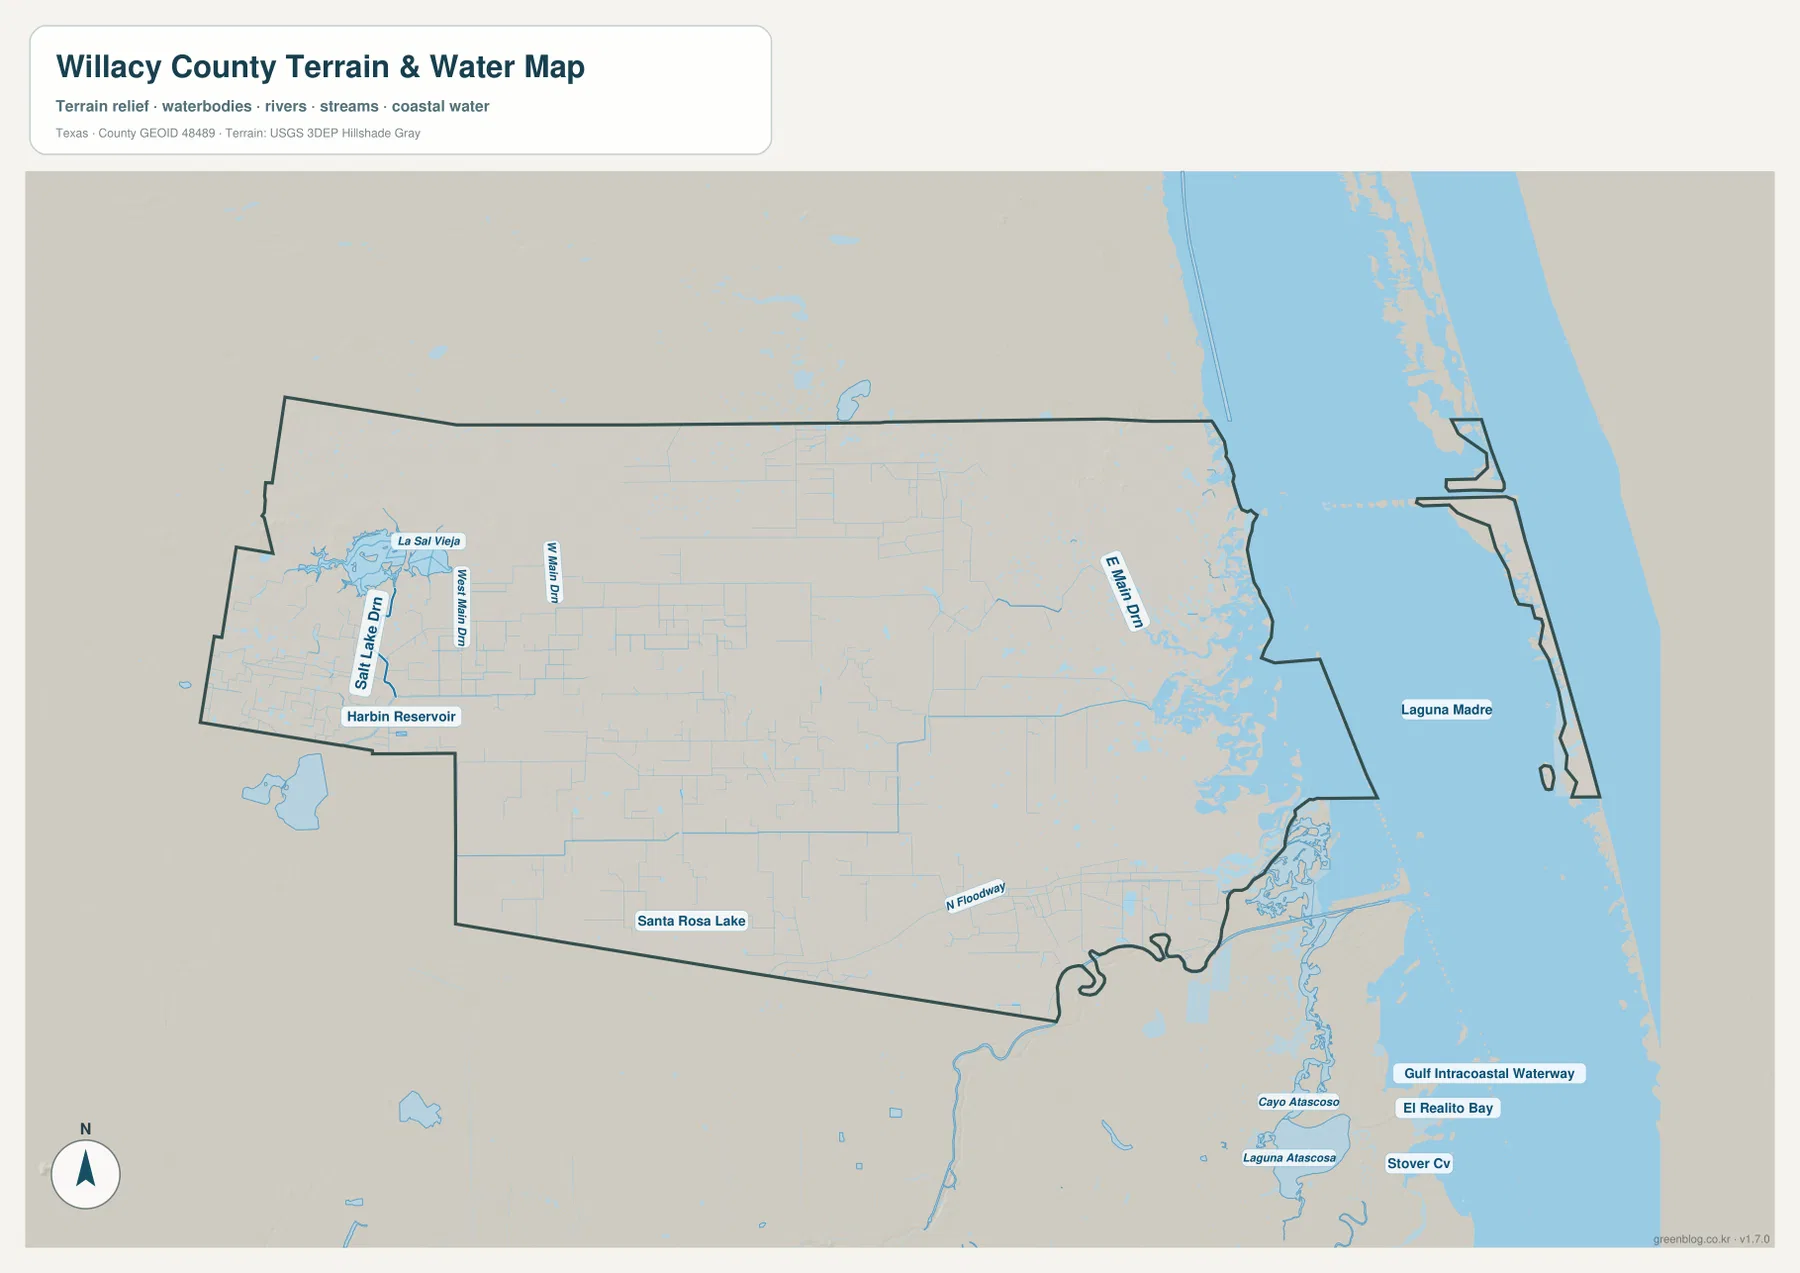
This layer is intended for geographic water and terrain reference rather than navigation, water-depth decisions, flood analysis, parcel boundaries, or current drainage-system operations. Its main value here is to show how straight interior drainage channels differ from the much broader and more irregular coastal water around Laguna Madre and Port Mansfield.
Elevation is extremely low, falling from the west toward Laguna Madre
The elevation map reports an actual range of about -1 to 27 meters and a mean elevation of 7 meters. Even within that small range, the color pattern is clear. Brown and tan higher ground appears across the west and northwest, while green lower terrain spreads across the center-east and dominates the Laguna Madre side and narrow coastal strip.
Small areas of higher relief are visible in the northwest, including terrain around the La Sal Vieja side. Moving east from Raymondville, the surface becomes progressively lower and flatter. The Santa Monica and southeastern interior are also low, and the coast-facing edge contains some of the lowest terrain on the map. The county is therefore best described as very low overall but still showing a meaningful west-to-east elevation gradient.
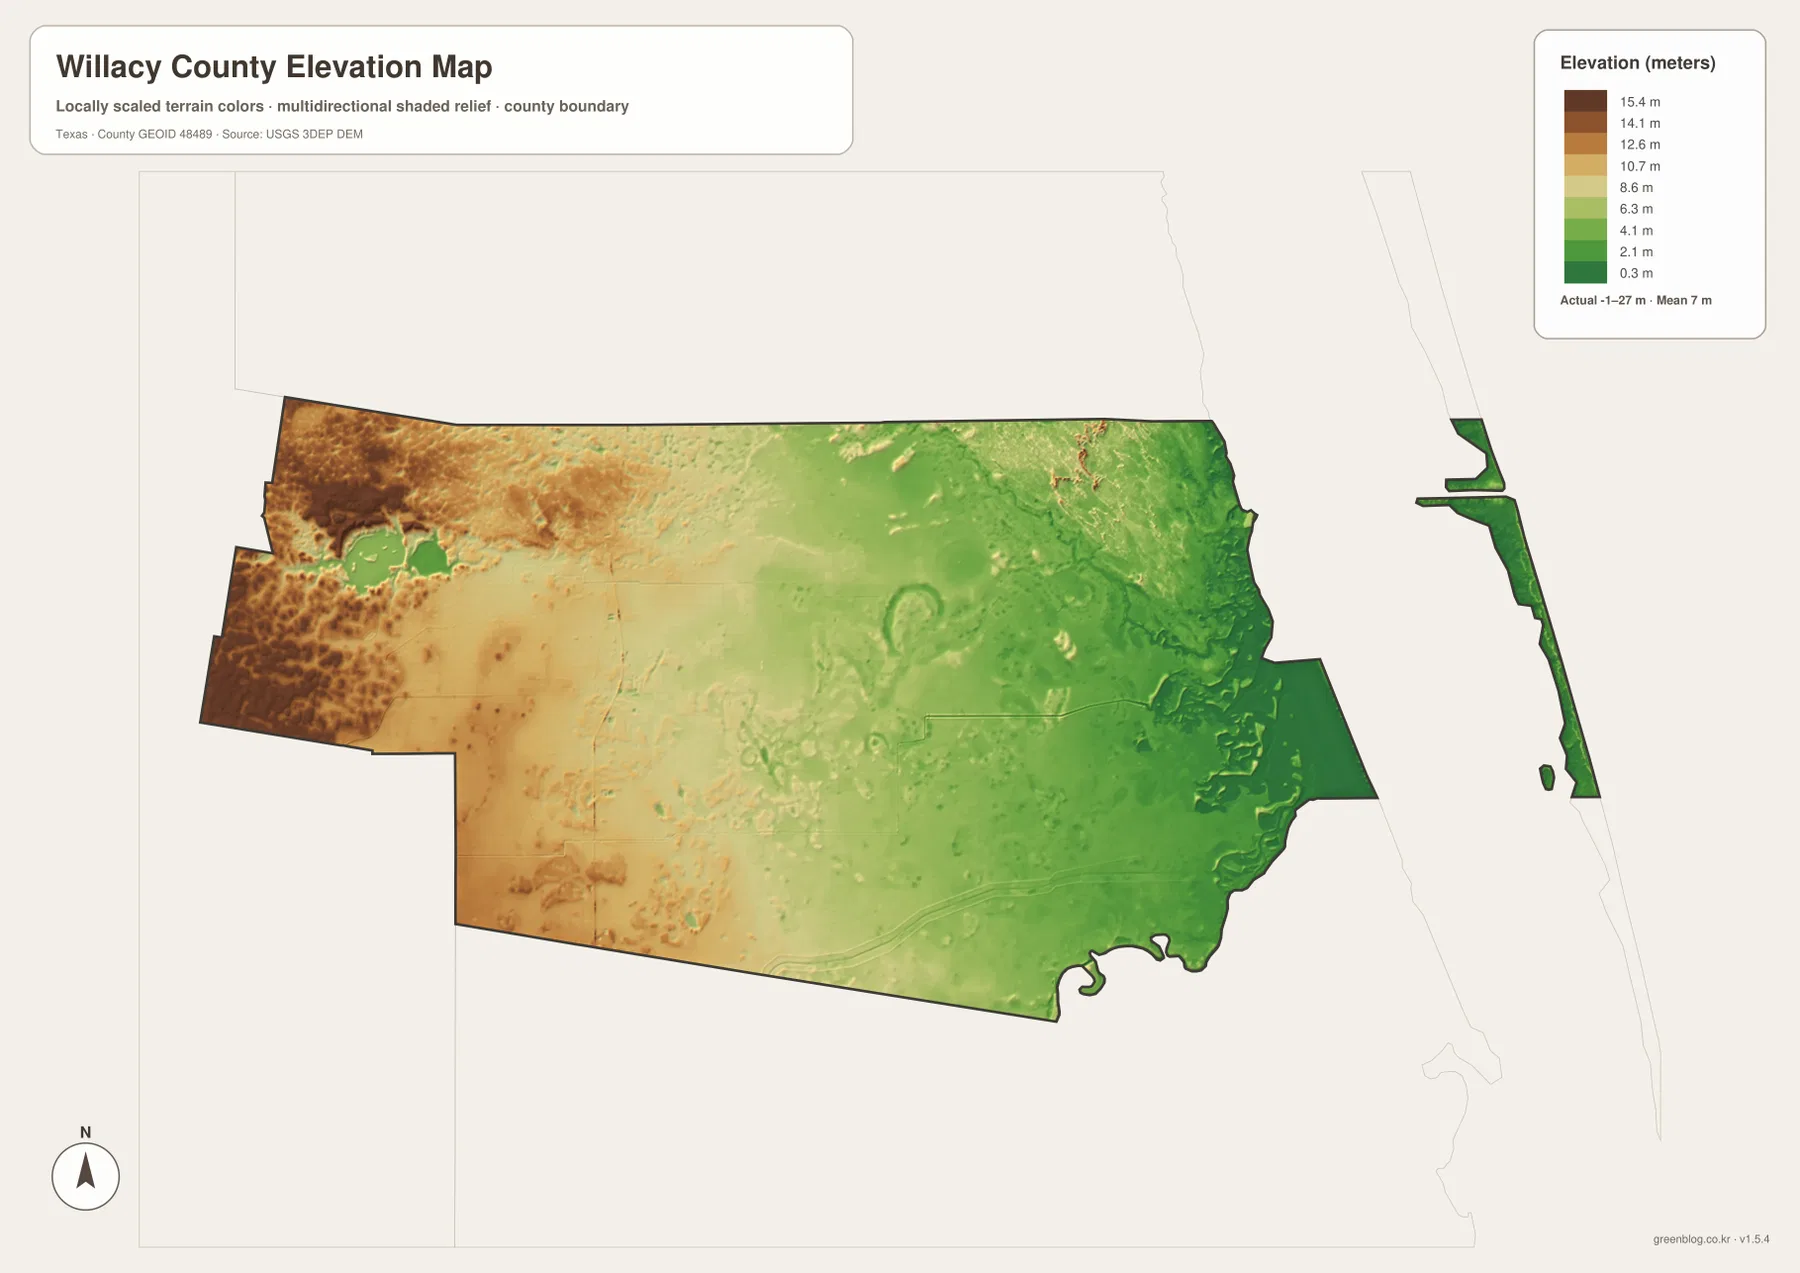
This countywide elevation surface is designed for broad terrain comparison rather than parcel surveying, engineering, or construction design. It is useful for seeing why the western interior stands slightly higher, why drainage channels are so widespread across the flat middle, and why the Port Mansfield and Laguna Madre side is especially low. Exact site elevation should be checked with detailed source data or a local survey.
Choose the map by whether inland towns, coastal water, drainage, or relief matters most
Use the county reference map when Raymondville, Lyford, Sebastian, San Perlita, Port Mansfield, road labels, and the county boundary need to appear together. The ranked-city view is cleaner for comparing Raymondville, Lyford, and San Perlita. The terrain-and-water layer is the best place to locate Laguna Madre, La Sal Vieja, Harbin Reservoir, and the major drains, while the elevation map makes the higher western interior and lower coastal side easiest to compare.
The downloadable ZIP contains four separate high-resolution A3 JPG files for Willacy County: county reference, ranked city, terrain and water, and elevation. You can inspect the lighter WebP versions in the article first and then use the larger JPG files for printing, classroom material, presentations, coastal-reference material, or personal projects.
Frequently Asked Questions
Where is Port Mansfield compared with Raymondville?
Port Mansfield is far east of Raymondville on the Laguna Madre coast. Route 186 continues east past the San Perlita direction and provides the clearest road reference between the inland county center and the coast.
What makes the Willacy County water map unusual?
Instead of one dominant inland river, the map shows Laguna Madre and the Gulf Intracoastal Waterway on the coast plus numerous straight interior drains. La Sal Vieja, Harbin Reservoir, and Santa Rosa Lake add smaller inland water references.
What elevation range is shown for Willacy County?
The supplied elevation map states an actual range of about -1 to 27 meters and a mean elevation of 7 meters. The west and northwest are relatively higher, while the eastern and coastal parts are lower.
Map File Information
The ZIP contains the four Willacy County maps in high-resolution A3 JPG format.
- Included Versions: County reference, ranked city, terrain and water, elevation
- Included Files: 4 A3 JPG maps
Related Maps
Sources and data references
Roads, settlement locations, and the Willacy County boundary can be cross-checked with the U.S. Census Bureau TIGER/Line Shapefiles. Laguna Madre, inland water bodies, and drainage features can be compared with USGS National Hydrography, while terrain height data are available through the USGS 3D Elevation Program. For coastal channel and navigation-chart context around Port Mansfield, NOAA Office of Coast Survey provides official chart resources. City index values and the -1–27 meter elevation range described above are based on the Willacy County maps supplied in this package.
Green Map creates custom-edited map images using open geographic data sources such as geoBoundaries, Natural Earth, OpenStreetMap, and government open data.
These maps are edited visual materials, not raw data files, and are provided for education, documents, presentations, and graphic reference.