Peach County sits in central Georgia with Fort Valley as the county seat and Byron forming a second major city area toward the northeast. You can download all four high-resolution A3 JPG maps together in one ZIP from the Map File Information box below; the WEBP images in the article are lighter previews for on-page viewing. The set covers the county boundary and main roads, the positions of Fort Valley and Byron, named creeks and small water features, and the rise and fall of the terrain.
The county has a long southwest-to-northeast shape rather than a compact square outline. Fort Valley lies in the western half, where several roads converge, while Byron sits much closer to the northeastern end. Between them is a broad stretch of rural land crossed by many small streams. That layout matters because a simple city list can make Fort Valley and Byron sound like neighboring centers, but the maps show that each occupies a different part of the county and connects to a different set of surrounding places.
These are general reference maps, not parcel, survey, flood-hazard, or turn-by-turn navigation products. They are best used to understand where the county boundary runs, which roads provide the main orientation, where Fort Valley and Byron sit, how creek valleys cut through the interior, and which parts of the county are relatively high or low. Reading the maps together gives a more complete picture than relying on one layer alone.
Table of Contents
Fort Valley, Byron, and the roads that organize the county
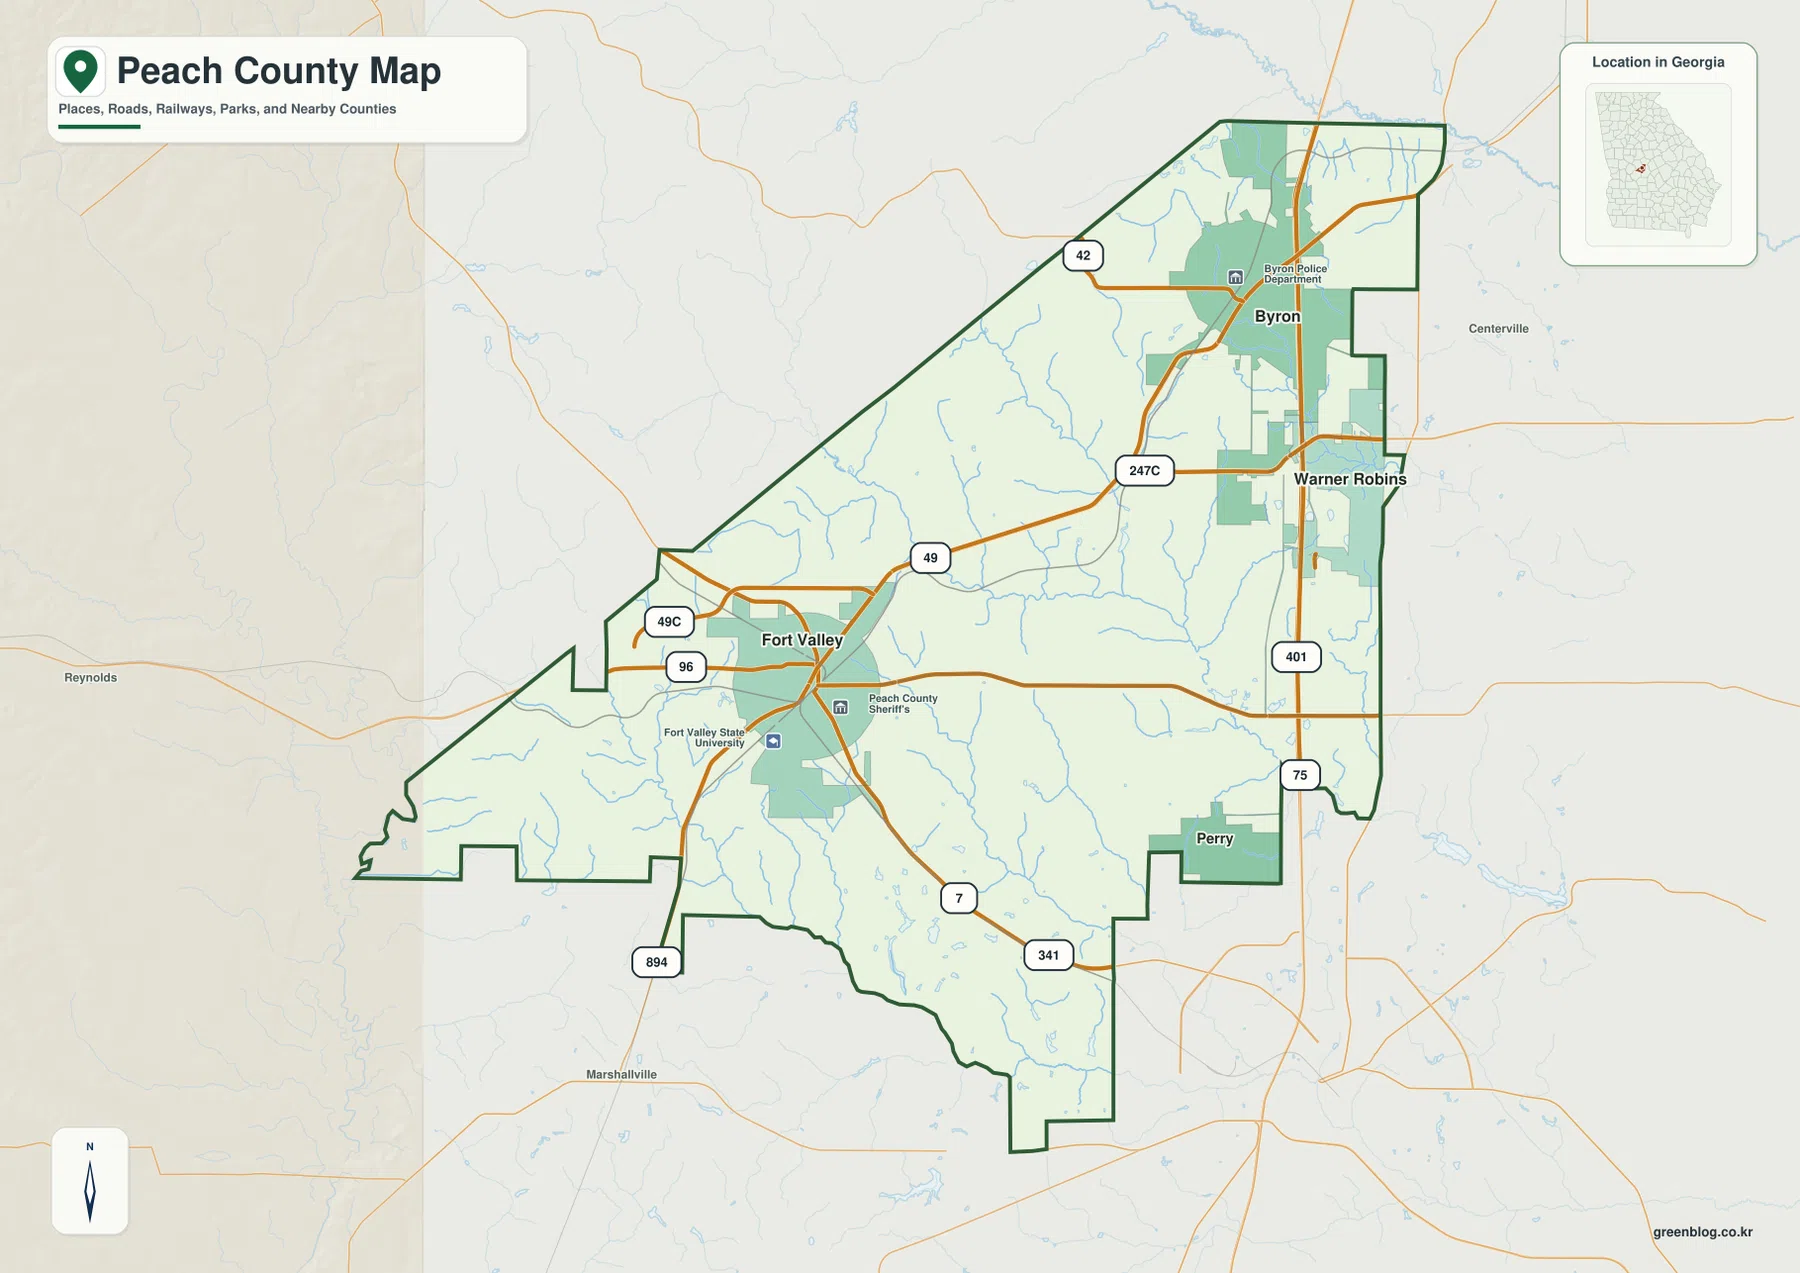
Fort Valley is the strongest landmark on the county reference map. Its developed area occupies part of the west-central county, and the map also marks Fort Valley State University and a Peach County Sheriff’s location nearby. Route 49 approaches and leaves the city on an east-west to northeast alignment, Route 96 crosses the Fort Valley area, and U.S. 341 continues southward from the city. Together, those roads make Fort Valley the easiest place to use as a starting point when reading the rest of the map.
Byron appears well to the northeast as a separate developed cluster. Route 42 is shown near the city, and the eastern side of the county is close to the north-south Interstate 75 corridor. Warner Robins and Perry appear near the eastern and southeastern side as outside orientation points, helping place Peach County within the larger central Georgia road network. The county line along the east is also irregular, with several bends and inset sections rather than a single straight edge.
The road map is useful precisely because it does not reduce the county to its two city names. Thin blue stream lines appear throughout the land between Fort Valley and Byron, while developed areas remain concentrated around the named cities and the eastern edge. This makes it clear that the middle of Peach County is not one continuous urban strip. For an exact driving route or street address, a navigation map is still necessary, but this county view quickly explains which roads and places provide the main geographic frame.
Two city centers in different parts of Peach County
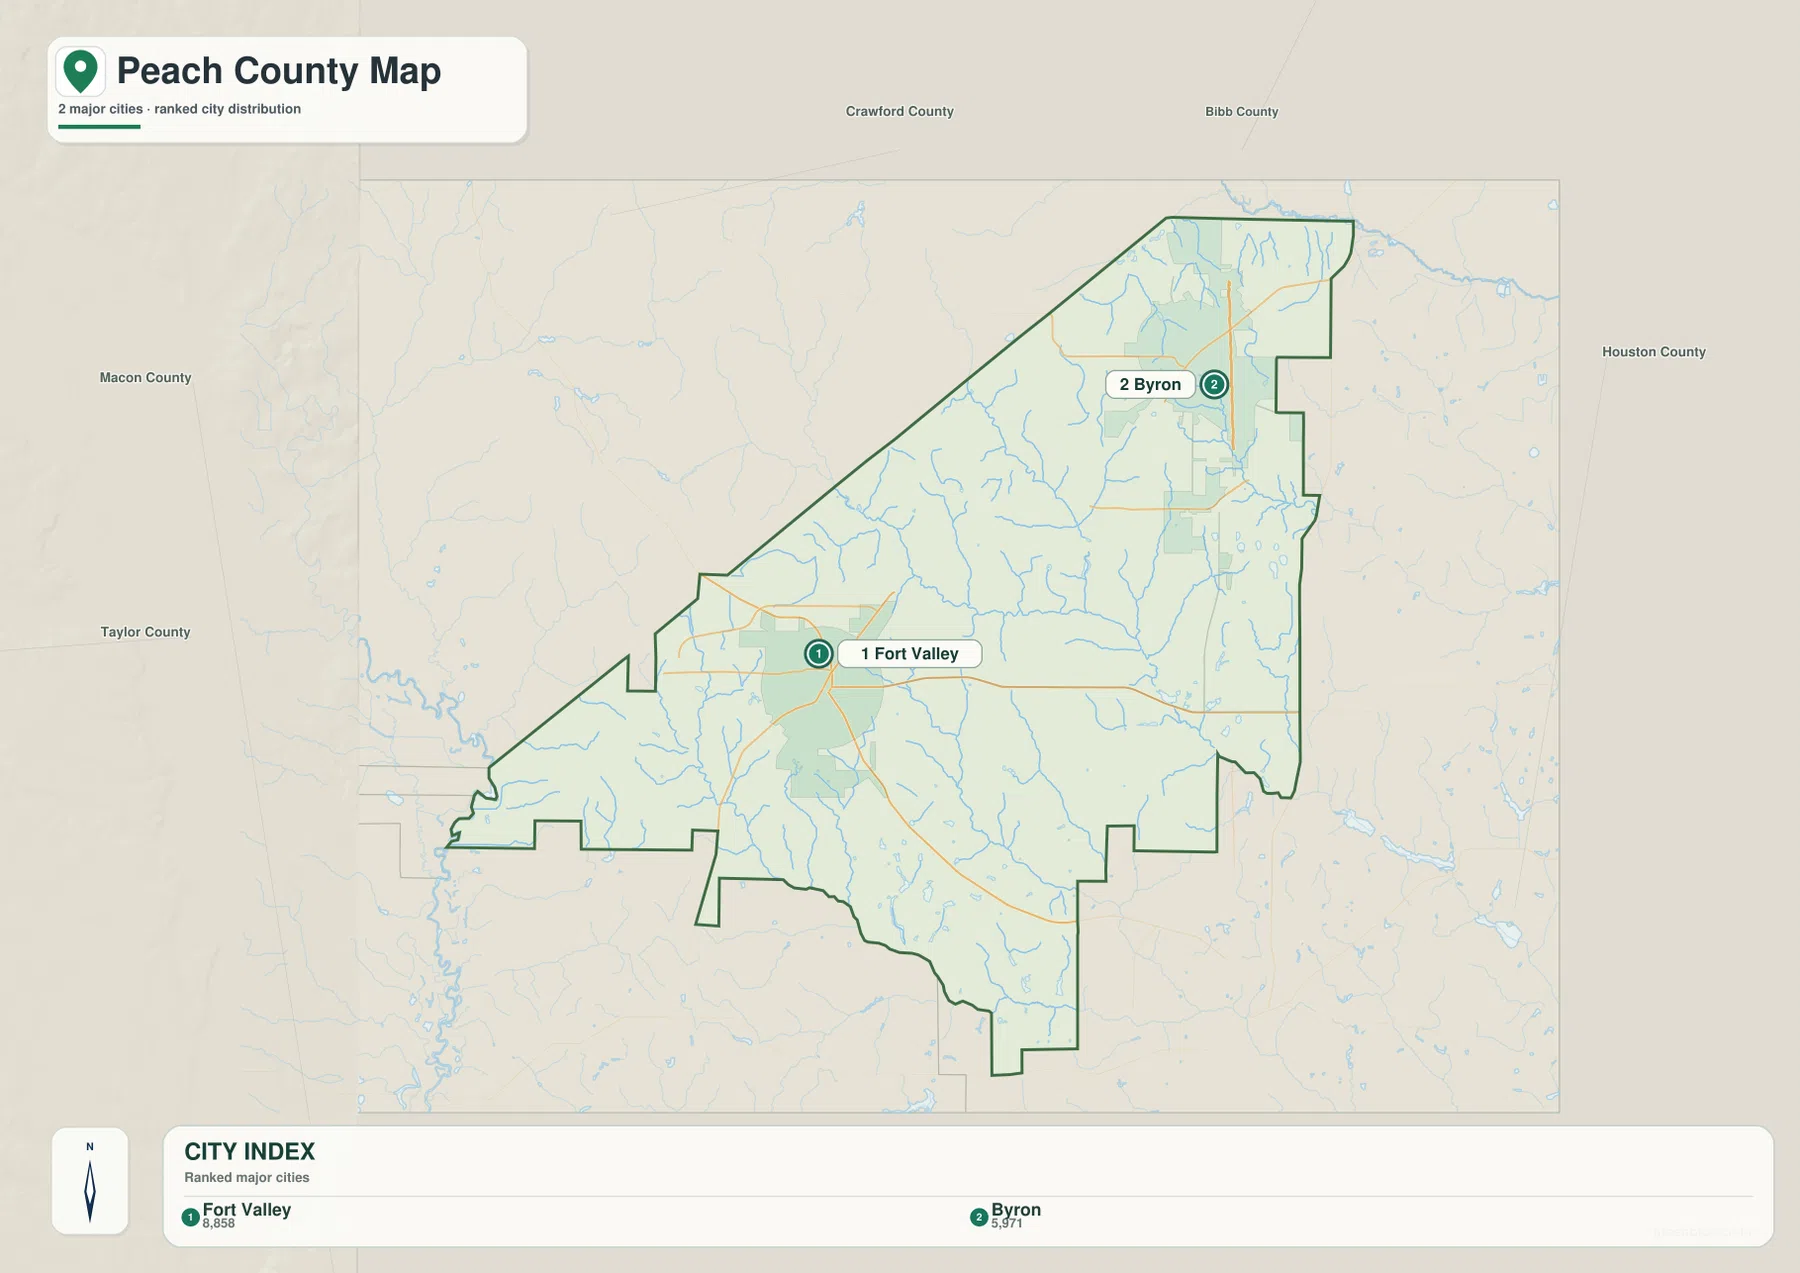
The city distribution map strips away most of the road detail and makes the separation between Fort Valley and Byron easier to see. Fort Valley is marked as the first major city in the west-central part of the county, while Byron is marked as the second in the northeast. The two points are far enough apart that they serve different ends of the county rather than forming one compact pair. Fort Valley is also the county seat, so its position is important for understanding the administrative center as well as the road network.
Names outside the boundary add useful regional context. Crawford County is shown to the north, Bibb County to the northeast, Houston County to the east, Macon County to the west, and Taylor County toward the southwest. The map therefore explains why Byron feels more connected to the northeastern side of central Georgia, while Fort Valley sits closer to the western and southwestern side of the county. The surrounding labels are not meant as a complete adjacency table; they are orientation points included on the map.
The city index also lists Fort Valley and Byron in ranked order, but the main value of this map is not the ranking itself. Its strength is the simple visual relationship between the two places. When paired with the county reference map, it becomes easy to see that Fort Valley is associated with the Routes 49, 96, and 341 area, while Byron lies nearer the eastern transportation corridor. This simpler view works well in classroom material, presentations, or local orientation where too much road detail would distract from the basic location of the cities.
Mule Creek, Mossy Creek, Bay Creek, and a network of small valleys
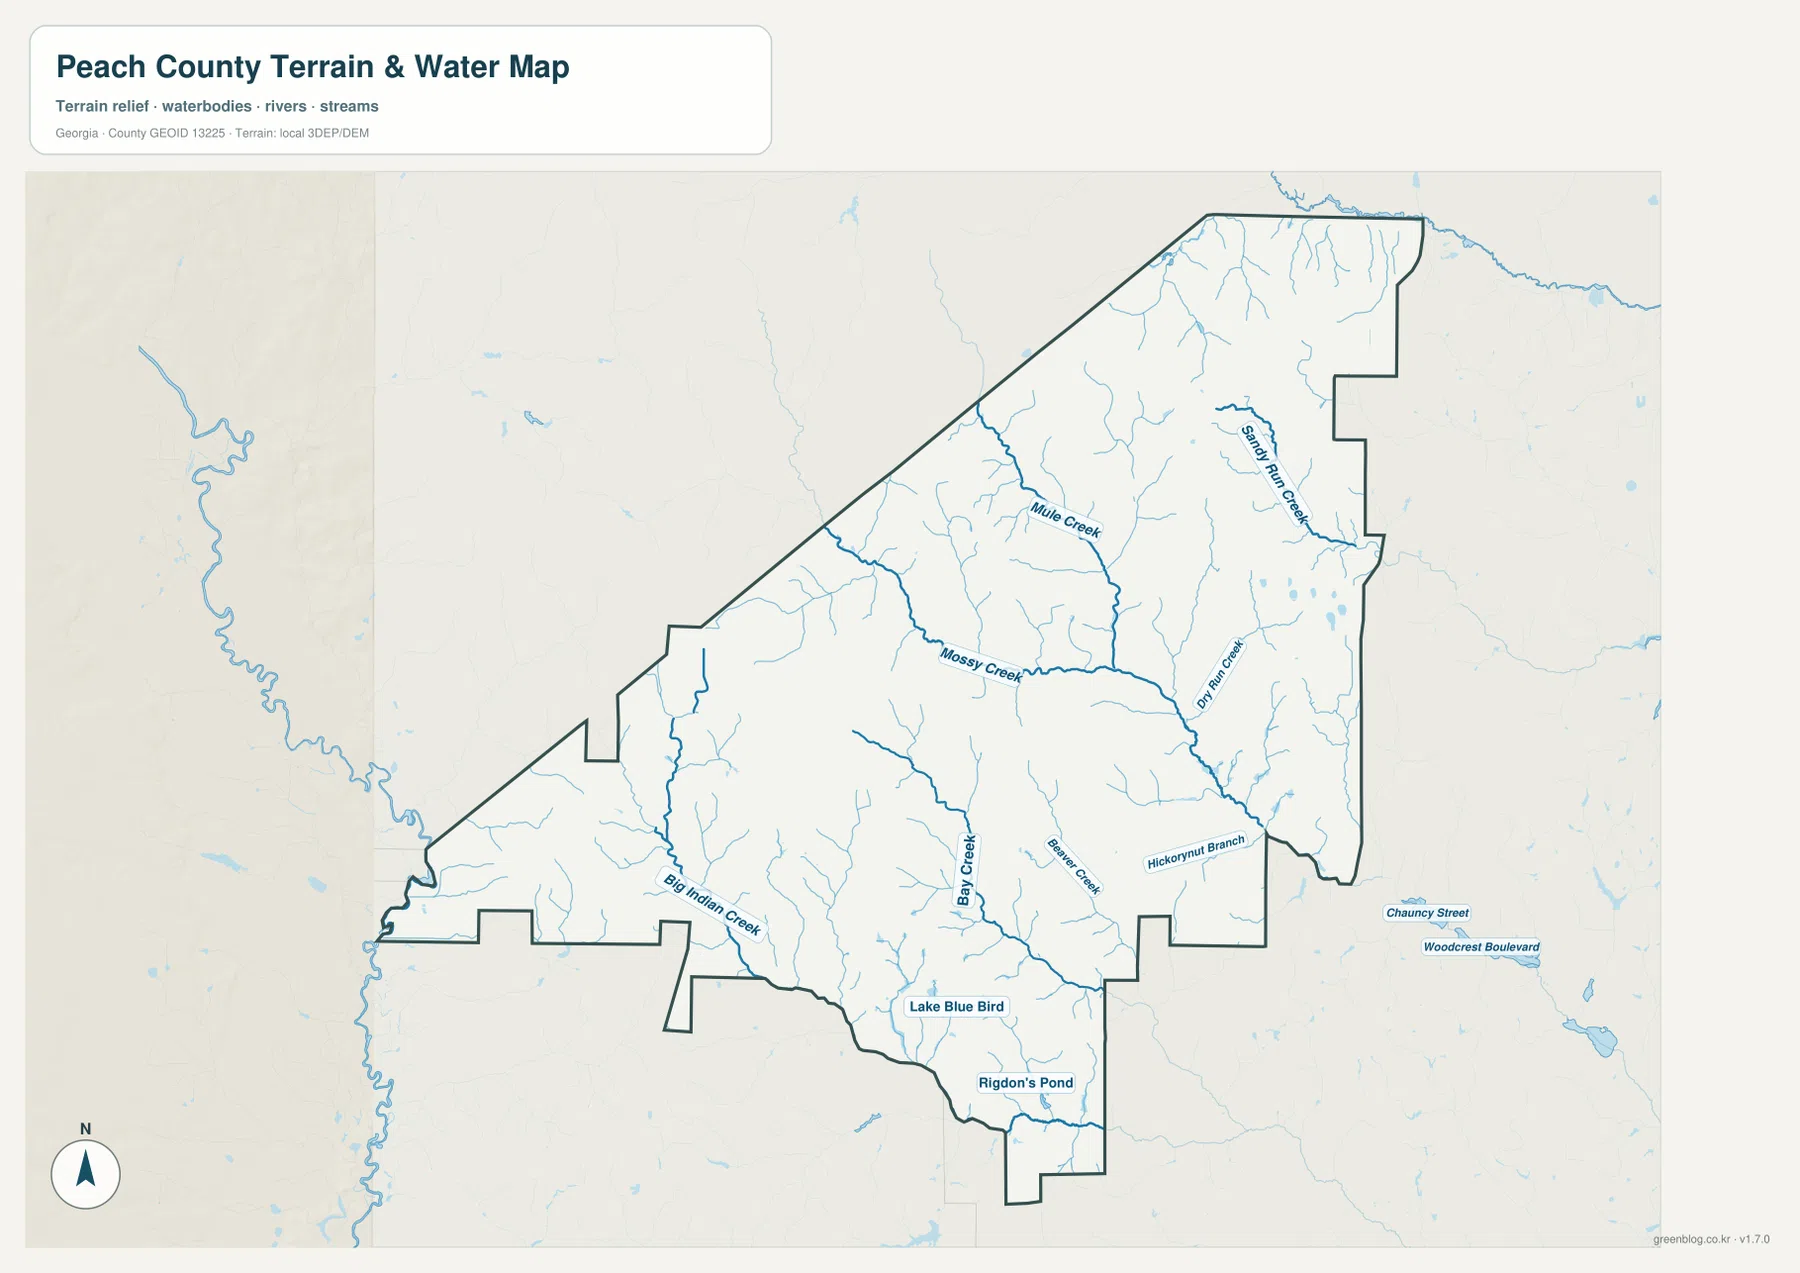
The water map reveals a side of Peach County that is easy to miss on the road view. Instead of one dominant river, the county contains many smaller creeks that branch through the interior. Mule Creek is labeled across the north-central area, with Mossy Creek extending through the middle portion of the county. Dry Run Creek appears farther east, while Bay Creek runs southward through the central-southern area. Their tributaries create a fine network of blue lines across much of the map.
Other named features help distinguish the southern and western parts of the county. Big Indian Creek is labeled near the southwest, and Hickorynut Branch appears in the southeast. Lake Blue Bird and Rigdon’s Pond are marked farther south as small named water bodies. These features are not a complete inventory of every pond or seasonal channel, but they give the reader practical landmarks for matching the water map to the terrain and county outline.
The shaded relief behind the streams is especially useful. Creek lines often occupy lower, smoother corridors, while short ridges rise on either side. That relationship becomes even clearer on the elevation map, where many of the same drainage corridors appear as green low areas. The water map should not be interpreted as a flood zone, property boundary, water-quality map, or navigation chart; it is a geographic reference for the location of mapped streams and small water bodies.
Rolling relief from about 86 to 173 meters
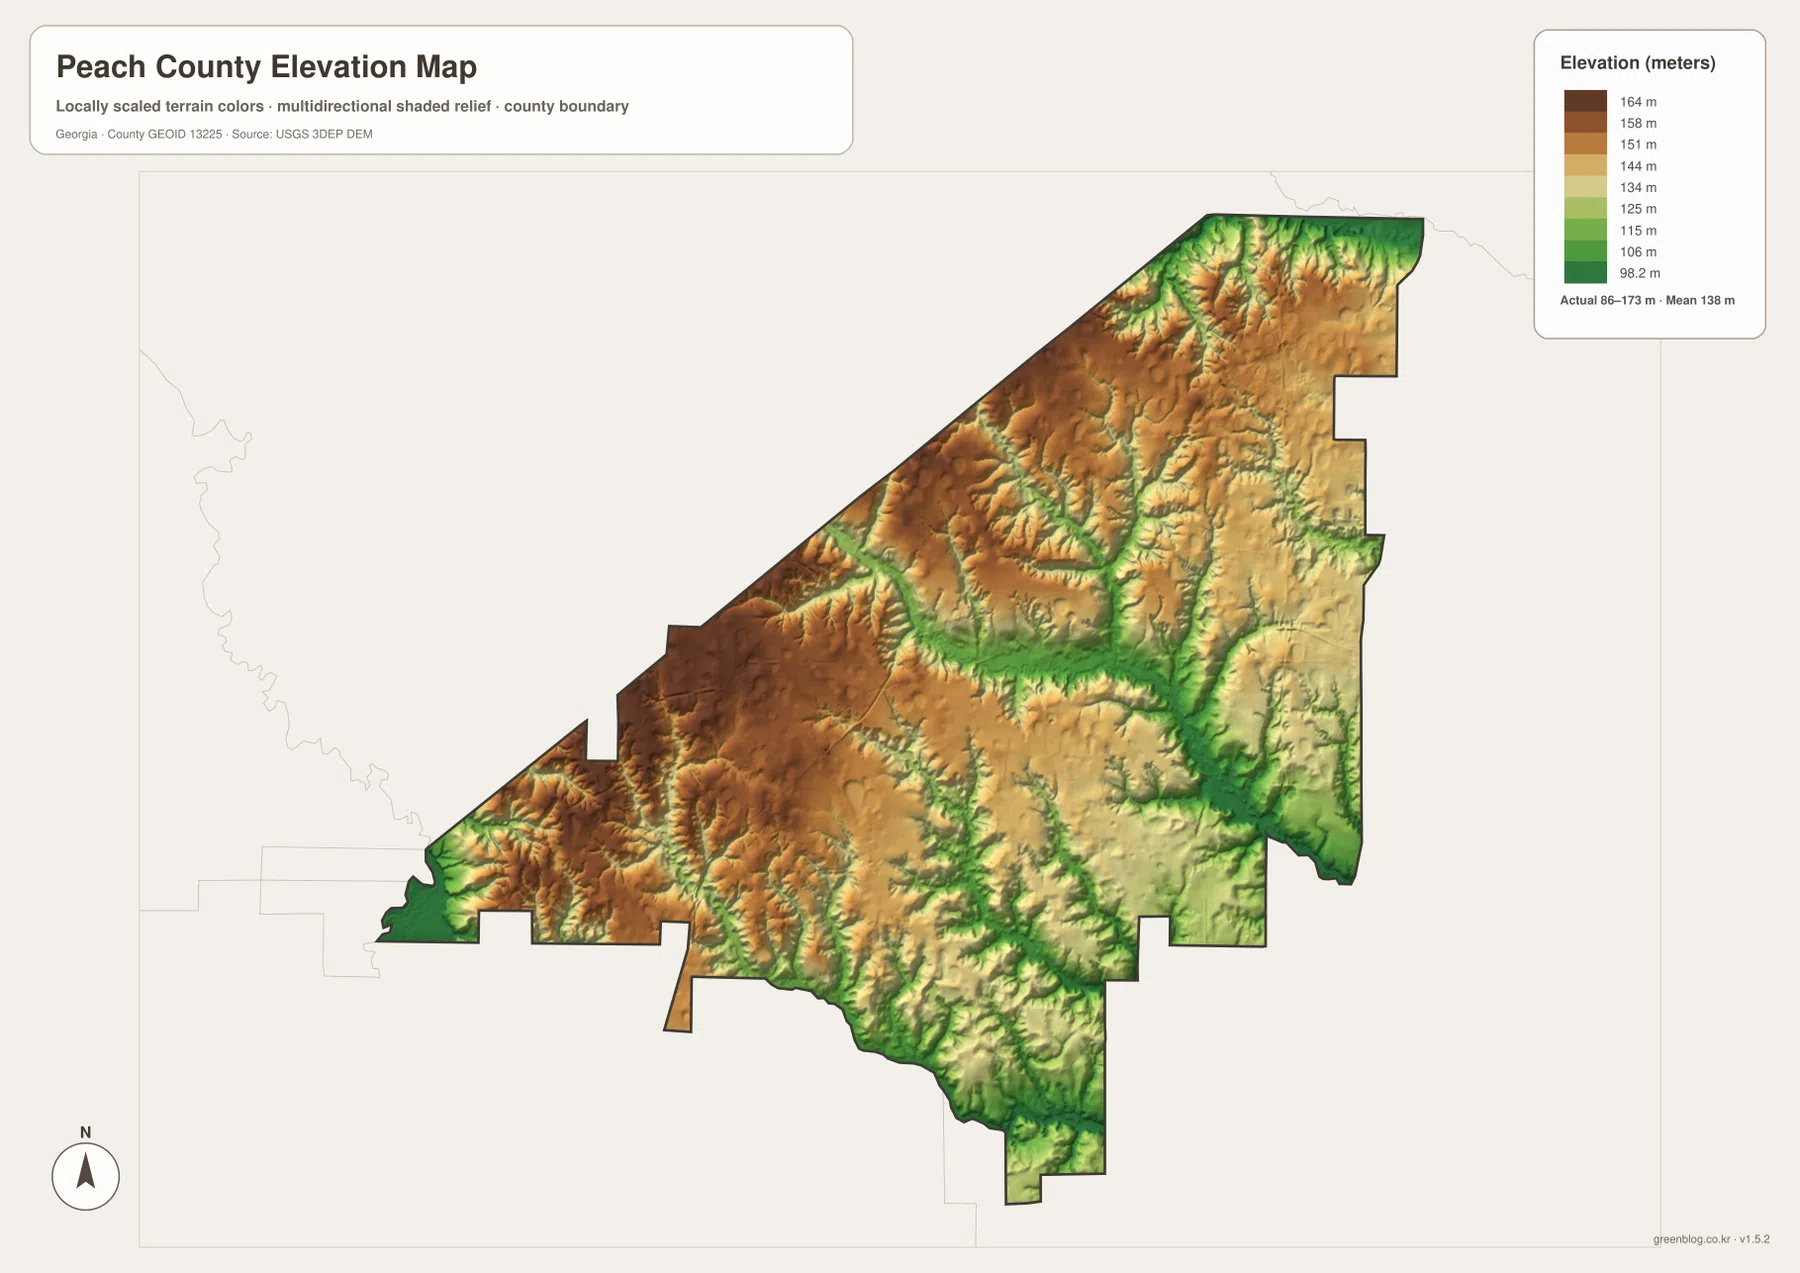
The elevation map gives an actual county-wide range of roughly 86 to 173 meters, with a mean elevation of about 138 meters. Peach County is therefore not a mountainous county, yet the relief is strong enough to form visible ridges and valleys. Brown and orange areas mark higher rolling ground through much of the western and central interior, while green corridors trace lower terrain along streams and toward parts of the east and south.
North of the county center, the shaded surface breaks into many short ridges separated by narrow drainage lines. In the northeast, lower green channels branch between slightly higher strips of land. Bay Creek also follows a lower corridor south of the center, and several other green valleys match the stream network shown on the water map. The total difference of more than 80 meters is modest on a regional scale, but within a small county it is enough to shape the direction of local drainage and produce a noticeably rolling landscape.
This map is intended for relative comparison, not site engineering. It can answer broad questions such as which parts of the county are higher, where the lower creek valleys lie, and how the drainage map relates to the terrain. It should not be used as a substitute for survey elevations, construction-grade measurements, or a precise elevation value for a specific parcel. For those purposes, a dedicated official or surveyed dataset is required.
What becomes clearer when the four views are compared
Using the four maps together shows why Peach County cannot be described only by Fort Valley, Byron, or the Interstate 75 corridor. Fort Valley anchors the west-central road network and county administration, while Byron occupies the northeast near a different transportation setting. Between and around them, a dense set of small creeks crosses rolling ground. The terrain map explains why those streams follow branching valleys, and the city map keeps the broader settlement pattern easy to understand without the extra detail.
The existing county material identifies Peach County as having been established in 1924 and notes Fort Valley State University, peach production, food processing, and logistics as parts of its local context. Those subjects help explain the county’s identity, but the maps here are not agricultural production or economic-statistics maps. Their purpose is more direct: they show where Fort Valley and Byron are located, how the main roads cross the county, where named creeks and ponds appear, and how the land rises and falls across the county boundary.
Choosing a map depends on the task. The county reference map is best for roads, boundary shape, and nearby place names. The city map is cleaner when the goal is simply to show Fort Valley and Byron. The water map is more useful for Mule Creek, Mossy Creek, Bay Creek, Big Indian Creek, and the smaller drainage features, while the elevation map makes the 86–173 meter relief understandable at a glance. A report, lesson, presentation, or local research project can therefore use the view that matches the question instead of crowding every detail onto one image.
Frequently Asked Questions
Where are Fort Valley and Byron within Peach County?
Fort Valley is the county seat and lies in the west-central part of Peach County. Byron is farther northeast, closer to the eastern transportation corridor. The city map makes the separation especially clear and also shows the directions of nearby Crawford, Bibb, Houston, Macon, and Taylor counties.
How much elevation difference does the Peach County map show?
The elevation map states an actual range of about 86 to 173 meters, with a mean near 138 meters. Higher rolling ground is most visible in brown and orange areas, while lower green corridors commonly match creek valleys. The map is designed for county-scale comparison rather than precise survey elevations for individual properties.
Does the water map show flood zones or legal property boundaries?
No. The water map is a reference for mapped streams and small water bodies such as Mule Creek, Mossy Creek, Bay Creek, Big Indian Creek, Lake Blue Bird, and Rigdon’s Pond. It does not define flood risk, water quality, ownership, or legal parcel boundaries, so those questions require the appropriate official datasets.
Map File Information
The WEBP images in the article are lightweight previews. The download ZIP contains four high-resolution A3 JPG files for Peach County: the county reference map, city map, water and terrain map, and elevation map.
- Included Files: County map, city map, water and terrain map, elevation map
- Printable Size: 3638×2572 px per JPG
- File Type: One ZIP containing four JPG files
Related Maps
Sources and references
- U.S. Census Bureau QuickFacts for Peach County
- New Georgia Encyclopedia: Peach County
- U.S. Census Bureau TIGER/Line boundary data
- USGS National Hydrography
- USGS 3D Elevation Program
Green Map creates custom-edited map images using open geographic data sources such as geoBoundaries, Natural Earth, OpenStreetMap, and government open data. These maps are edited visual materials, not raw data files, and are provided for education, documents, presentations, and graphic reference.