Pickens County sits in the hillier part of north Georgia, where Jasper provides the main civic reference point and a web of creeks cuts through the surrounding ridges. This page brings together a county reference map, a city map, a terrain-and-water map, and an elevation map so you can compare roads, settlements, drainage, and relief without forcing all of that information onto one crowded image. The four high-resolution A3 JPG maps are also available as a single ZIP download, making it easy to keep the larger files for printing, classroom use, presentations, or local reference.
Table of Contents
Jasper, Main Roads, and the Shape of the County
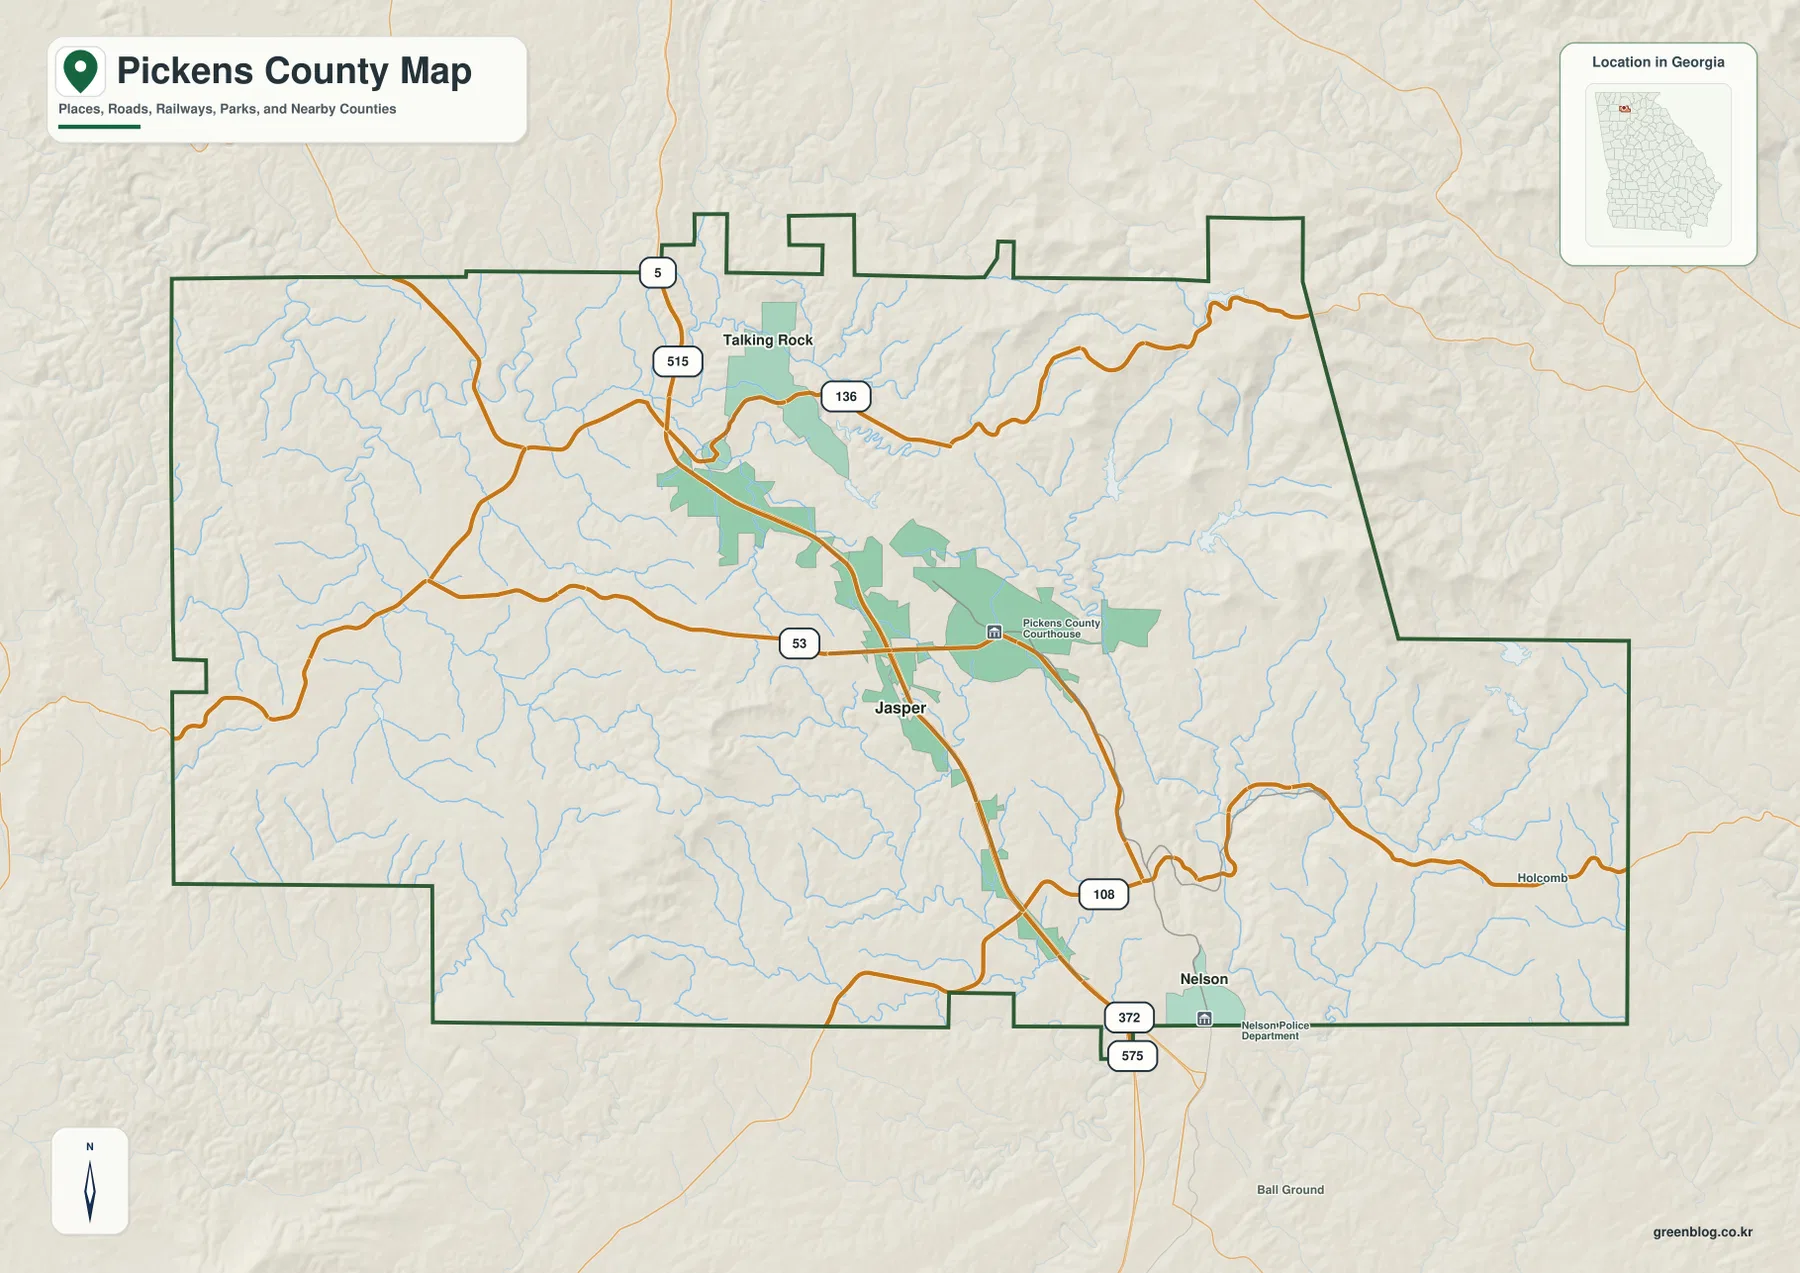
The county reference map puts Jasper near the center of the local road network. The Pickens County Courthouse is marked just east of the Jasper label, which makes the county seat easy to identify even before looking at the smaller communities. Talking Rock appears to the north, Nelson sits near the southern edge, and Holcomb is labeled on the eastern side. Labels outside the boundary provide wider north Georgia context, including Gilmer, Cherokee, Gordon, Bartow, Murray, and Dawson counties. Those surrounding names are useful for orientation, but the main purpose of the map is to show the Pickens County boundary and the places and routes inside it.
Several numbered routes stand out. Routes 5 and 515 run through the northern half and continue toward Jasper, while 53 crosses the county near Jasper in a more east-west direction. Route 136 extends across the northern part of the county, and 108 bends through the southeast side. The map also marks 372 and 575 near the Nelson area. Taken together, the roads show why Jasper functions as the most obvious reference point for travel within the county: multiple routes approach it from different directions, then split toward the smaller communities and mountain areas. This is not a turn-by-turn street map, so local roads and driveway access should be checked with a current navigation or transportation source when exact routing matters.
How Jasper and Talking Rock Appear on the City Map
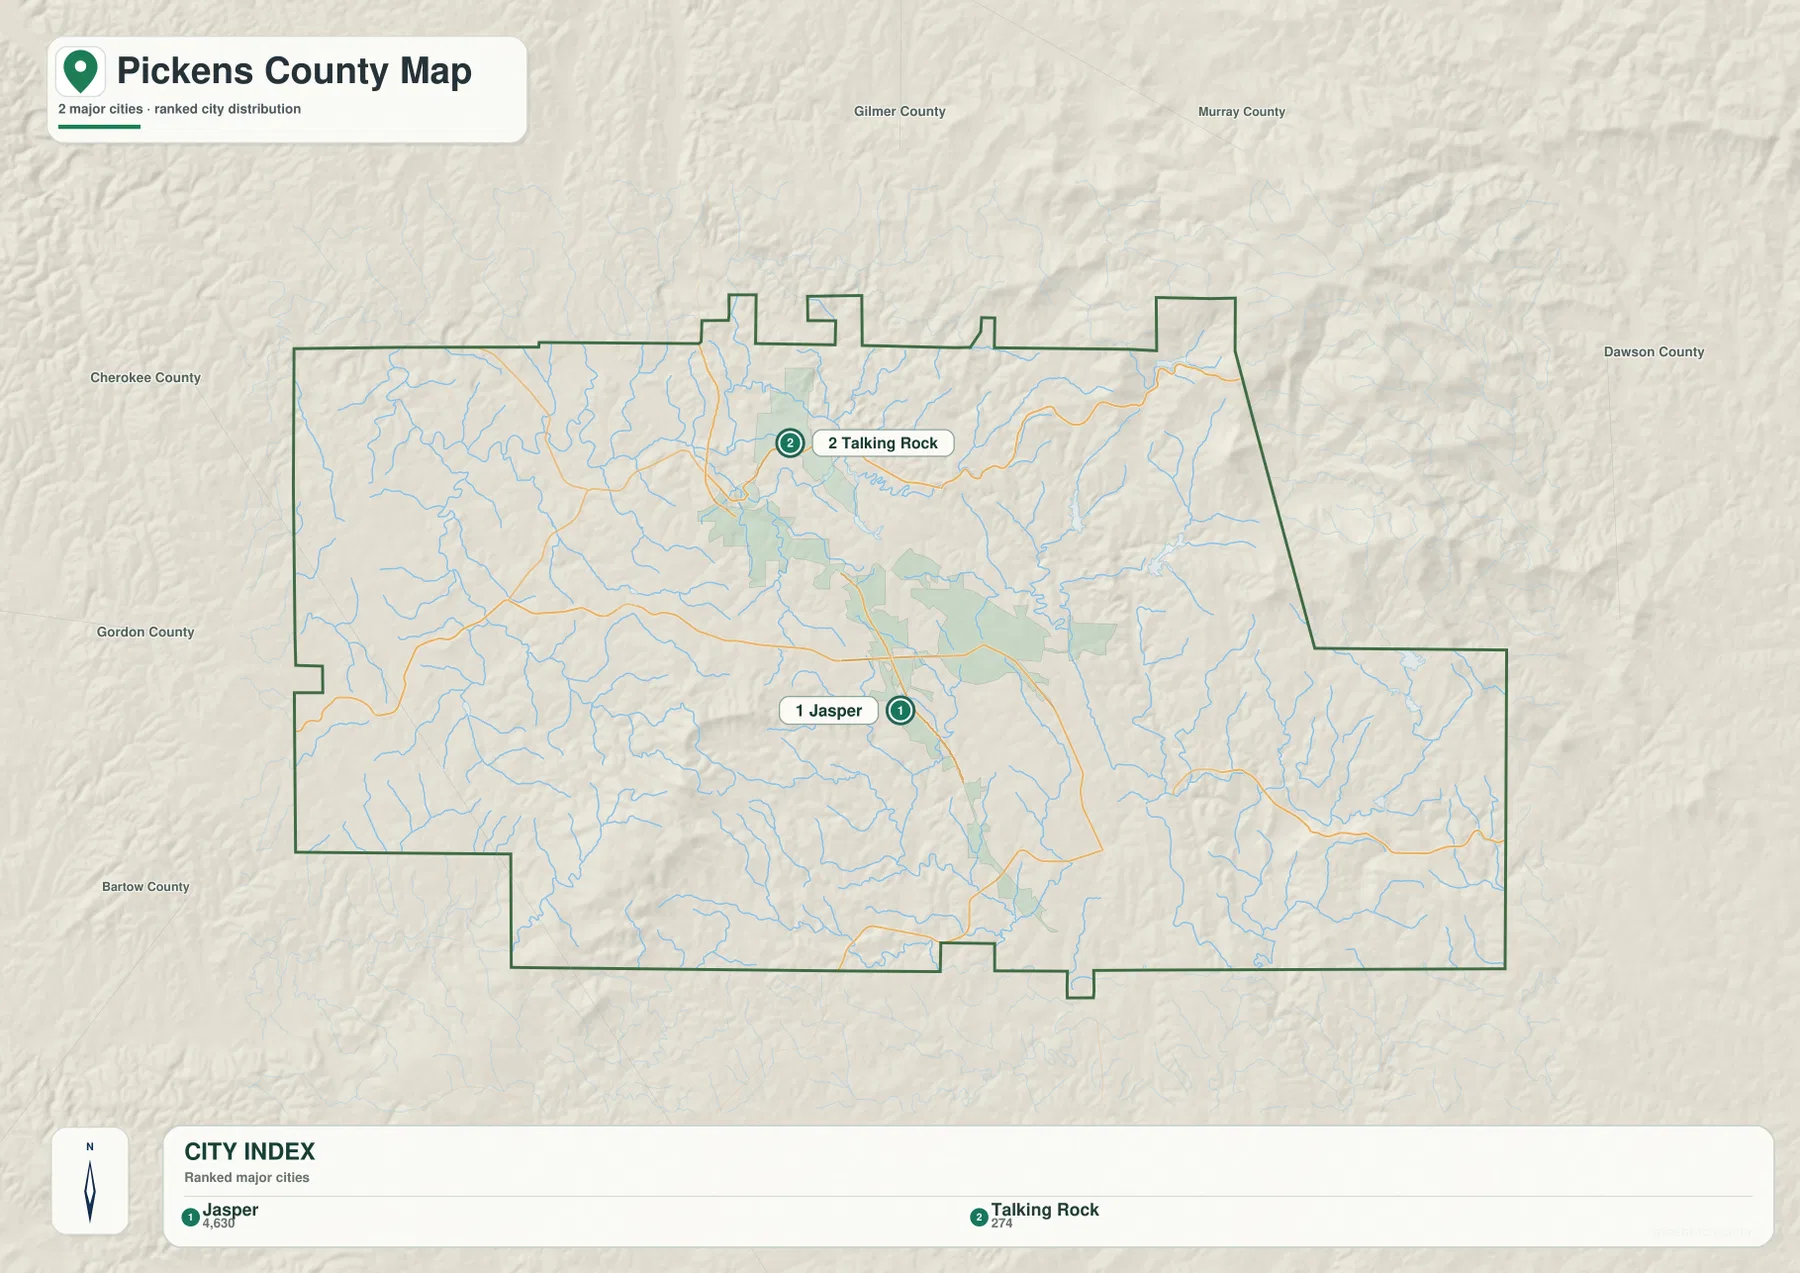
The city map intentionally simplifies the settlement pattern. Rather than labeling every named place, it ranks Jasper as the first major city reference and Talking Rock as the second. The city index printed on the map lists Jasper at 4,630 and Talking Rock at 274; those figures should be read as values used in this map’s city index rather than as a substitute for the latest population estimate. The numbered markers make the north-south relationship immediately clear. Jasper lies farther south along the main road corridor, while Talking Rock occupies a smaller northern position near the creek network.
This simplified view is especially helpful when the goal is orientation rather than a complete municipal inventory. Pickens County also has a strong marble history associated with Tate and the southern part of the county, and Nelson appears on the broader county reference map near the southern boundary. The city map, however, keeps its emphasis on Jasper and Talking Rock. That difference is worth noting because it prevents a common mistake: a city-distribution map is not necessarily a list of every incorporated or historic community. For local history, property research, or detailed addresses, the map works best as a starting point that can be paired with more specialized sources.
Talking Rock Creek, Tributaries, and Small Lakes
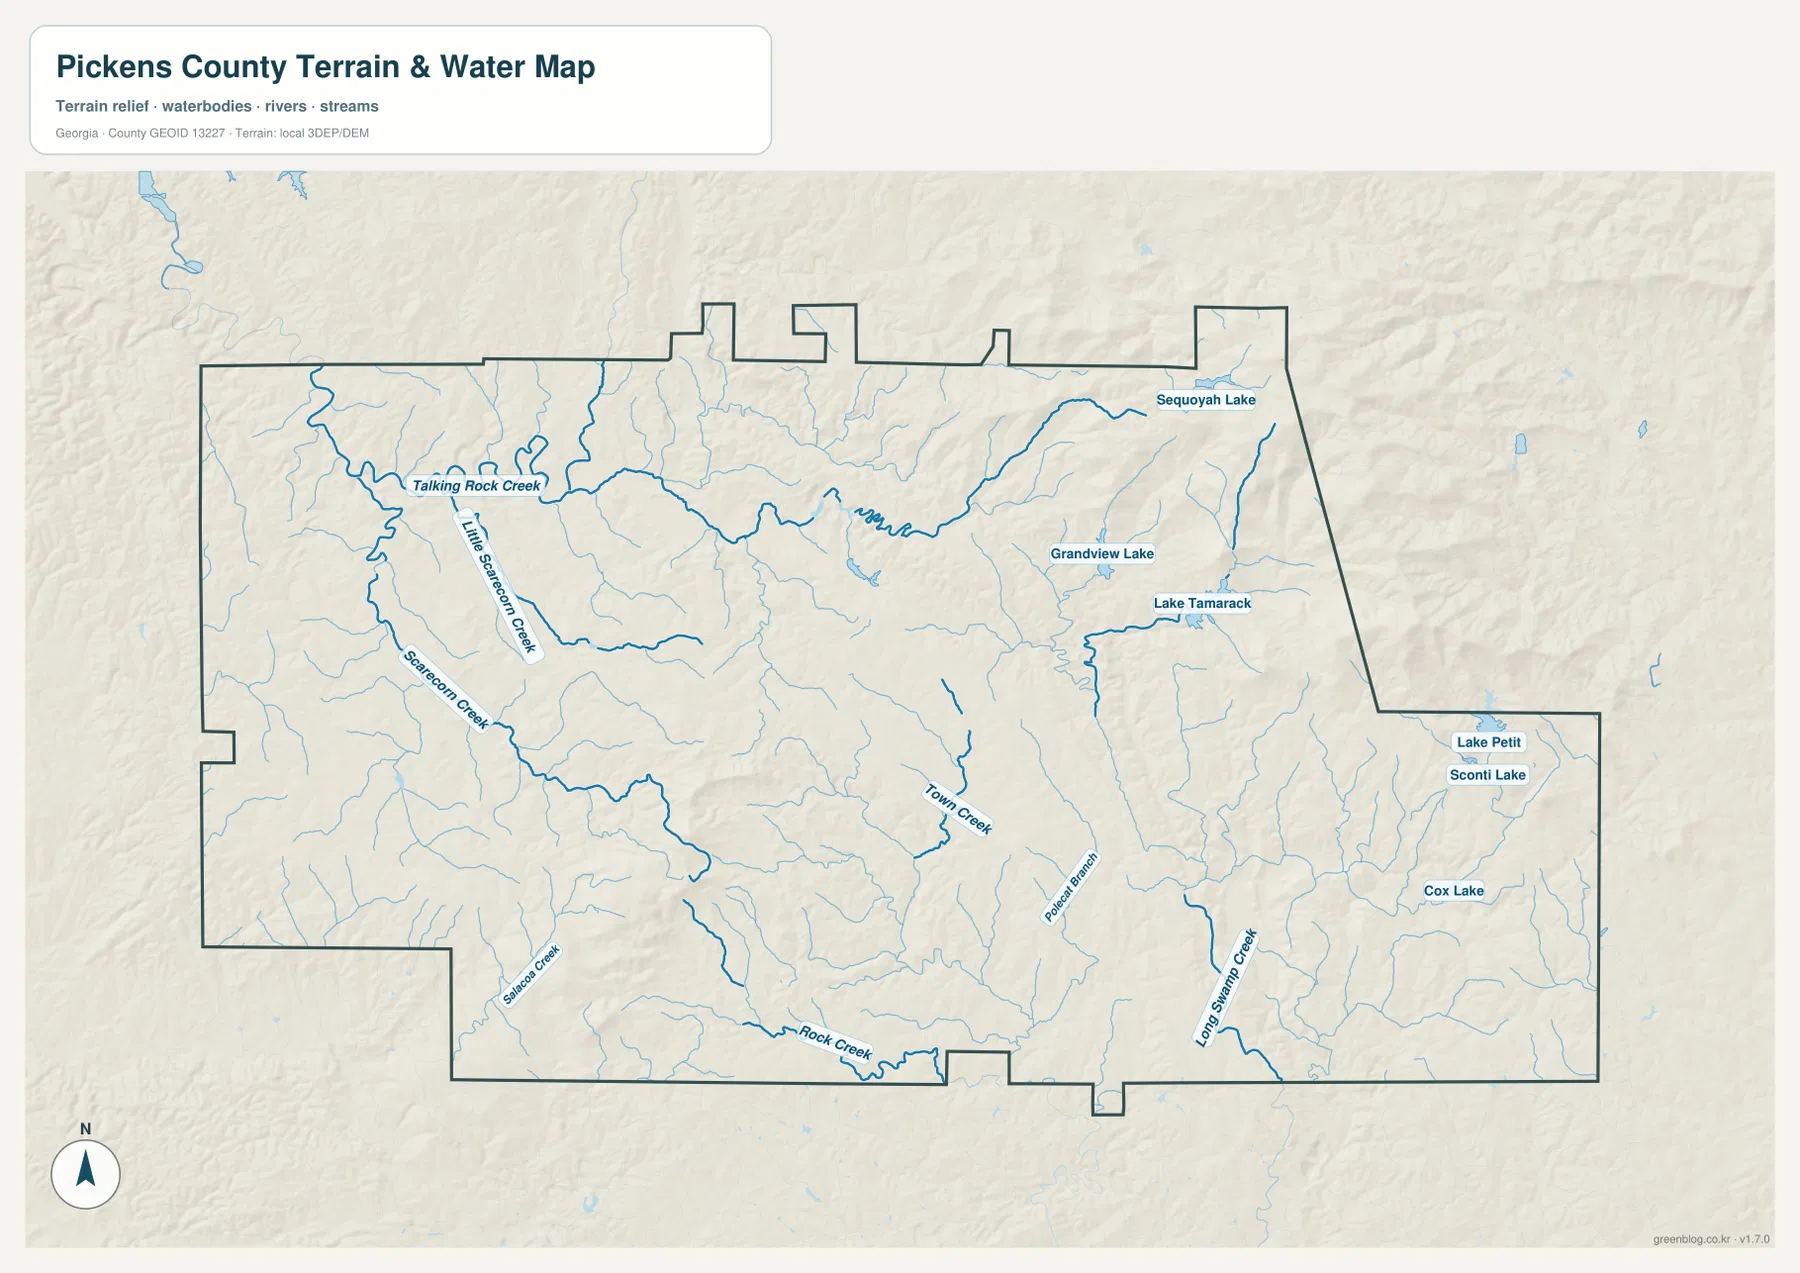
The terrain-and-water map reveals a county shaped by many smaller streams rather than one broad river cutting straight through the middle. Talking Rock Creek is the most prominent named stream in the northwest and north-central part of the map. Little Scarecorn Creek and Scarecorn Creek join the network farther west and southwest, while Town Creek appears nearer the middle. Rock Creek follows part of the southern area, and Long Swamp Creek is labeled in the southeast. Numerous unnamed tributaries branch away from these channels, which matches the deeply dissected hill terrain visible beneath the blue stream lines.
The eastern half also contains several named lakes and ponds. Sequoyah Lake is marked toward the northeast, Grandview Lake and Lake Tamarack sit farther south, and Lake Petit and Cox Lake appear on the east and southeast side. These water bodies are small compared with the county as a whole, but their labels help explain why a water-specific map can be more useful than the general reference map for outdoor orientation. The map does not show flood zones, public-access rules, water quality, or ownership. Anyone making a land-use, boating, or safety decision should consult the appropriate official source, but for basic geography it clearly shows where the creeks and lakes sit in relation to the county boundary.
Comparing the water map with the road map adds another layer of context. Roads often follow lower terrain or cross the stream network at practical points, while the smaller tributaries spread through areas where few major roads are labeled. Around Talking Rock, the stream system is especially noticeable. In the southeast, Long Swamp Creek follows a long valley that becomes even more obvious on the elevation map. This kind of cross-check is useful for students and local researchers because it turns a list of place names into a clearer picture of how terrain and drainage influence the county’s layout.
The High Northeastern Ridges Stand Apart
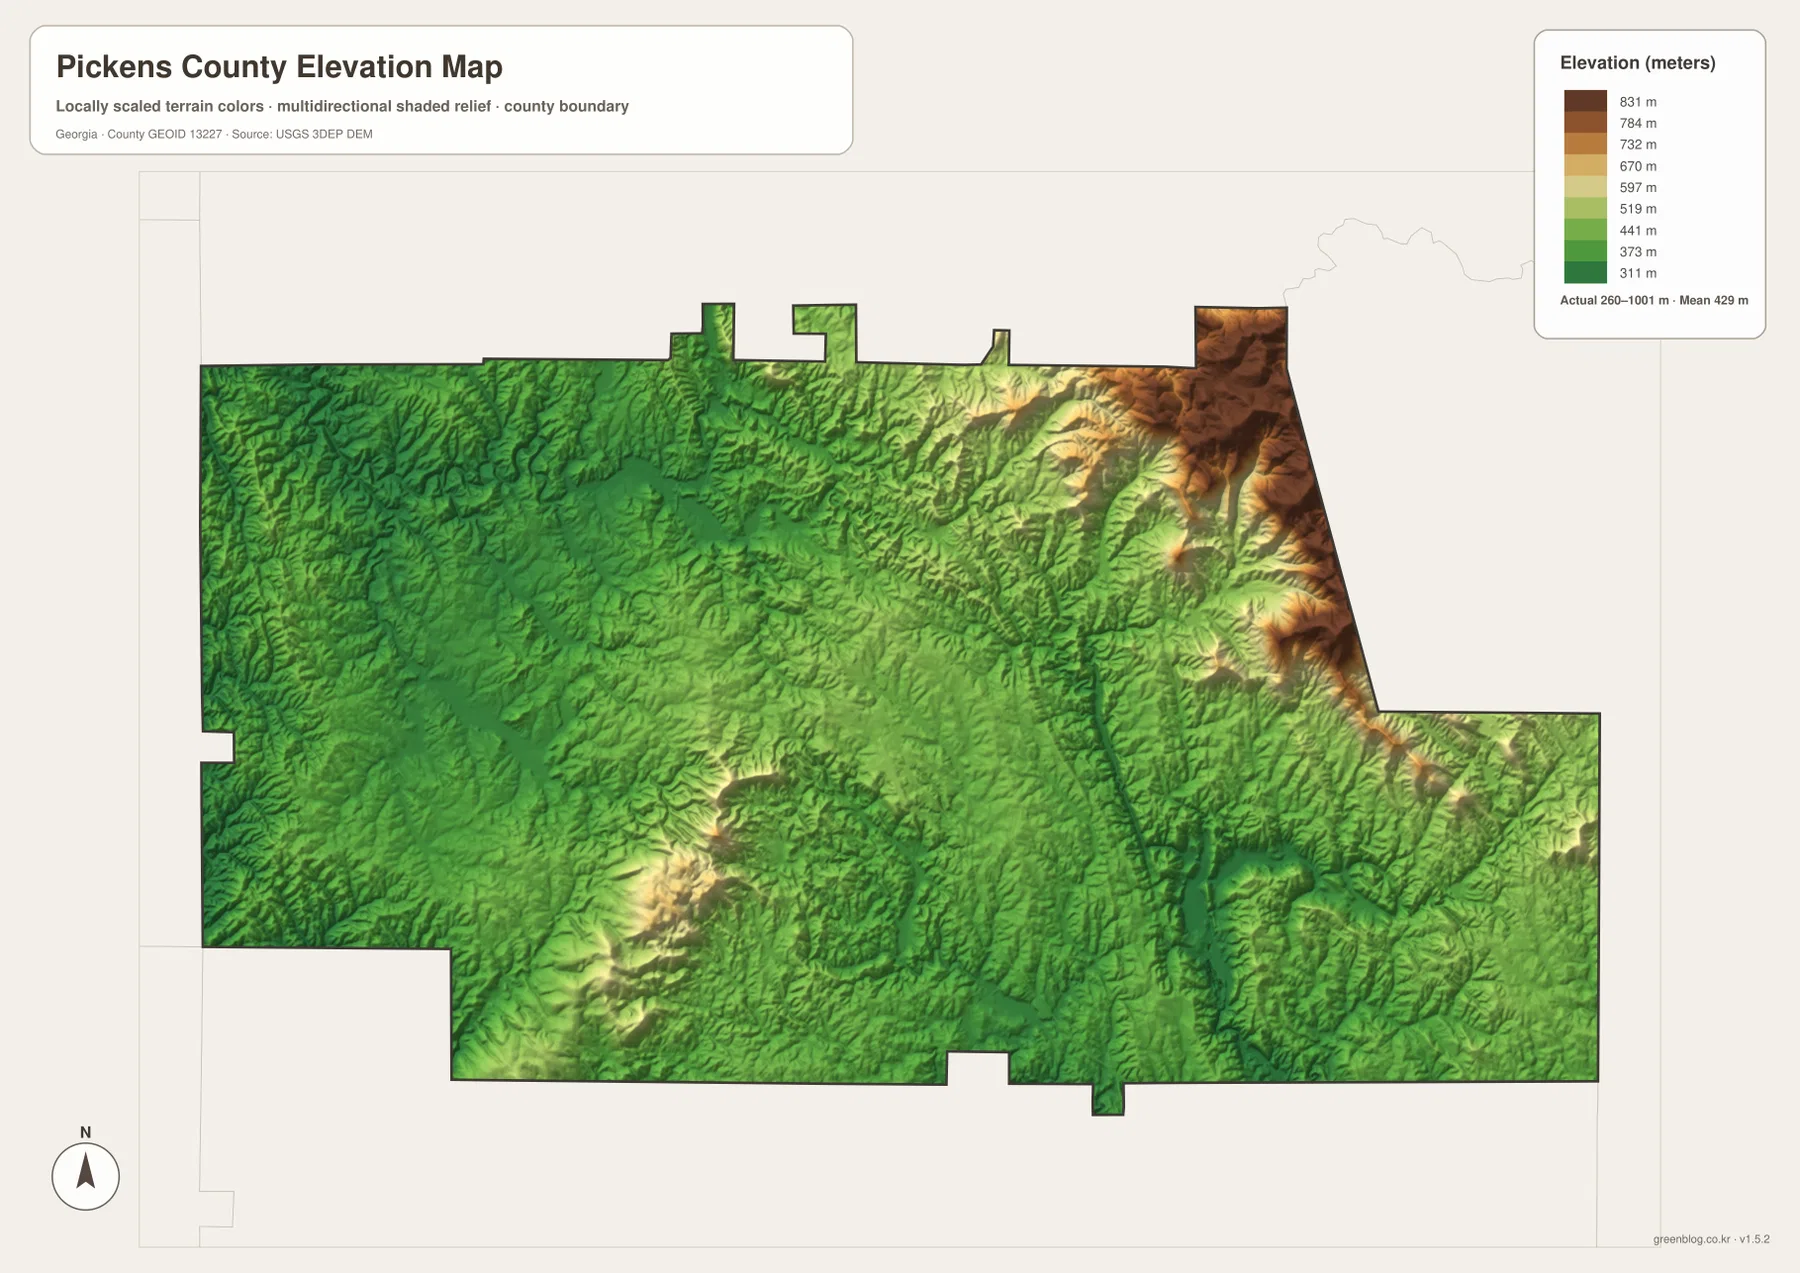
The elevation map makes the county’s mountain character much easier to see. The note in the legend gives an actual elevation range of about 260 to 1,001 meters, with a mean of roughly 429 meters. Much of the western and central county appears in lower green shades, although the surface is still broken by many ridges and hollows. The most dramatic change occurs in the northeast, where orange and brown terrain rises along a cluster of steep ridges. A separate high area is also visible in the southwest, standing above the surrounding green hills.
Several narrow, lower valleys cut through the eastern half. One of the clearest is the corridor followed by Long Swamp Creek, which appears as a lower green band between higher slopes. This is a good example of why the water and elevation maps are more informative when viewed together: the blue drainage lines follow the lower parts of a landscape that the elevation colors show as valleys and hollows. The maps do not provide trail difficulty or slope percentages, but they make the broad contrast easy to understand. Pickens County is not a flat Atlanta-area county; elevation changes are a defining part of its geography, especially toward the northeastern mountains.
The elevation colors are locally scaled, so the legend should be used instead of comparing colors directly with a different county map. Darker brown in Pickens County means higher ground within this county’s displayed range, not necessarily the same absolute elevation as the same color on another map. For print or presentation work, the legend is therefore an important part of the image. It lets the reader move from a visual impression of “higher” and “lower” terrain to actual meter values.
Choosing the Right Pickens County Map
For a quick county overview, start with the reference map because it combines the boundary, Jasper, selected communities, streams, and numbered roads. Use the city map when a clean comparison of Jasper and Talking Rock is more important than showing every geographic detail. The water map is the better choice for locating named creeks and lakes, while the elevation map explains why those streams wind through narrow valleys and why the northeast looks much more mountainous than the central and western sections. In a classroom or presentation, choosing one map for one question usually keeps the page clearer. For deeper local research, comparing all four maps provides a more complete picture.
The downloadable set is meant for that kind of flexible use. The webpage previews are optimized for viewing in a browser, while the ZIP contains four larger A3 JPG files. They can be printed, placed into slides, or kept as offline reference images. They should not be treated as legal parcel maps, emergency-navigation products, or engineering drawings, but they are well suited to general geography, community orientation, local-history projects, and visual reference.
Frequently Asked Questions
Why does northeastern Pickens County look much higher on the elevation map?
The elevation map shows its strongest orange and brown terrain along the northeastern ridges. The legend notes an actual county range of about 260 to 1,001 meters, so those colors represent a real rise above the lower green hills and valleys across much of the central and western county.
Which creeks and lakes are labeled on the water map?
Named waterways include Talking Rock Creek, Little Scarecorn Creek, Scarecorn Creek, Town Creek, Rock Creek, and Long Swamp Creek. The eastern side also labels Sequoyah Lake, Grandview Lake, Lake Tamarack, Lake Petit, and Cox Lake, along with smaller water features.
Does the city map show every community in Pickens County?
No. The city map deliberately highlights Jasper and Talking Rock as ranked city references. The broader county map includes additional labels such as Nelson, but small communities, every local road, and parcel boundaries require a more detailed source.
Sources and Reference Data
The county background can be checked against local government and regional reference material, while the boundary, hydrography, and elevation layers are supported by U.S. public geographic datasets. These maps are intended for general reference. Current road conditions, parcel ownership, flood hazards, legal boundaries, and public access should be confirmed with the responsible agency when those details affect a decision.
- Pickens County government history page
- U.S. Census Bureau QuickFacts for Pickens County
- New Georgia Encyclopedia entry for Pickens County
- U.S. Census Bureau TIGER/Line boundary data
- USGS National Hydrography
- USGS 3D Elevation Program
Map File Information
Download the Pickens County reference, city, water, and elevation maps as four high-resolution A3 JPG files in one ZIP. The larger files are suitable for printing, classroom material, presentations, and offline reference.
- File Type: ZIP containing four high-resolution A3 JPG files
Related Maps
Green Map creates custom-edited map images using open geographic data sources such as geoBoundaries, Natural Earth, OpenStreetMap, and government open data. These maps are edited visual materials, not raw data files, and are provided for education, documents, presentations, and graphic reference.