Genesee County in western New York is dominated by working farmland, but the land-cover maps also reveal broad wetlands, scattered forest, and a much more compact developed center around Batavia. Four map views separate those themes so readers can compare the county’s overall cover, forest and farmland, impervious and developed surfaces, and long-term classification differences without treating them as the same kind of information.
The page uses WebP previews for quick viewing, while the four original JPG maps are available together in one ZIP download. That makes it easy to save the set for printing, presentations, classroom work, or side-by-side reference when the on-page previews are not enough.
Table of Contents
A farm-dominated county with several other strong cover types
The 2025 summary places agricultural cover at 52.90% of Genesee County, making it the largest mapped class by a wide margin. Wetlands account for 19.86%, forest for 15.24%, developed cover for 11.13%, and mapped water for 0.44%. Those percentages establish the broad balance, but the map adds an important spatial detail: agriculture is extensive without forming one uninterrupted block.
Large agricultural areas spread across the north, center, and east and continue through much of the south. Wetlands repeatedly interrupt those farmed areas, especially toward the west and north, while forest appears in irregular patches around the county edges and between fields. Batavia stands out as the clearest developed concentration near the middle of the county. Smaller settlements and road corridors create thinner traces rather than large continuous urban areas.
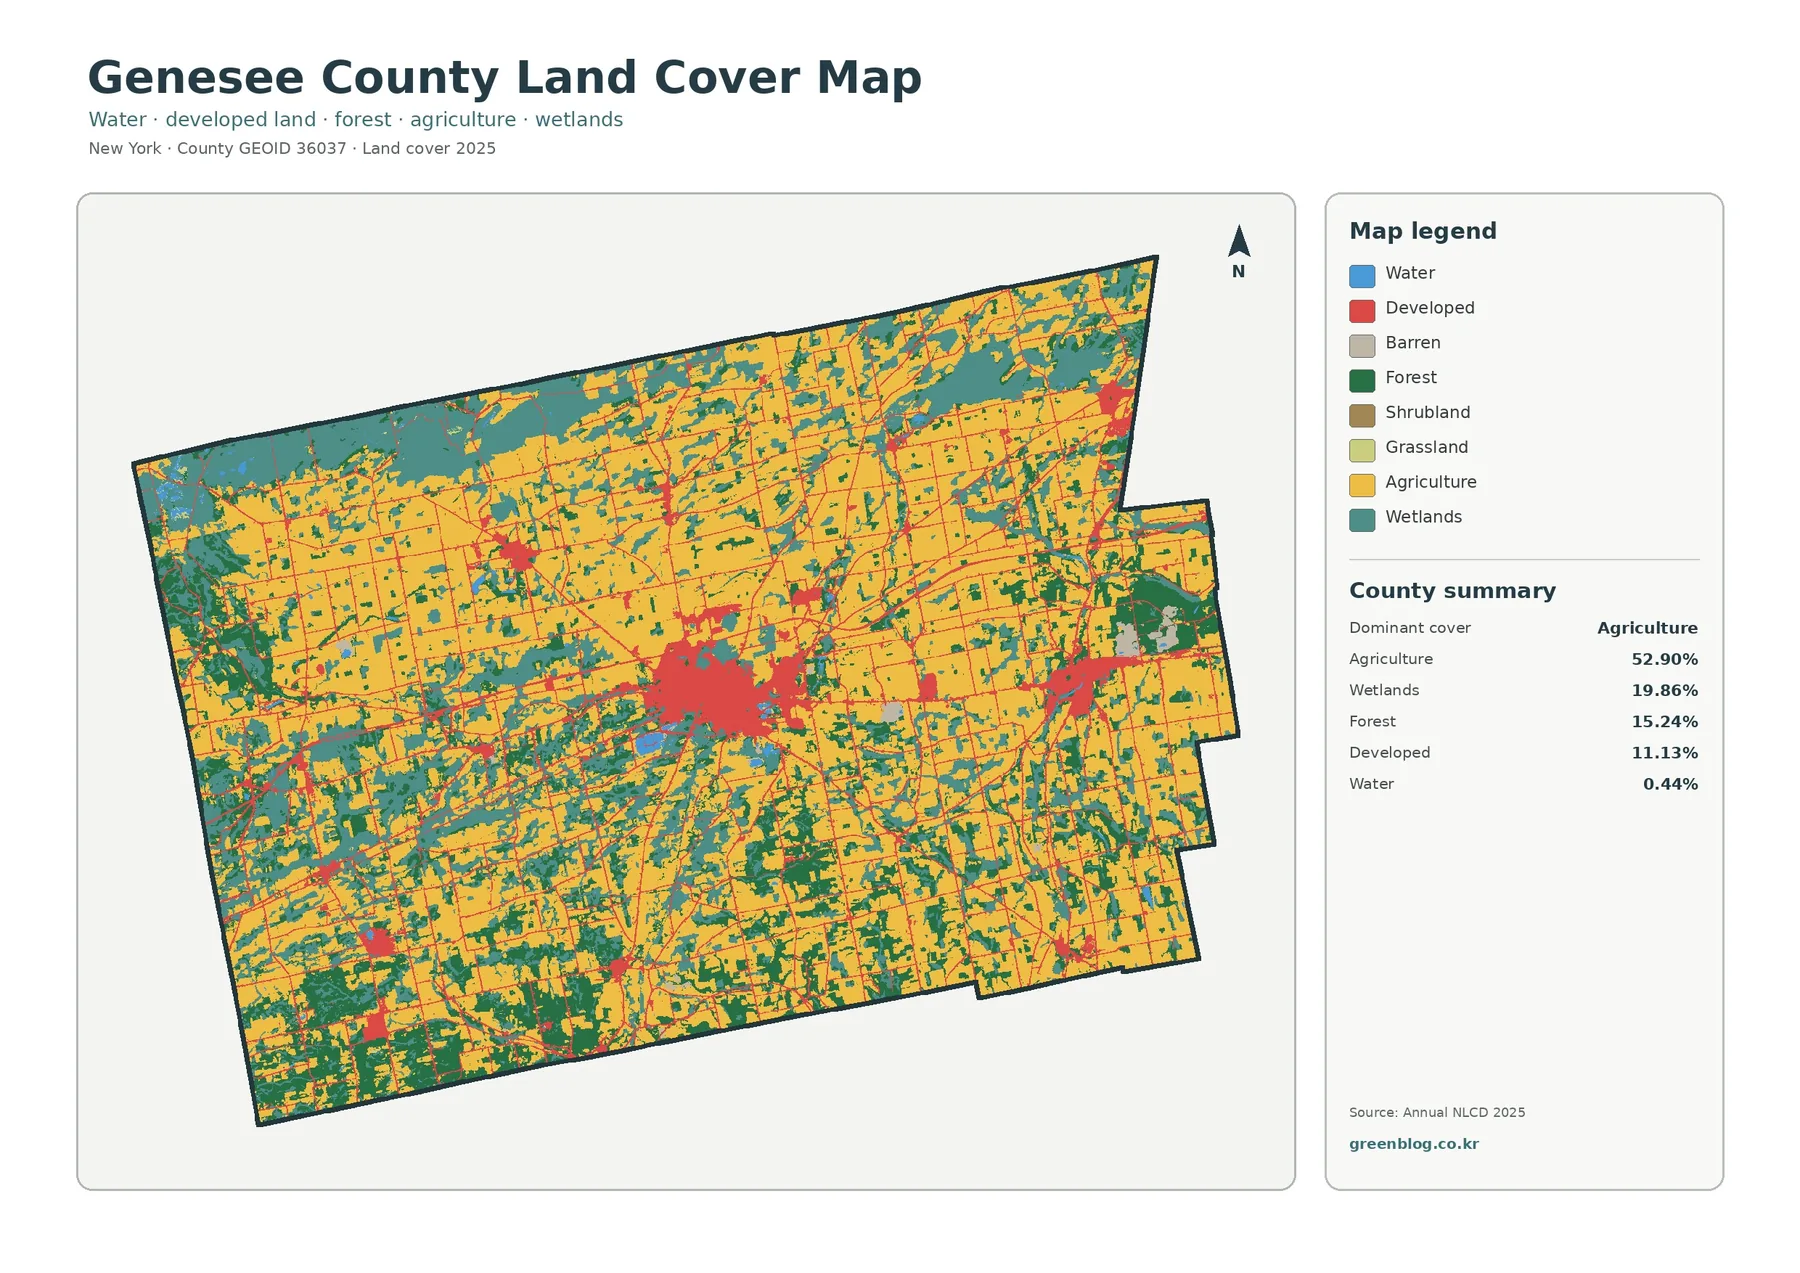
Land cover describes what is physically covering the ground, not what a parcel is legally zoned for or who owns it. The underlying raster data divides the landscape into grid cells and assigns a representative class to each cell. Narrow streams, small buildings, field edges, and mixed areas can therefore look simpler than they do on the ground.
Forest and farmland become easier to compare
Removing some of the competing classes makes the agricultural structure of Genesee County much clearer. Farmland forms broad connected areas across much of the county, while larger forest patches are more noticeable in the southwest and south. Smaller wooded pieces remain scattered through the north and east, often beside wetlands or between fields.
That arrangement is useful because it shows where working land meets other kinds of cover. In many places, farmland directly borders wet ground or woodland rather than sitting inside a uniform agricultural landscape. For environmental education, that contrast helps explain why a county known for agriculture can still contain substantial habitat variety within a relatively short distance.
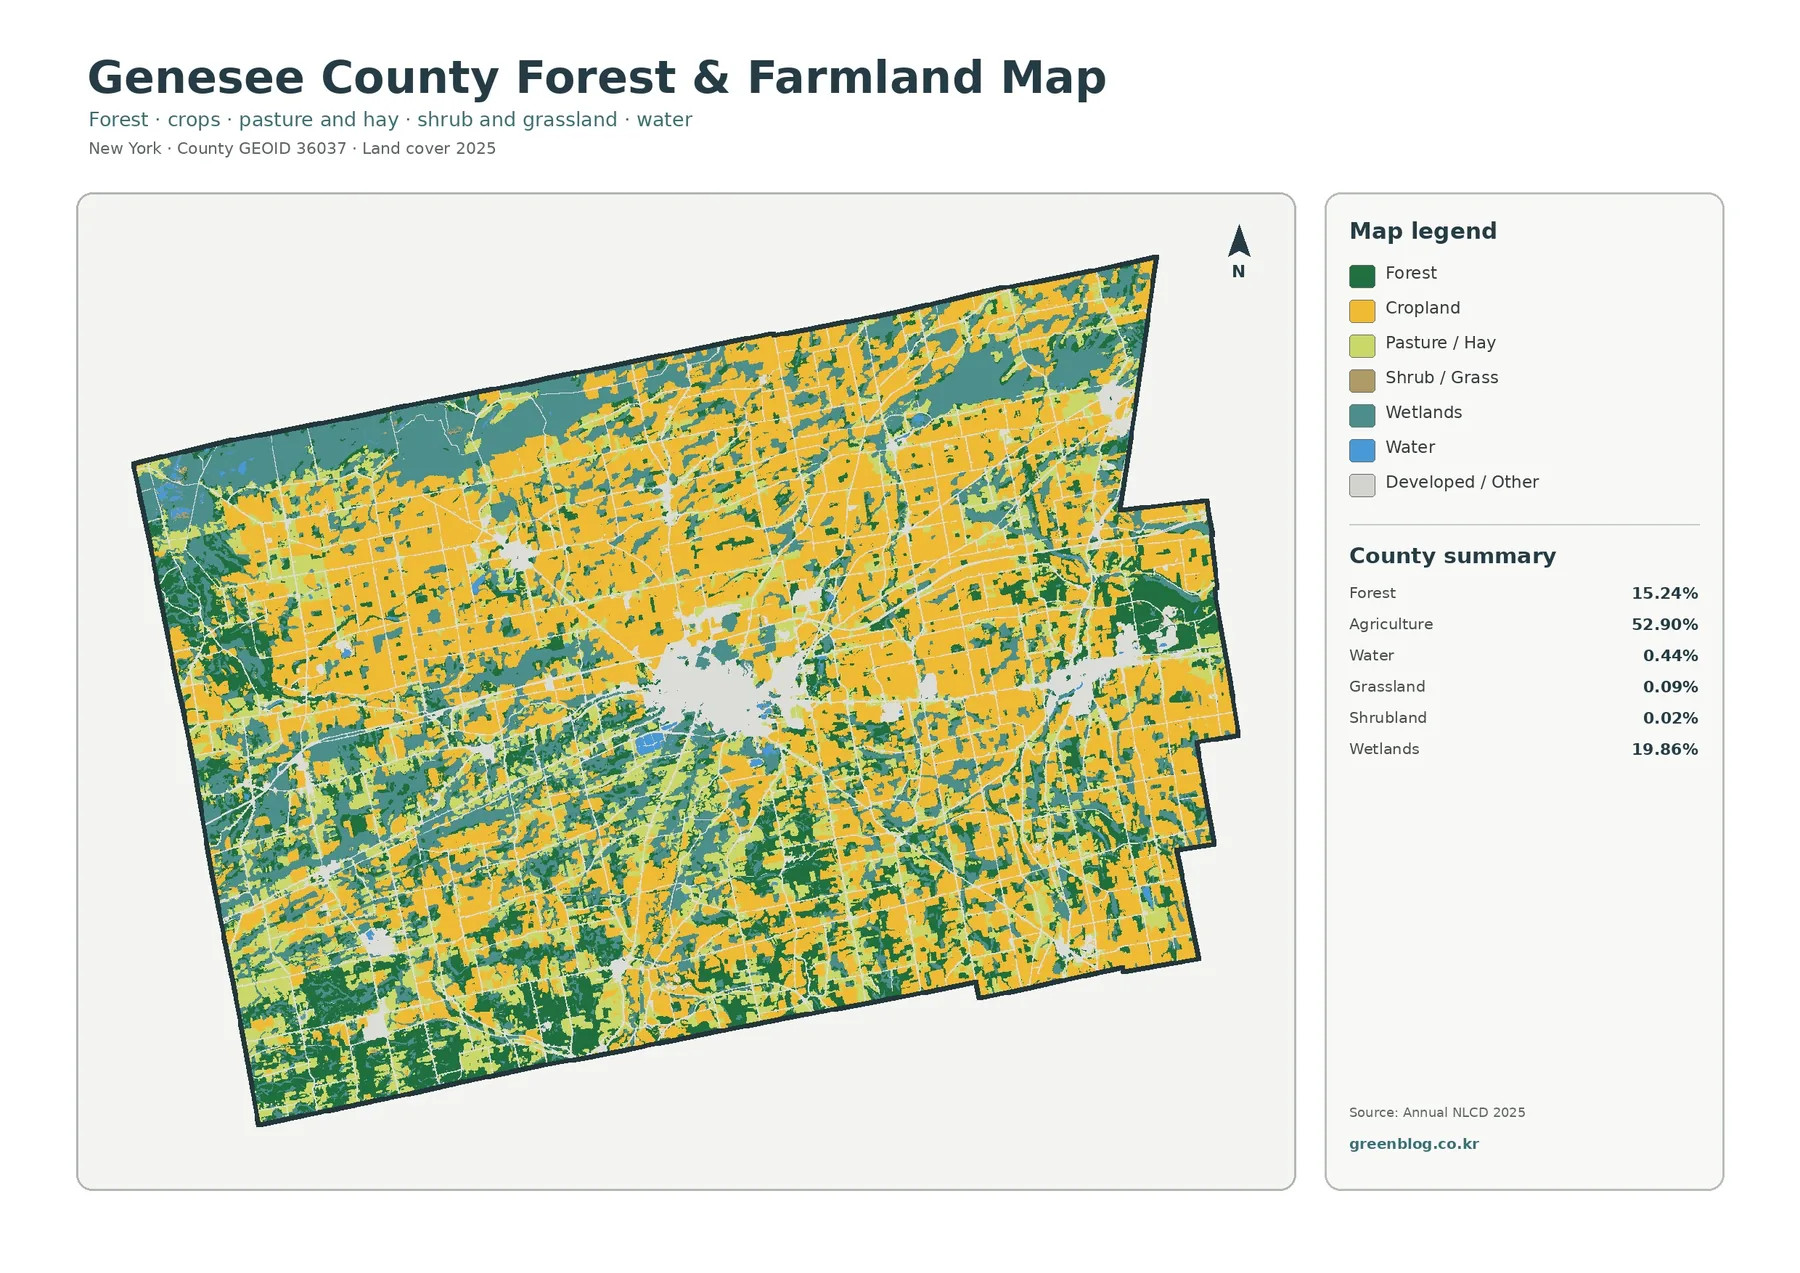
Genesee County maintains agricultural and farmland-protection programs, so the large agricultural footprint visible here also has local planning relevance. The map itself, however, does not show legal agricultural districts or protected parcels. Anyone researching regulations, easements, or official district boundaries should use county or state records in addition to the land-cover image.
Impervious surfaces isolate the Batavia development core
Impervious surface means pavement, rooftops, parking areas, and similar ground where water does not readily soak into the soil. The map summary gives Genesee County a mean impervious value of 3.15%, while 1.47% of the county is mapped at 50% impervious or greater. A countywide average can sound small, yet the image shows why location matters more than the average alone.
The strongest values are concentrated around Batavia. Dense cells form a compact central cluster, then lighter traces follow roads outward toward smaller settlements. A few additional concentrations appear east and northwest of Batavia, but most rural agricultural areas stay in the lowest impervious categories. This distribution makes the built landscape easier to recognize than it is on the general land-cover map.
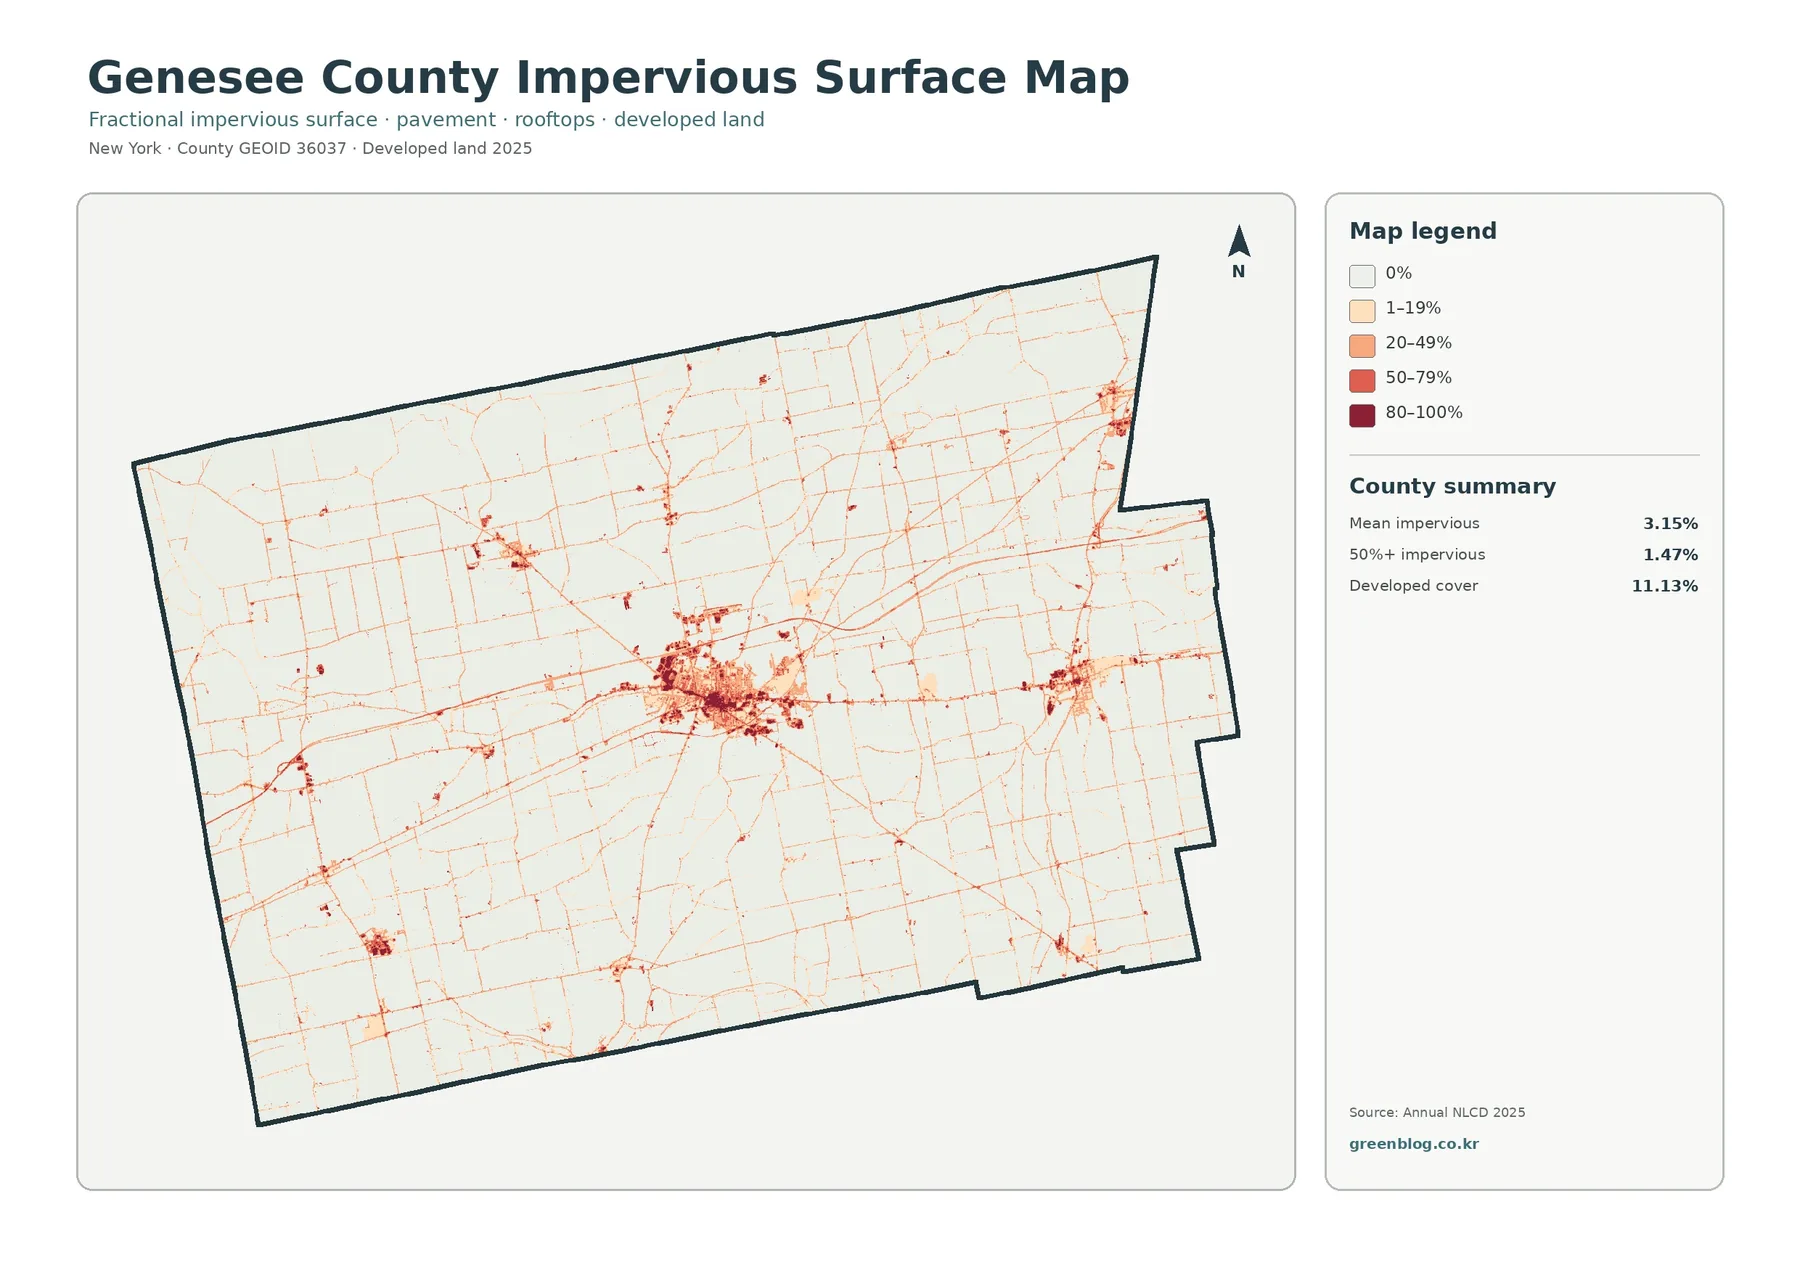
For watershed or stormwater discussions, the impervious view can be compared with nearby wetlands and farmed land to identify places worth closer review. It is also useful for explaining why runoff conditions can vary sharply inside an otherwise rural county. The map is not precise enough to measure individual rooftops, parking lots, or road widths; those questions require finer imagery or local GIS layers.
The 1985–2025 map is a screening tool, not a verdict
The change map compares classifications from 1985 and 2025. Across 13.72% of the county, the two mapped classes differ. Developed-related differences account for 1.63%, mapped forest loss for 0.40%, and agricultural loss for 1.28%. Another 10.04% is grouped as other class difference, which is the largest category in the comparison.
Developed differences are easiest to notice around Batavia and several smaller settlement locations. Agricultural-loss colors appear in scattered groups, and mapped forest loss covers less area. The much broader distribution of the other-difference category is a reminder that a changed classification does not automatically mean construction, clearing, or a confirmed land-use conversion occurred.
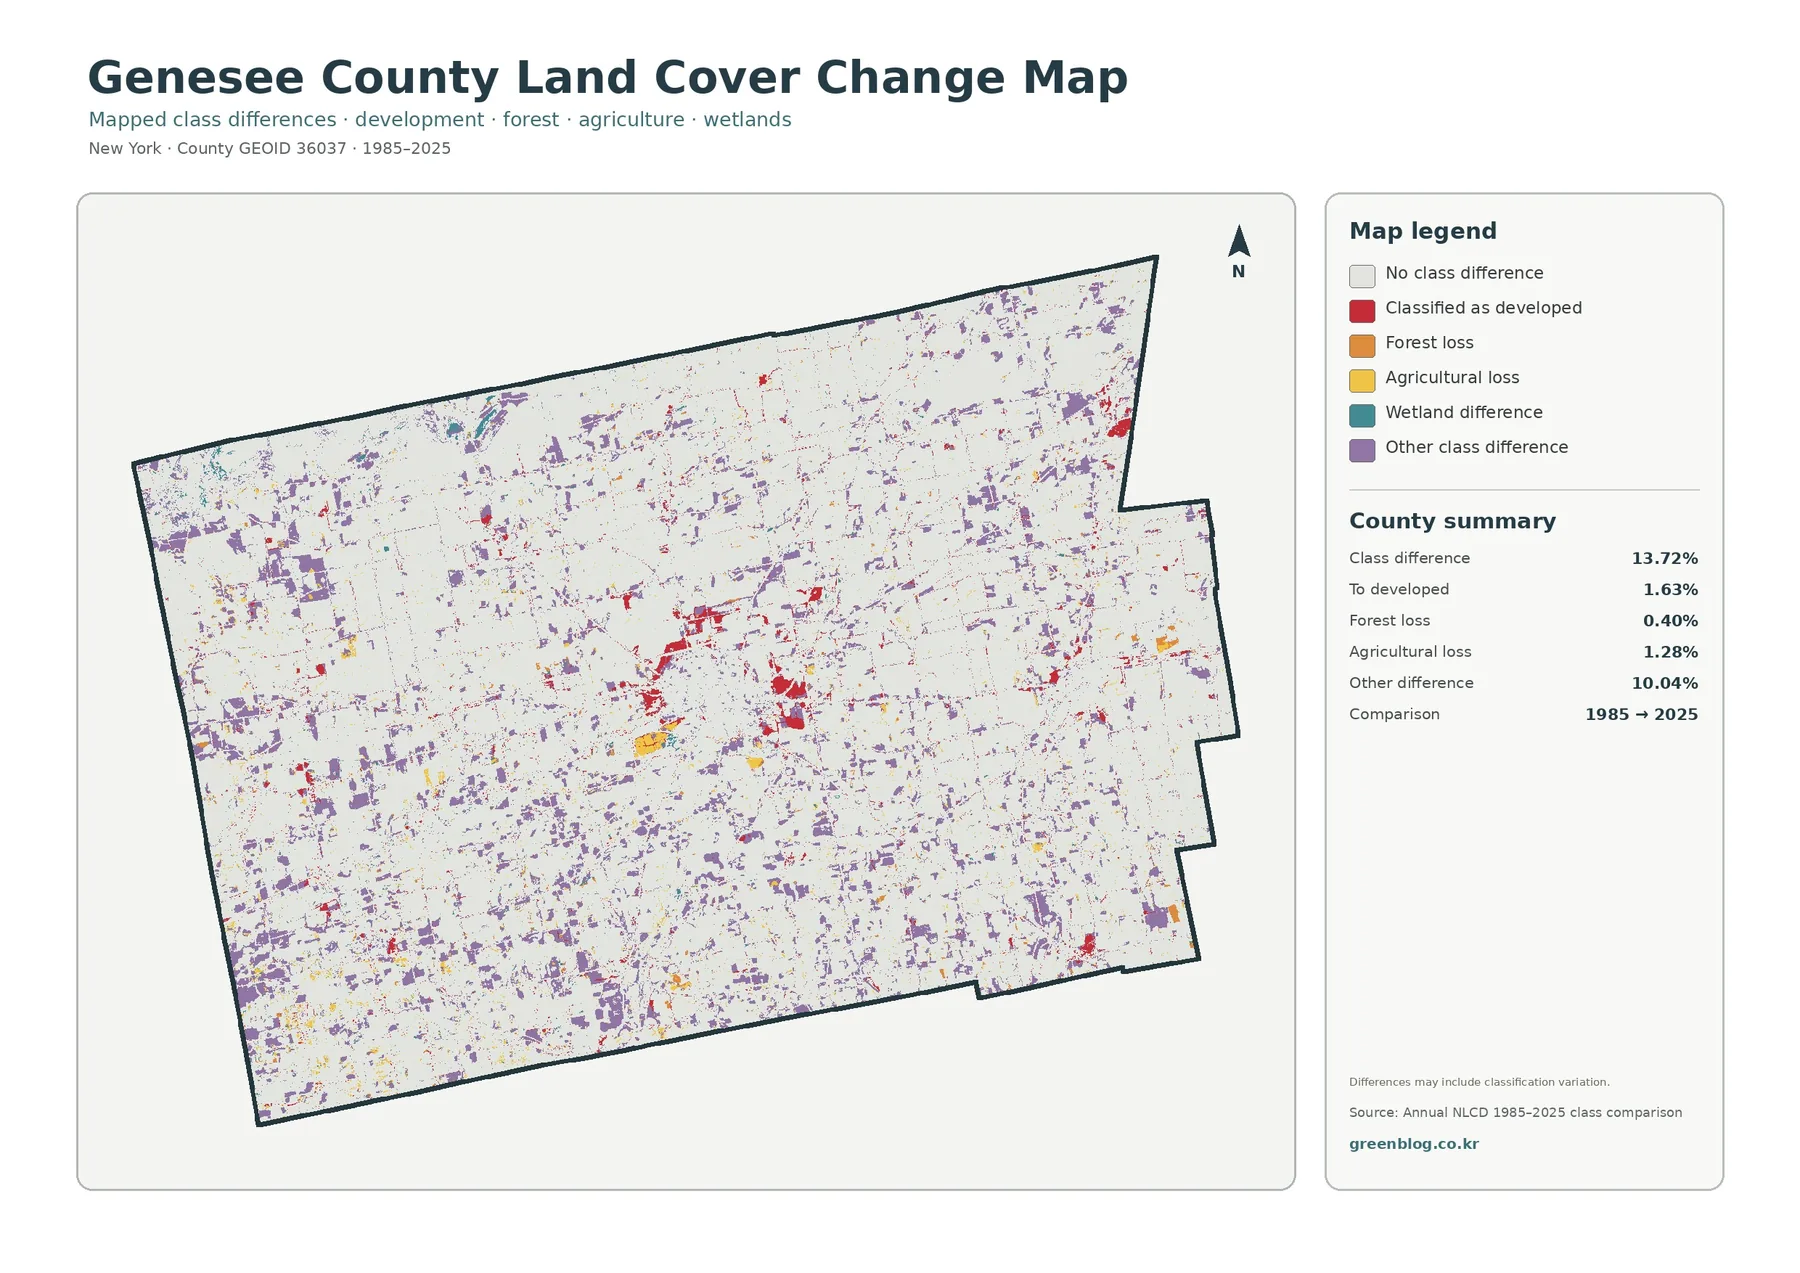
Long time spans can include changes in sensors, classification procedures, seasonal conditions, and mixed pixels. A mixed pixel contains more than one real surface type even though the dataset must display a single representative class. When a particular site matters, intermediate-year imagery, aerial photographs, and local records should be checked before drawing a conclusion about what physically changed.
How the four maps complement one another
A practical way to use the set is to begin with the general land-cover map, because it establishes the relationship among agriculture, wetlands, forest, development, and water. The forest-and-farmland view is better for questions focused on working land and wooded cover. Impervious values then sharpen the picture of where built surfaces are concentrated, while the change map points to locations that deserve a closer historical look.
Different audiences may need different sheets. An agriculture-focused presentation will usually be clearer with the forest-and-farmland map than with the full legend. A runoff or development discussion benefits from the impervious view. For a time-comparison lesson, the change map is useful as long as the caption explains that classification difference and confirmed land-use change are not identical concepts.
The four views can also be compared in pairs. Wetlands on the general map can be checked against nearby impervious concentrations when discussing watershed context. Large farm blocks can be compared with the change map to identify areas where classifications differ between the two years. These comparisons are most useful for broad screening, education, and orientation rather than parcel-level decisions.
Download the original JPG map set
The downloadable archive contains four original JPG files: the general land-cover map, forest-and-farmland map, impervious-and-developed-land map, and the 1985–2025 land-cover comparison. The WebP versions on this page are previews, while the ZIP provides the JPG files for saving, printing, or reuse in compatible visual projects.
Important reading limits
- Land cover describes the physical surface and should not be confused with zoning, ownership, easements, or parcel boundaries.
- Raster cells generalize the landscape, so narrow roads, small buildings, minor streams, field edges, and small wetlands may appear simplified.
- Impervious values help compare the location and intensity of built surfaces but are not a survey of individual structures.
- The 1985–2025 comparison identifies classification differences. Important sites should be checked against aerial imagery, local GIS, or other year-by-year sources.
Frequently Asked Questions
What is the largest mapped land-cover type in Genesee County?
Agricultural cover is the largest class in the 2025 summary at 52.90%. Even so, the map shows that wetlands and forest repeatedly interrupt the agricultural pattern, so the county is not one continuous farm block.
Does every colored cell on the change map represent confirmed land conversion?
No. The map shows a difference between two classifications. Sensor changes, classification methods, seasonal conditions, and mixed pixels can also affect the result, so important locations should be verified with additional imagery or records.
Why use the impervious map when developed land already appears on the main map?
The impervious map adds intensity. It makes the Batavia core, road traces, and smaller built-up clusters easier to distinguish and is especially useful when discussing runoff or the concentration of hard surfaces.
Map File Information
Download the four original JPG maps described on this page in one ZIP archive.
- Included Files: 4 original JPG land-cover maps
- File Type: JPG files in one ZIP archive
- Intended Use: Reference, printing, education, presentations, and map-based projects
Related Maps
- Albany County Land Cover Map
- Bronx County New York Land Cover Map
- Cattaraugus County New York Land Cover Map
Sources and references
- MRLC Annual NLCD Data — official access point for Annual NLCD land-cover and related datasets.
- USGS Annual NLCD Land Cover Classification — background on land-cover classes and interpretation.
- Genesee County Agricultural and Farmland Protection — county information on agricultural planning and farmland protection.
- Genesee County Soil and Water Conservation District — local soil, water, agriculture, and conservation programs.
Green Map creates custom-edited map images using open geographic data sources such as geoBoundaries, Natural Earth, OpenStreetMap, and government open data.
These maps are edited visual materials, not raw data files, and are provided for education, documents, presentations, and graphic reference.