Custer County is dominated by open shrubland but broken by large mountain forests, grassland, exposed high-country ground, and narrow agricultural corridors. The 2025 summary places shrubland at 57.92% and forest at 26.37%, while agriculture covers only 1.84%. That small farm share is still easy to spot because it is concentrated in a few valley strips rather than spread evenly across the county.
This page compares the general land cover map, a forest-and-farmland view, an impervious-surface map, and a 1985-to-2025 class-difference map. After reviewing the WebP previews, you can download the four original JPG maps together in one ZIP for printing, county comparisons, classroom work, or reference.
Table of Contents
Shrubland forms the broad framework, while forest follows the mountain country
The strongest pattern in Custer County is the extent of shrubland. Brown shrubland covers broad parts of the center and east and continues through large open basins between mountain blocks. It is not a small fringe class around the edge of the county. Instead, it provides the background against which the darker forest, lighter grassland, barren ground, farm patches, and water features become easier to distinguish.
Forest is the second-largest class at 26.37%. Large green areas occupy much of the west and southwest, with additional forest bands and patches extending through the central and eastern mountain ranges. Some of those green areas are continuous, while others are interrupted by shrubland, grassland, or exposed ground. The result is a county that looks distinctly mountainous without being uniformly forested from boundary to boundary.
The U.S. Forest Service describes the Salmon-Challis National Forest landscape in this part of central Idaho as a mix of forested mountains and high-desert sagebrush country, with rugged ranges divided by rivers and valleys. That regional description helps explain why the map contains long transitions between forest and open shrub-covered ground. It should be used as geographic context, however, not as proof that every individual land-cover patch is controlled by a particular forest boundary or mountain range.
The 2025 map separates shrubland, forest, grassland, barren ground, and small valley classes
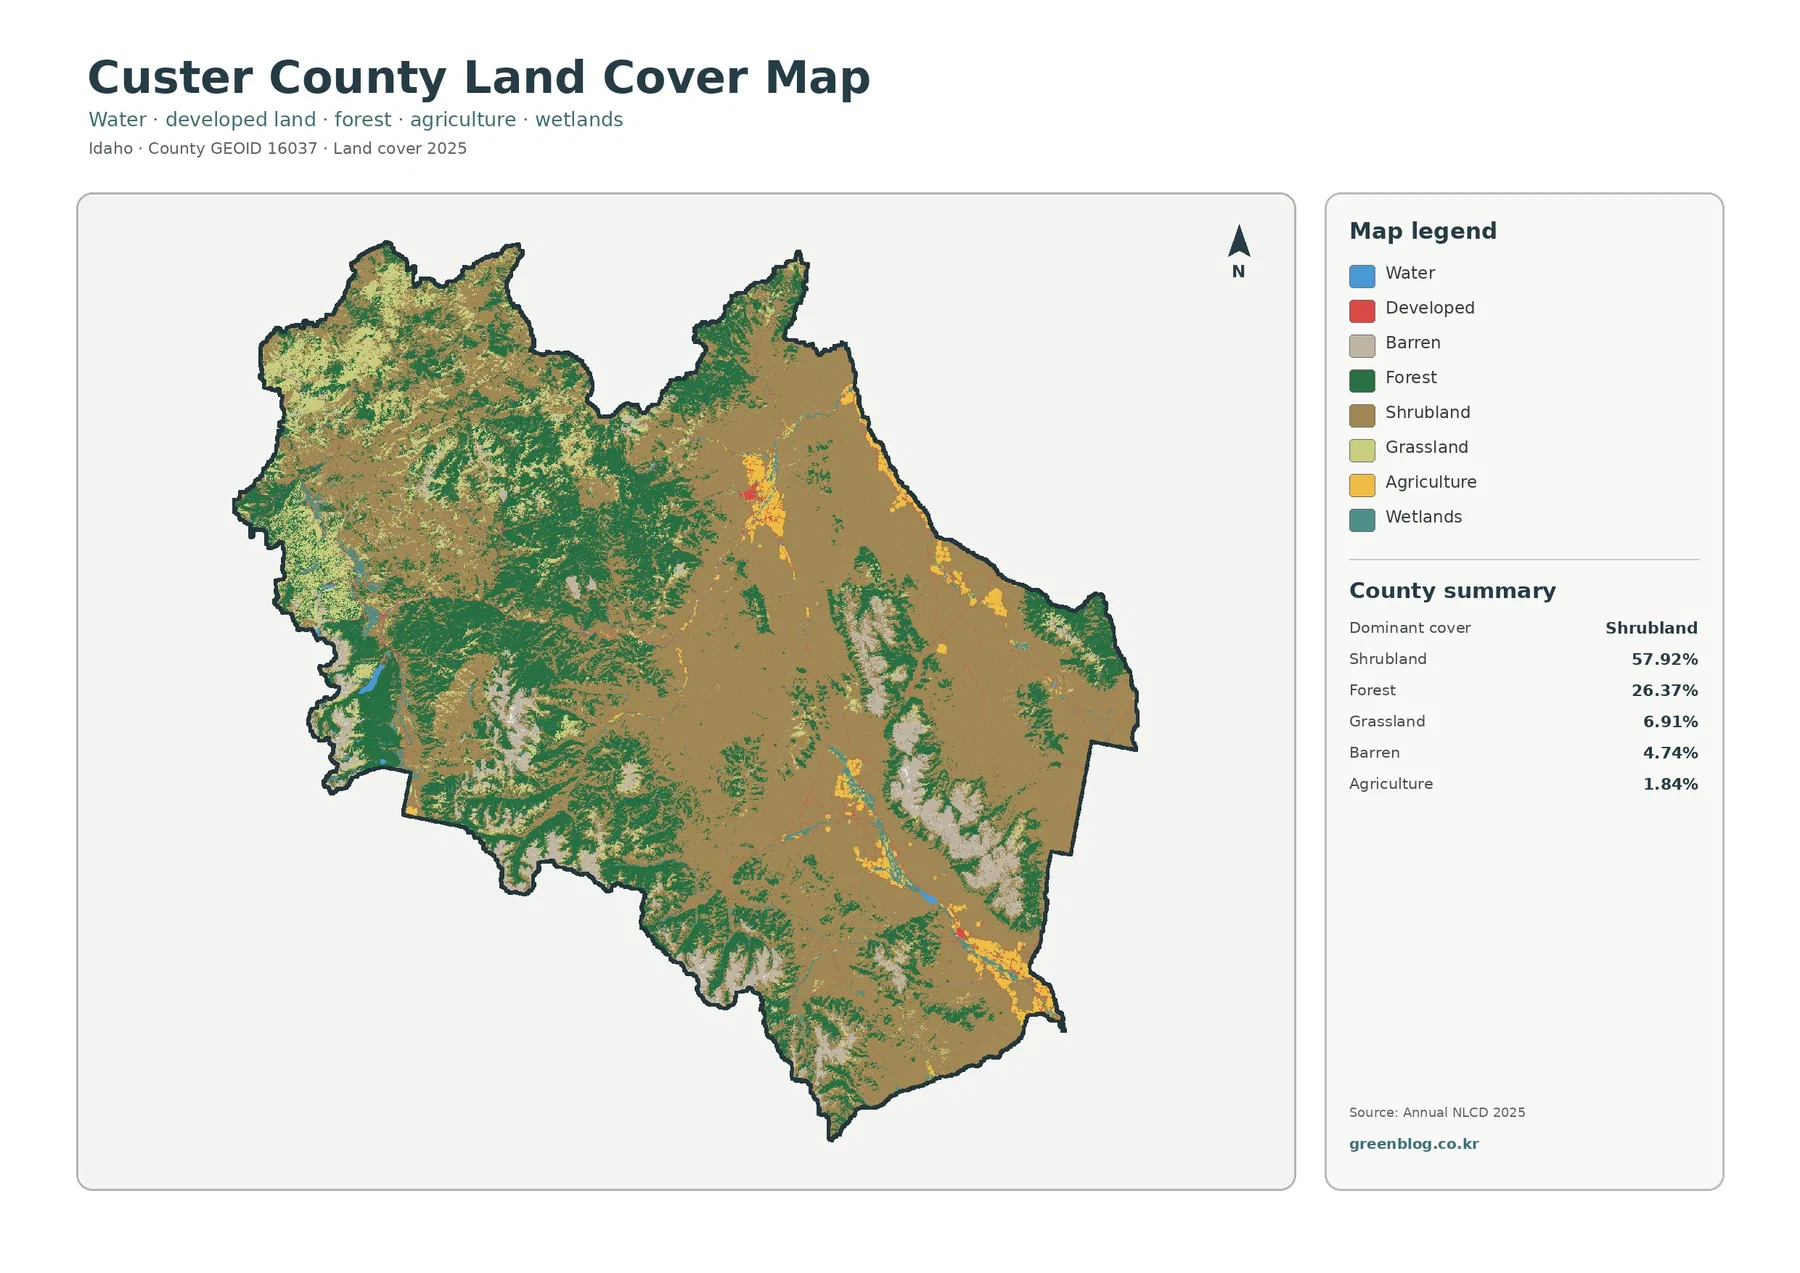
Shrubland and forest together account for most of the county, so the map is best read first as a contrast between open uplands and forested mountain terrain. Grassland adds another 6.91%, and barren ground accounts for 4.74%. Agriculture is 1.84%, wetlands 1.23%, and water 0.20%. Those smaller classes matter less to the countywide percentage but are important for understanding specific valleys and drainage corridors.
Grassland often appears next to shrubland, especially in parts of the west and northwest and along some openings around forest edges. The two classes should not be merged simply because both represent relatively open ground. Keeping the light grassland and brown shrubland colors separate reveals where the landscape shifts from denser shrub cover to more herbaceous surfaces before reaching forest or agricultural ground.
Barren land is unusually visible for a class that covers 4.74% of the county. Pale patches occur on several mountain belts and high ridges, including substantial areas in the central-east and southwest. In NLCD terminology, barren land can include rock, exposed soil, and other surfaces with very sparse vegetation. It does not mean that every pale patch is a mine, construction site, or other human disturbance.
Water makes up only 0.20%, yet the blue features stand out sharply against the surrounding brown and green. Custer County’s comprehensive plan identifies the Salmon River and its tributaries as the major watershed and also discusses the Big Lost River system and Mackay Reservoir in the southeast. Those waterways occupy little area compared with shrubland or forest, but they provide useful reference lines when locating agricultural and settled valley corridors.
A 1.84% agricultural share becomes visible because it is concentrated in narrow valleys
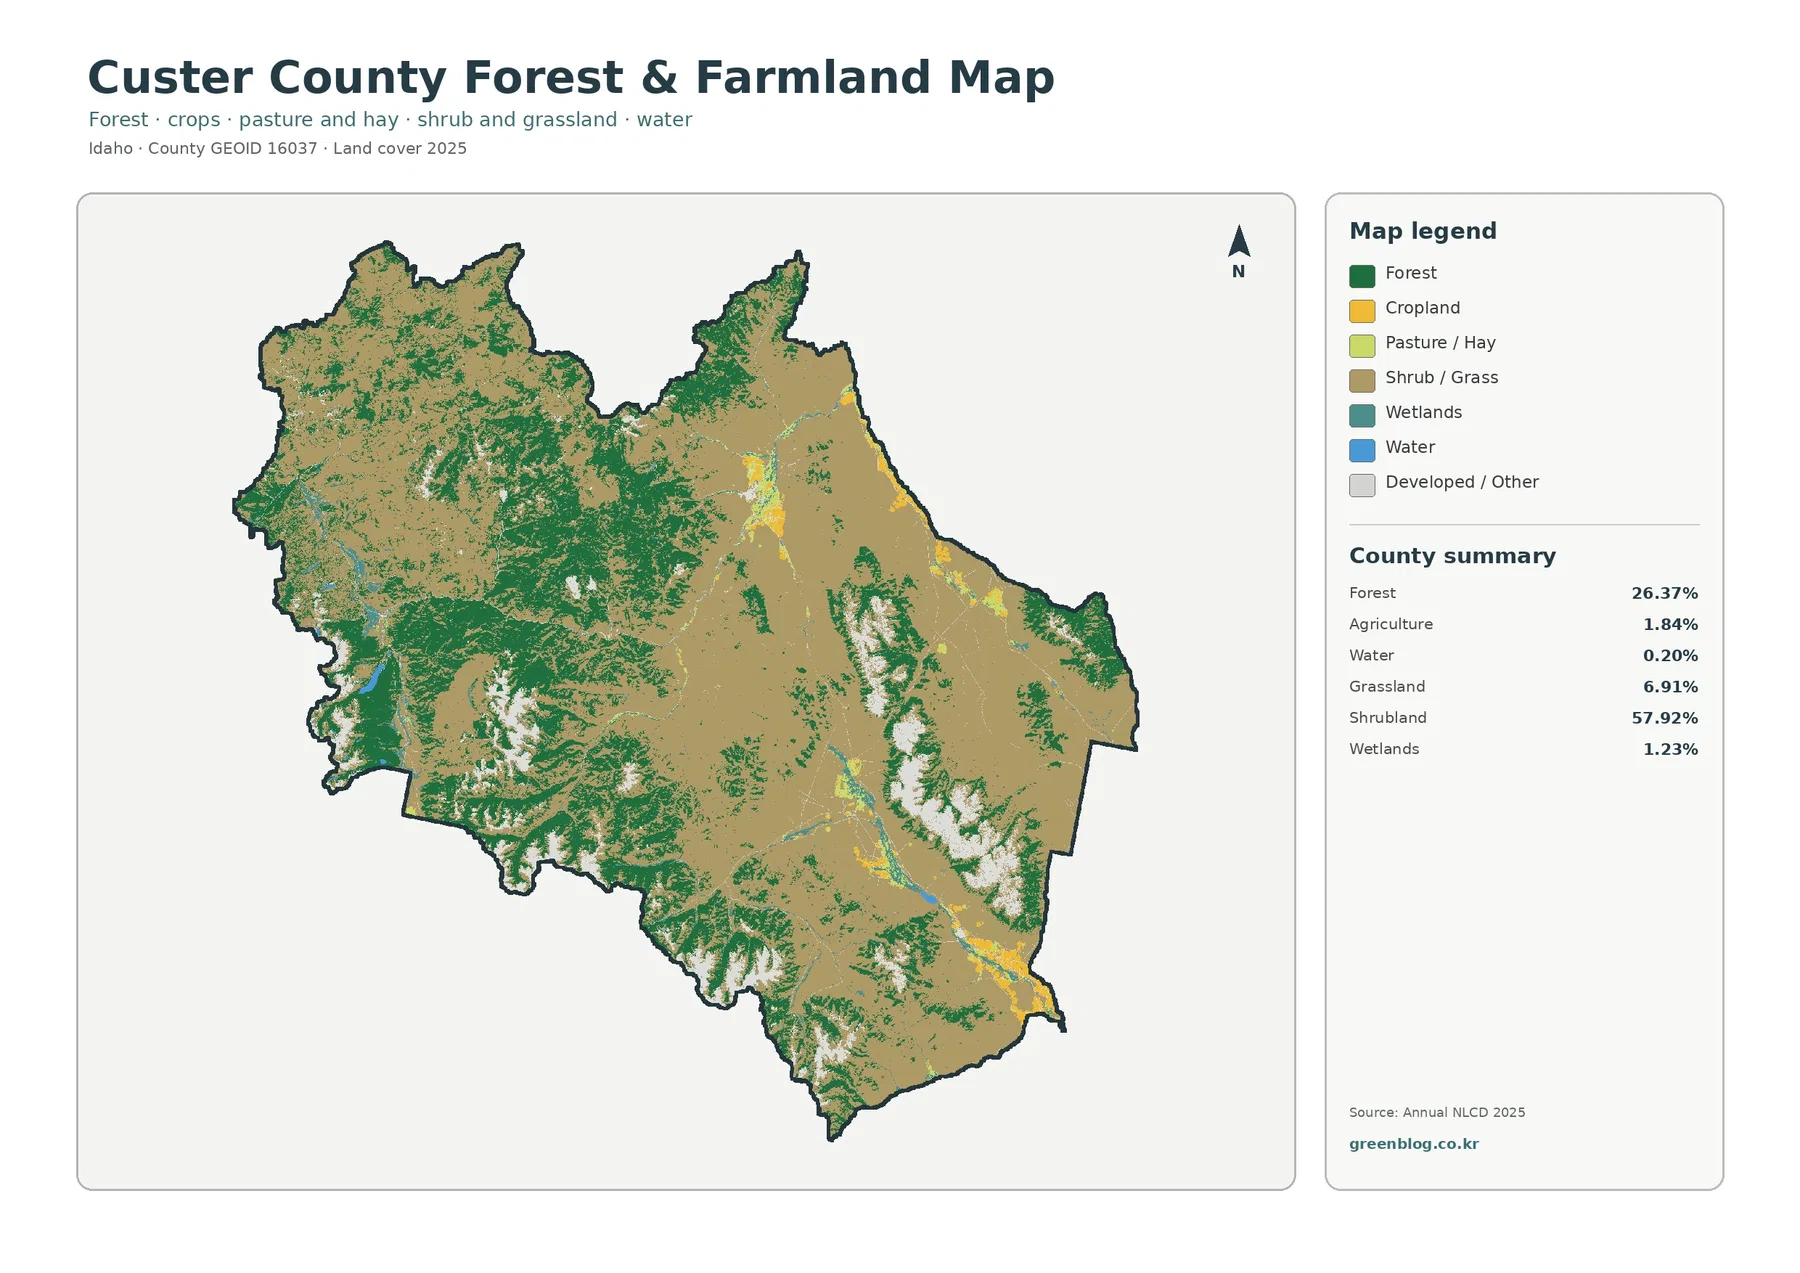
The forest-and-farmland map makes the location of agriculture more useful than the countywide percentage alone. Yellow cropland is not scattered evenly through the mountain country. It clusters in a northeastern-central valley area and again along a long southeastern corridor, with smaller pieces in between. Against a county dominated by shrubland and forest, those concentrated farm areas remain visually distinct even though agriculture represents less than two percent of the total area.
Custer County’s comprehensive plan describes irrigation from the Salmon River and tributary streams and explains the importance of water storage and irrigation in the Big Lost River Valley, including Mackay Reservoir. That source does not prove that every yellow pixel on this map is irrigated by one specific system, but it confirms that valley agriculture and water use are real parts of the county’s land-management context.
University of Idaho Extension in Custer County focuses on livestock production, rangeland management, crop and forage production, and farm and ranch management. That local program is useful context for the map because cropland is only one part of the agricultural landscape. Pasture and hay are mapped separately, while much of the surrounding open country falls into shrub and grass classes that can also be relevant to ranching without being classified as cropland.
A sharp color boundary on this map should not be treated as a surveyed parcel line. Annual NLCD classifies the ground in raster cells, so a narrow field, road, tree line, house, or stream edge can share a cell with another surface. The map is well suited to comparing where farm classes cluster across the county, but property ownership, legal land use, zoning, and field boundaries require separate county or parcel records.
Barren patches help distinguish the highest and sparsest-looking mountain surfaces
The 4.74% barren share gives Custer County a different appearance from counties where forest and shrubland cover nearly every upland. Light-colored patches interrupt forest and shrubland on several mountain blocks. In some places they form narrow ridge-like bands; elsewhere they appear as larger irregular areas. Because the map contains no elevation layer, these shapes should be described as sparse or exposed land-cover surfaces rather than used to calculate a specific elevation or slope.
The Forest Service notes that the Salmon-Challis landscape includes high mountain ranges and Idaho’s highest peak, Mount Borah, in the broader area. That geographic context makes the visible mixture of forest, shrubland, grassland, and barren surfaces easier to understand. Still, NLCD color alone cannot tell whether a particular barren cell is bedrock, scree, thin soil, a recently disturbed surface, or another low-vegetation condition.
A 0.20% mean impervious value shows how sparse the built footprint is
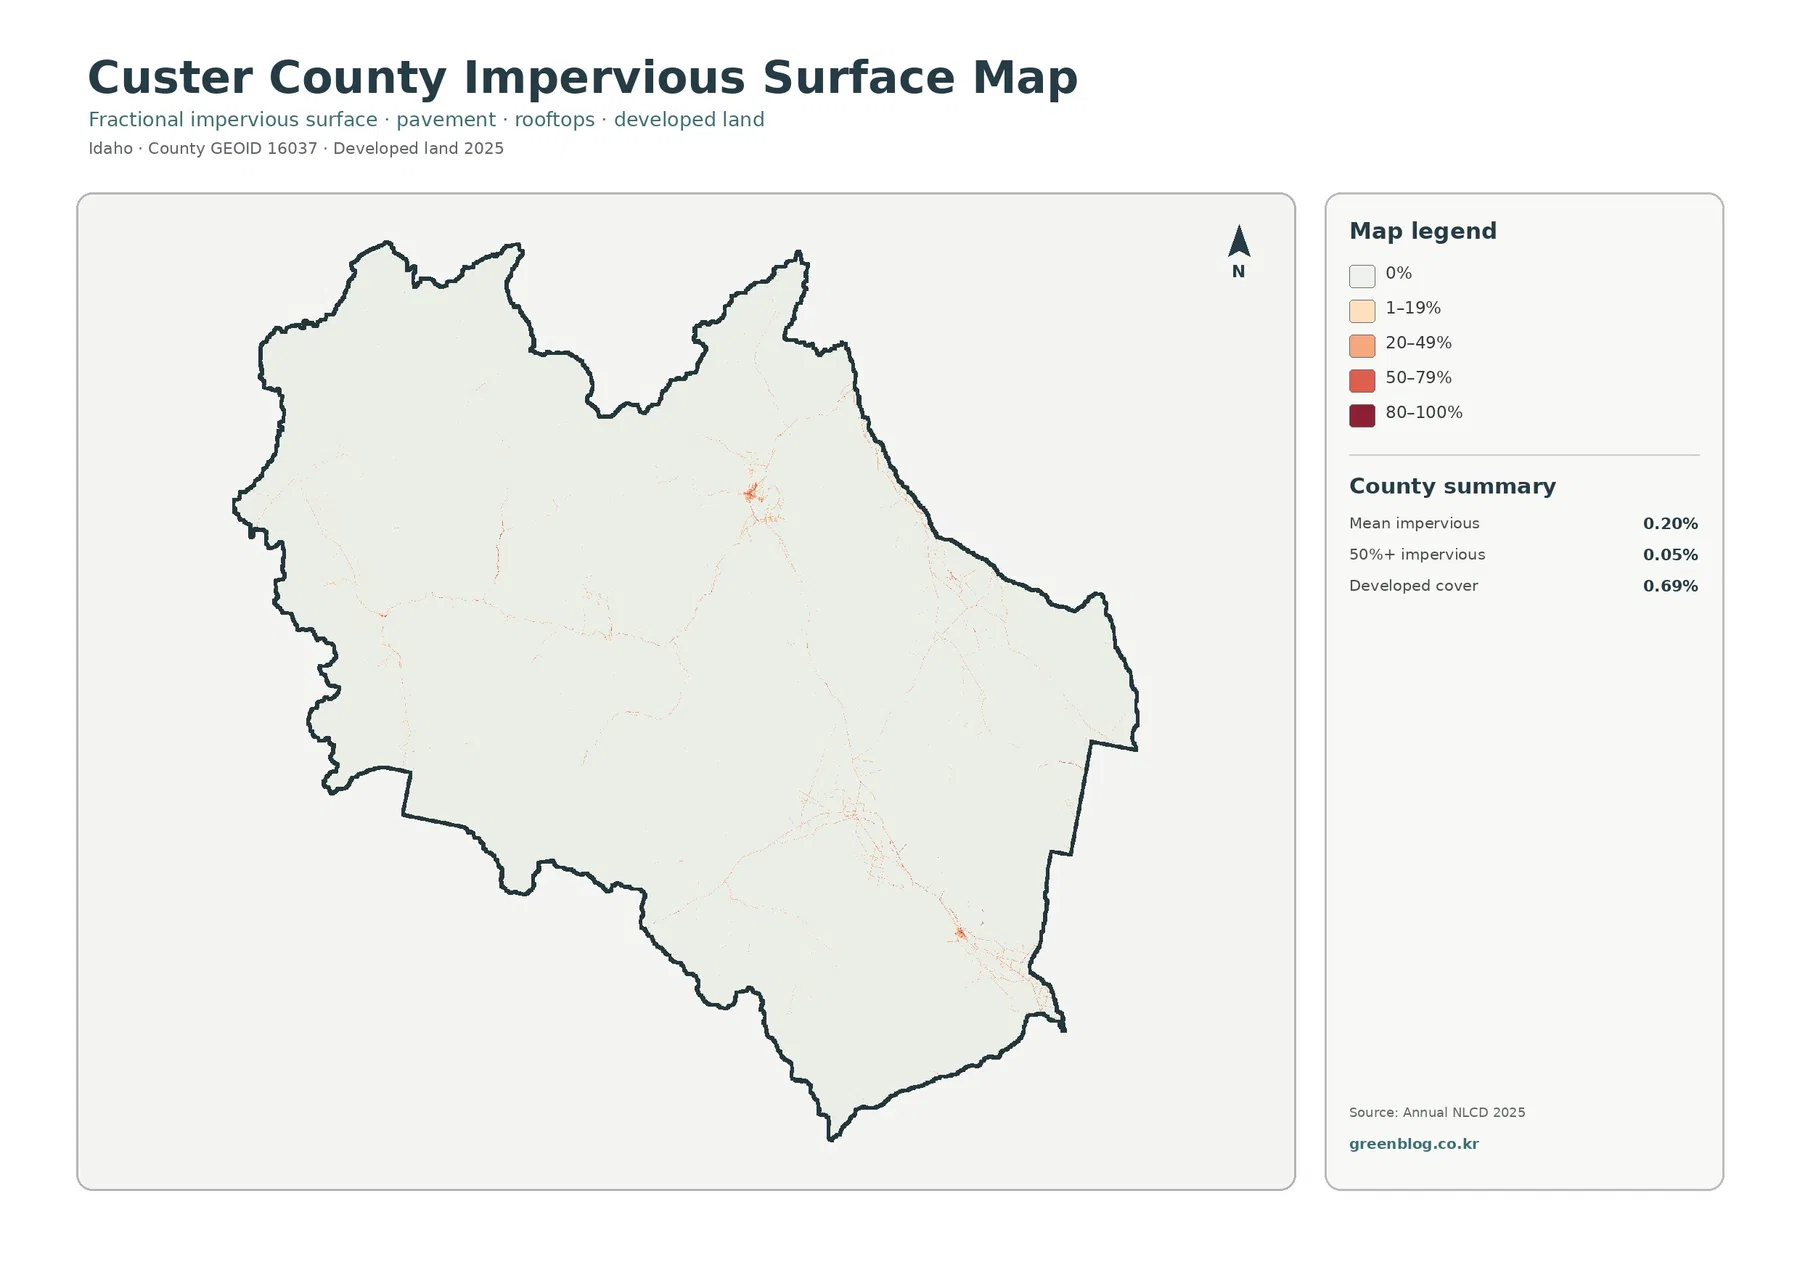
Impervious surface refers to pavement, rooftops, parking areas, and similar surfaces that do not readily absorb water. Custer County’s mean impervious value is only 0.20%, and cells with 50% or more impervious cover account for 0.05% of the county. Developed land cover is 0.69%. Compared with the shrubland, forest, and grassland percentages, the strongly built footprint is extremely small.
Most of the impervious map remains very pale. Thin road traces cross the county, and a few compact clusters are more visible in the northeastern-central and southeastern valley areas. Smaller lines extend through the west and across the interior, but they do not merge into a broad metropolitan surface. This map is therefore useful for finding relative settlement and road concentration that is easy to miss on the general land cover map.
The 0.69% developed-land figure is not the same as the 0.20% mean impervious value. A cell classified as developed can contain vegetation, soil, or other permeable surfaces along with pavement or buildings. Treating the entire developed class as asphalt or concrete would overstate the hard-surface area, especially in a rural county where developed cells may include low-density surroundings.
This view is not detailed enough to measure an individual road width or building footprint. A narrow road may occupy only part of a 30-meter cell, and a small structure may be mixed with nearby vegetation. For local engineering, parcel review, or site planning, higher-resolution imagery and authoritative road or parcel data should be used instead.
The 15.02% class difference marks places to investigate, not a single loss rate
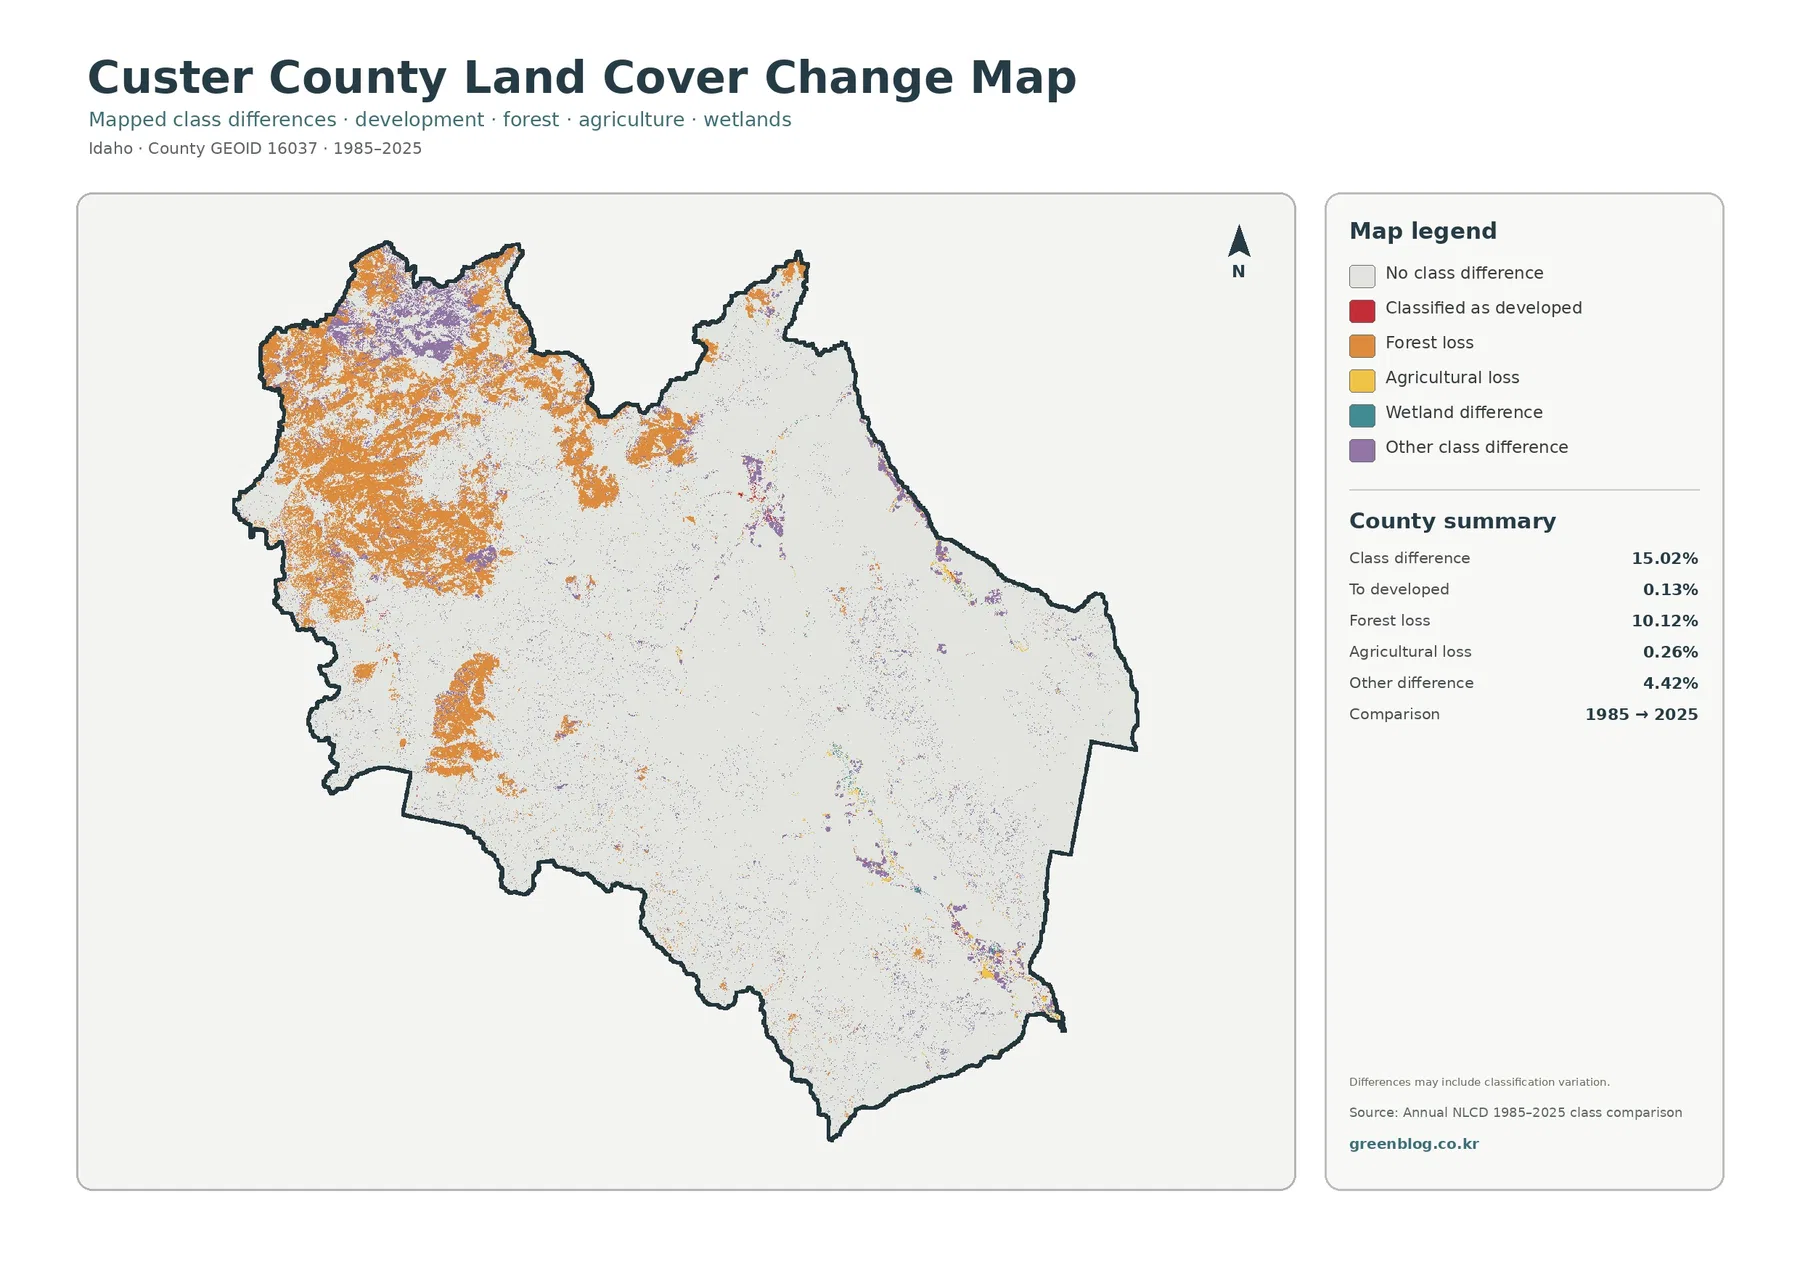
The change map reports a total class difference of 15.02%. White areas represent cells that remain in the same broad class in the two comparison years, while orange, purple, red, yellow, and teal identify different kinds of class change. Orange areas are most extensive in the west and northwest mountain country, with smaller patches scattered through the center and south.
The summary lists 0.13% as classified to developed, 10.12% in the forest-loss category, 0.26% agricultural loss, and 4.42% other class difference. The forest-loss category is the largest of those values, but it should not be rewritten as “10.12% of Custer County forest permanently disappeared.” The map itself warns that differences may include classification variation between years.
Long-term comparisons can be affected by changes in sensors, classification methods, mixed pixels, disturbance and recovery, and the timing of observations. Fire, timber activity, insects, drought, or temporary vegetation changes can alter how a cell is classified without representing the same kind of permanent land conversion. The safest use of this map is to locate areas that deserve a closer year-by-year review.
That caution is especially important in a county where forest and shrubland cover very large areas. A modest percentage shift across a huge mountain landscape can create a visually broad patch on the map. For questions about when a change occurred or whether it persisted, the intermediate Annual NLCD years and appropriate fire, forest, or local land-management records should be consulted.
Choose the map according to the question instead of treating all four as interchangeable
For a quick county overview, the general land cover map is the best starting point. It shows the 57.92% shrubland majority, the 26.37% forest network, visible barren mountain areas, and the small farm and water corridors in one frame. It works well as the first map in a report or as a same-year comparison with another county.
The forest-and-farmland map is better when the question concerns ranching, crops, hay, forest edges, or valley agriculture. Its simplified categories make the yellow cropland and pasture or hay classes easier to separate from surrounding shrub and grass. In a county where agriculture is only 1.84%, that focused view prevents the farm areas from being lost in the much larger natural classes.
The impervious map should be used when the goal is to see where roads and developed surfaces concentrate. It provides more detail about the built footprint than the general map even though the countywide mean is only 0.20%. The change map serves a different purpose: it highlights where two classifications differ across time, but it requires more caution because a class difference is not automatically a measured cause or a permanent conversion.
Land-cover classes are not parcel boundaries, zoning, or ownership records
Annual NLCD is a raster land-cover product, which means the surface is divided into grid cells and each cell receives a representative classification. The land-cover product uses 30-meter resolution. A single cell can therefore contain trees, pavement, soil, water edge, or a small structure at the same time, even though the final map shows one dominant class.
Land cover also differs from legal land use. A forest-colored cell does not establish National Forest ownership, and an agriculture-colored cell does not prove that the parcel is legally zoned for agriculture. Custer County’s comprehensive plan, zoning map, parcel records, and agency ownership data answer those administrative questions more directly.
Small percentages should be read with both the number and the map in view. Water at 0.20% and developed land at 0.69% may be nearly invisible when the map is reduced on screen, yet strong blue or red contrast can make individual features look disproportionately important when zoomed in. Combining the summary table with the geographic pattern helps keep visual prominence and actual area in balance.
A simple workflow for printing, comparing, or teaching with the maps
For printing, start with the general land cover map and keep the legend and county summary visible. The two dominant percentages—57.92% shrubland and 26.37% forest—give readers an immediate numerical anchor for the colors. Add the forest-and-farmland map only when the valley farm pattern matters, or the impervious map when settlement and roads are the main topic.
For county-to-county comparison, use the same year and the same map type on both sides. Comparing the 2025 Custer County general map with another county’s 2025 general map makes differences in shrubland, forest, agriculture, and developed land meaningful. Mixing a single-year map with a 1985-to-2025 difference map would compare different concepts and can lead to incorrect conclusions.
In a classroom or presentation, Custer County is a useful example for explaining the difference between physical land cover and administrative land use. The maps classify what covers the ground—forest, shrubland, grass, agriculture, water, or developed surfaces. They do not show ownership, grazing rights, zoning permissions, or development approvals, so those topics require separate authoritative records.
Frequently Asked Questions
What is the largest land-cover class in Custer County?
Shrubland is the largest class in the supplied 2025 summary at 57.92%. Forest follows at 26.37%, then grassland at 6.91%, barren land at 4.74%, and agriculture at 1.84%. The map reflects that ranking clearly, with broad shrubland across the center and east and major forest areas around the mountain country.
Why can farmland be easy to see if agriculture covers only 1.84%?
The agricultural classes are concentrated rather than evenly scattered. Yellow cropland and pasture or hay appear in narrow valley corridors surrounded by much larger shrubland and forest areas, so the color contrast makes them stand out. Custer County’s comprehensive plan also describes irrigated agriculture associated with the Salmon River tributaries and the Big Lost River Valley.
Does the 10.12% forest-loss category mean that much forest permanently disappeared?
No. The change map compares classifications from 1985 and 2025 and explicitly warns that classification variation may be included. The 10.12% value identifies cells placed in the forest-loss comparison category, but determining the timing, cause, and permanence of change requires intermediate annual data and relevant fire or forest-management records.
Map File Information
The four original JPG maps for Custer County are provided together in one ZIP file.
- Intended Use: printing, county comparison, classroom and presentation reference
Related Maps
Sources and references
- MRLC Annual NLCD Data – annual land cover and impervious products used for the map set
- USGS Annual NLCD Land Cover Classification – class definitions and 30-meter raster interpretation
- Custer County Comprehensive Plan – county watersheds, irrigation, valleys, and local land-use context
- University of Idaho Extension – Agriculture in Custer County – livestock, rangeland, crop, and forage programs
- Salmon-Challis National Forest – regional mountain, forest, river, and high-country context
Green Map creates custom-edited map images using open geographic data sources such as geoBoundaries, Natural Earth, OpenStreetMap, and government open data. These maps are edited visual materials, not raw data files, and are provided for education, documents, presentations, and graphic reference.