The Brantley County Georgia Land Cover Map is dominated by wetlands rather than farms or development. Wetlands account for 40.42% of the supplied 2025 summary, with forest close behind at 33.55%. Developed land represents 7.61%, shrubland 6.55%, grassland 6.10%, agriculture 5.01%, and open water 0.46%. The broadest wetland areas occupy the center and east, while the western side contains a more varied mixture of fields, open vegetation, forest, and small developed places.
Four map views are included on the page: current land cover, forest and farmland, impervious surface, and the 1985–2025 class comparison. WebP previews make the patterns easy to inspect online, and all four original JPG maps are available together in one ZIP download below. They are useful for studying a wetland-rich county where built surfaces remain concentrated around a few communities rather than spread evenly across the landscape.
Table of Contents
Hard surfaces reveal two distinct settlement areas within a mostly rural county
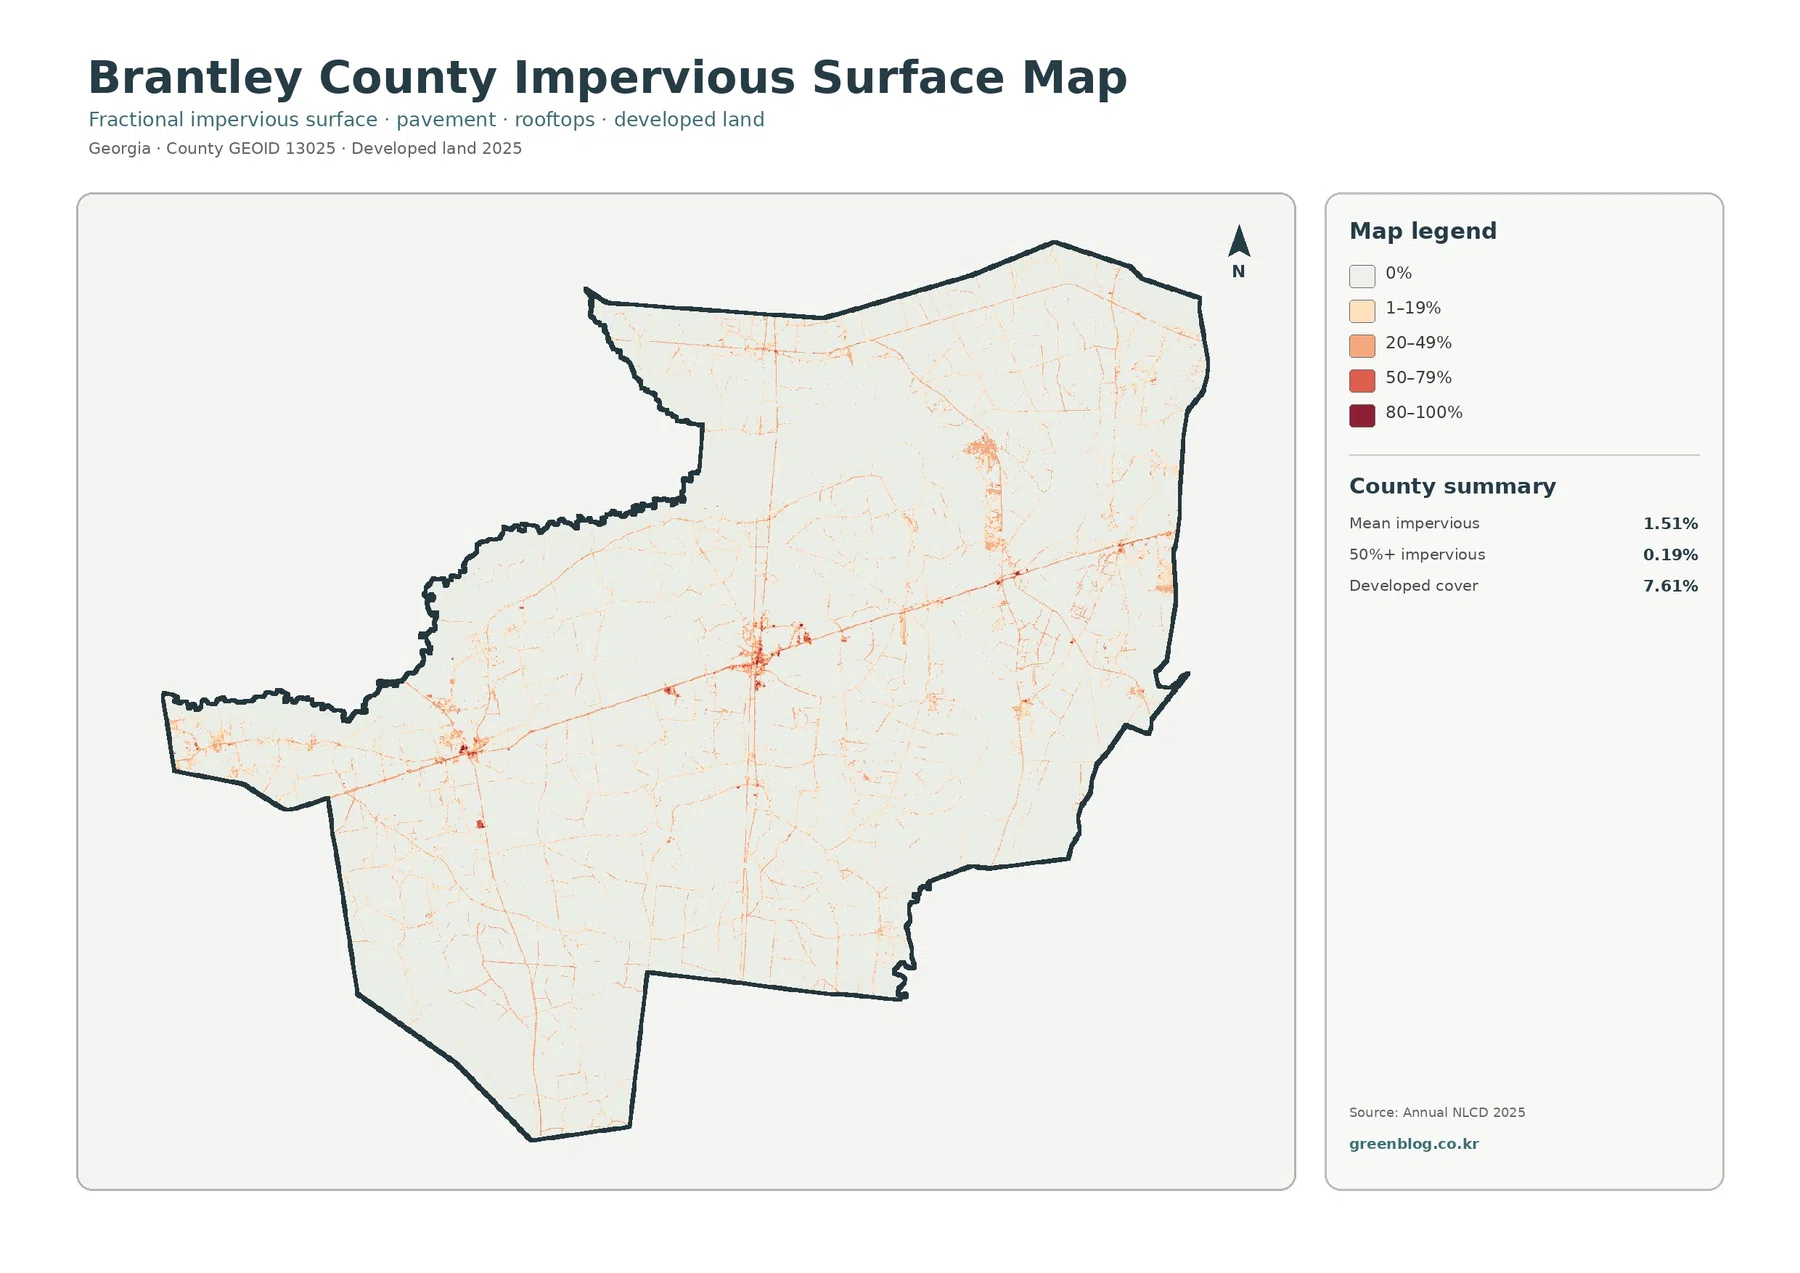
Mean impervious cover is only 1.51%, and 0.19% of Brantley County is mapped at 50% or greater impervious surface. Impervious cover refers to hard surfaces such as rooftops, paved roads, and parking areas where rainfall does not readily soak into the ground. Those figures are far below the 7.61% developed share because developed areas also contain yards, trees, soil, and other permeable surfaces.
The strongest hard-surface concentration sits near the center of the county, and another smaller but clear cluster appears in the long western projection. Thin traces connect outward from these areas, while the eastern and southeastern portions remain extremely light. Brantley County therefore has recognizable settlement centers without the broad impervious footprint found in a heavily urbanized county.
Georgia’s Department of Community Affairs maintains a joint comprehensive plan for Brantley County and the cities of Hoboken and Nahunta. County offices are concentrated in Nahunta, and official local election information also lists separate Hoboken and Nahunta precincts. Those sources provide useful community context for the two visible developed concentrations, but the raster map does not reproduce municipal boundaries.
Wetlands occupy more than forty percent of the 2025 county map
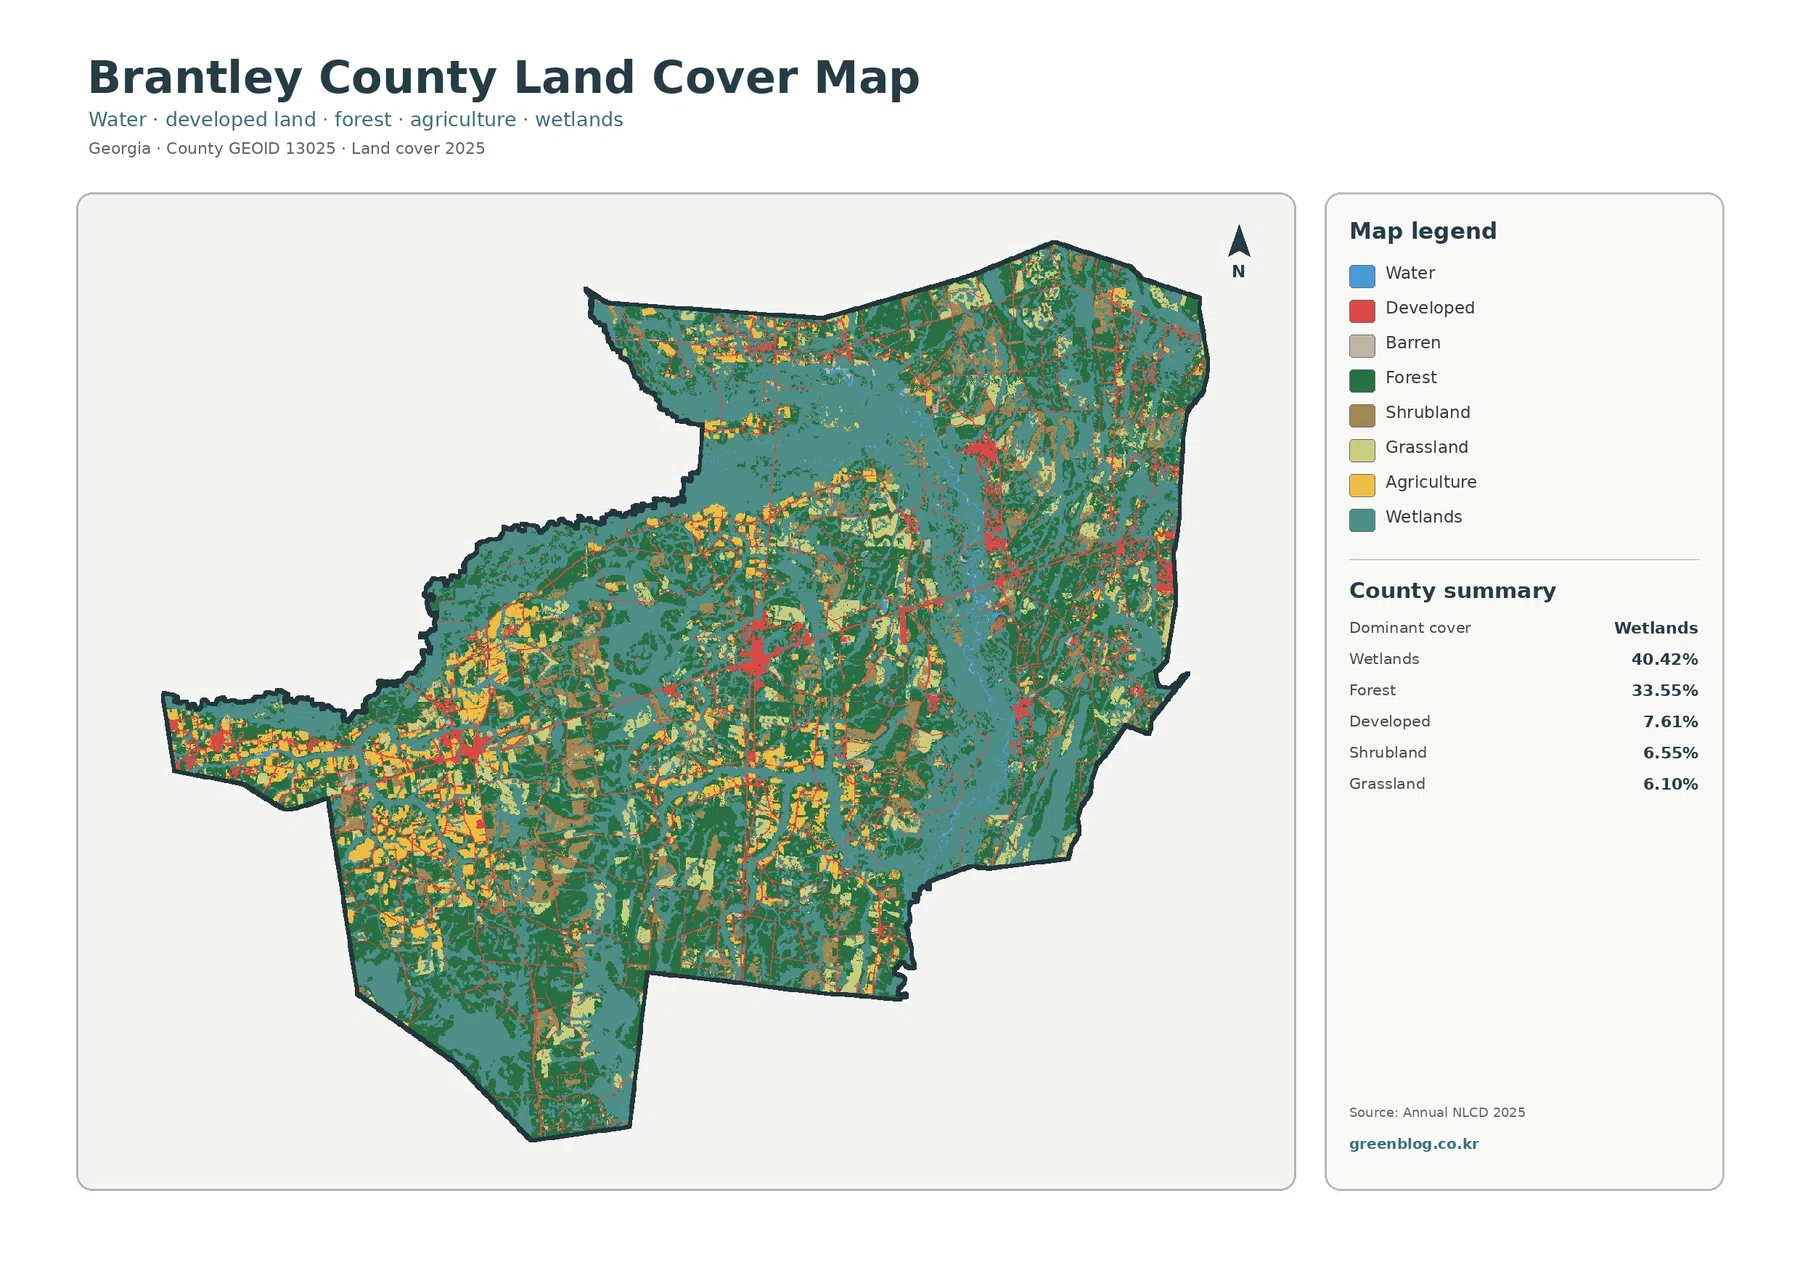
Teal wetland cover is extensive through the center and across much of the eastern half. It continues into the north and south and often forms broad areas between forest blocks. Open water is only 0.46%, so Brantley’s wet landscape is not mainly a story of visible lakes. Much of it is classified as wet ground or wetland vegetation instead.
Forest covers 33.55%. Dark-green areas are widespread in the northeast and east but also occur through central and western sections. Forest and wetlands repeatedly meet one another, creating a mixed natural landscape rather than two cleanly separated zones. Smaller areas of agriculture and open vegetation occupy breaks within that larger wetland-forest pattern.
Developed cover is 7.61%. Red cells are concentrated in the central part of the county and in the western projection, with smaller traces scattered elsewhere. Because the surrounding cover is so heavily wetland and forest, these built areas stand out clearly even though they occupy a modest countywide share.
The Satilla River provides important context for Brantley’s wet landscape
Brantley County’s official recreation information says the Satilla River winds for an estimated 50 miles through the county and that the Little Satilla runs for about 12 miles. The county also notes the many lakes, streams, and sloughs associated with the river system. That local information helps explain why water-related environments are such an important part of Brantley’s landscape.
The land-cover map itself does not label the Satilla or Little Satilla, so individual teal cells should not be assigned to a specific river channel or floodplain without another map. The useful connection is broader: a county with an extensive river and slough system also shows an unusually high 40.42% wetland share in the supplied 2025 classification.
Keeping wetlands and open water separate is essential. Blue water accounts for less than one percent of the county, while wetland cover is more than forty percent. Wetlands may contain saturated soils and wetland vegetation without appearing as open blue water, which is why the two percentages are so different.
Fading development exposes small farm areas inside a much larger wetland-forest matrix
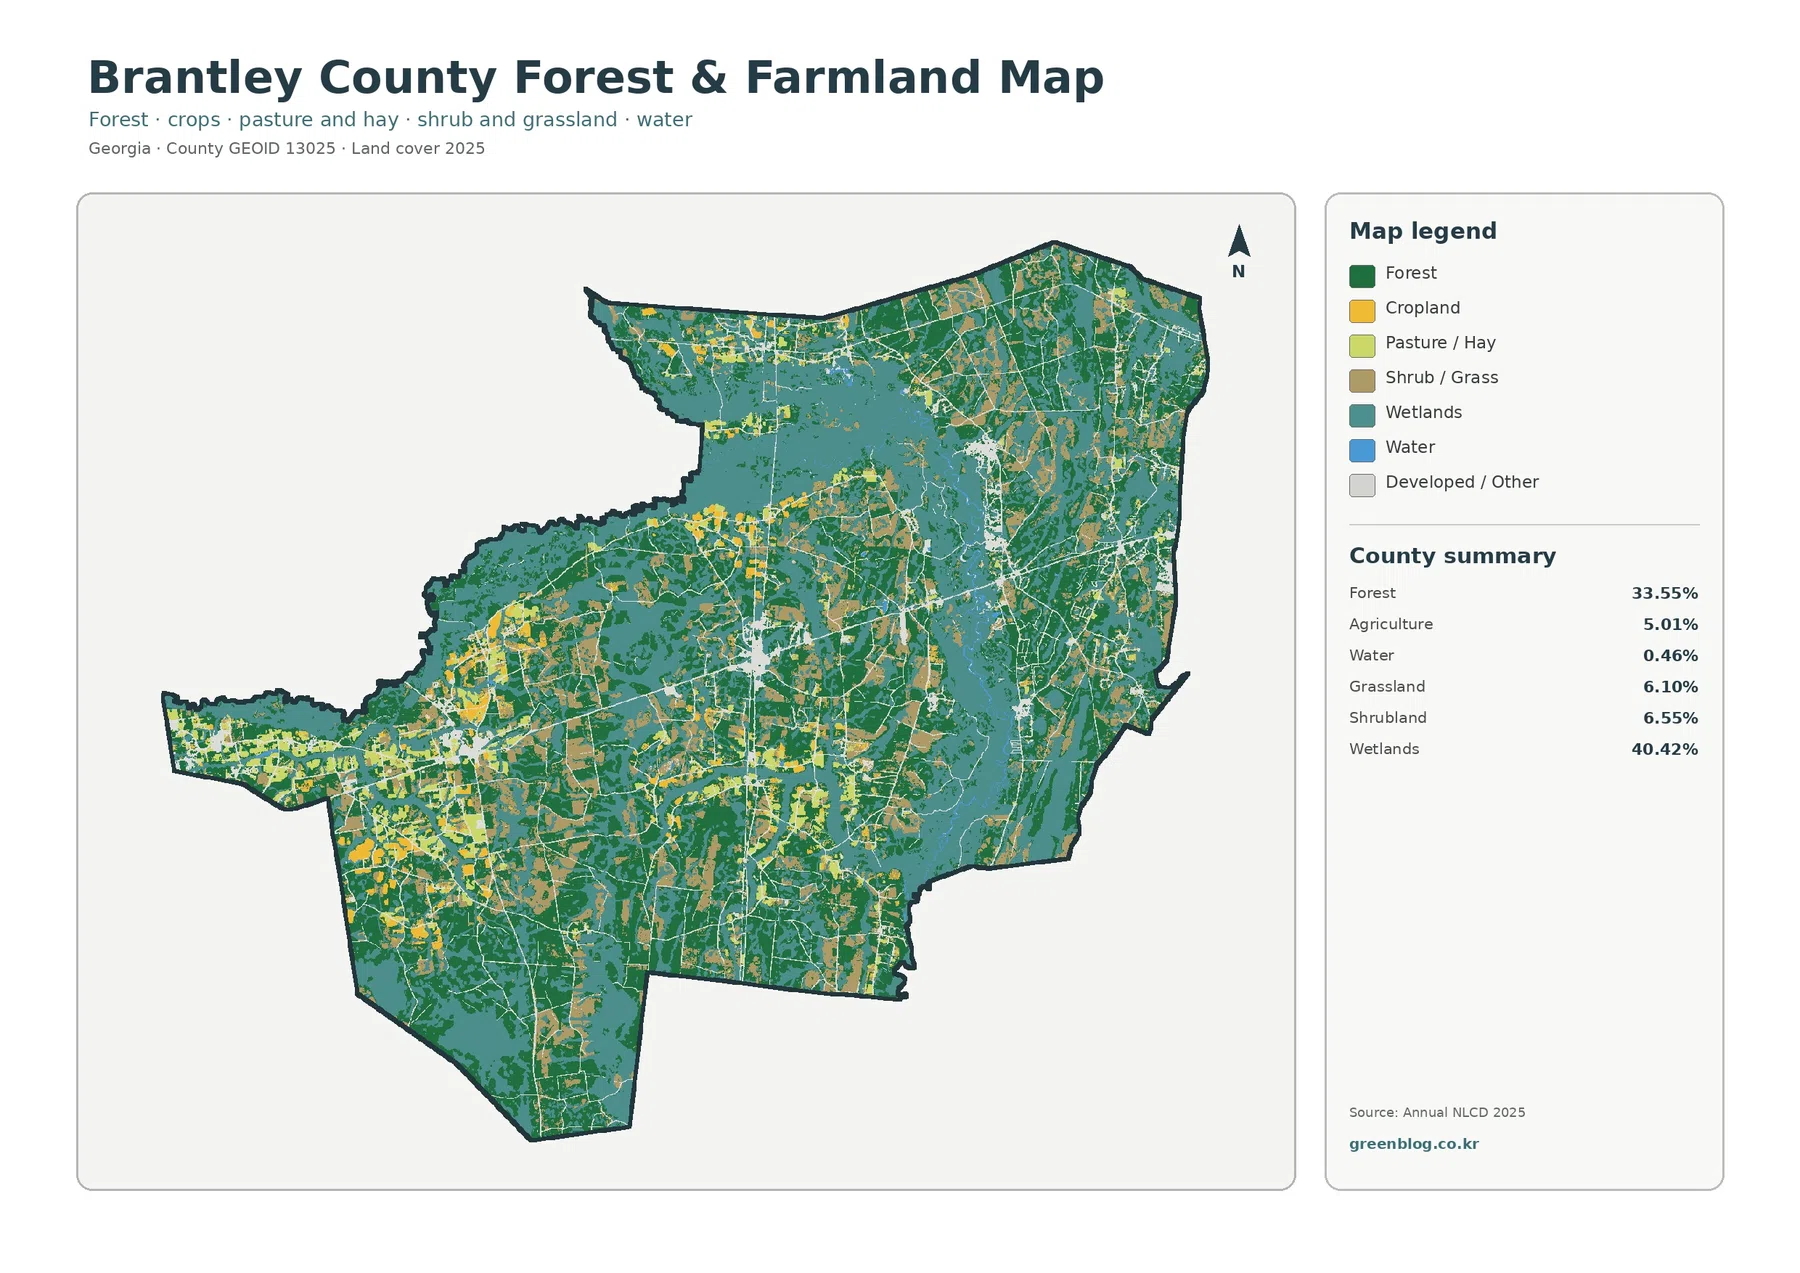
Agriculture represents 5.01% of Brantley County. Cropland is most visible in the west and southwest, with smaller pieces through central and northern areas. Once developed land is faded, the farm pattern becomes easier to follow, but it remains small compared with the surrounding wetland and forest cover.
The legend separates cropland from pasture or hay, yet the package supplies one verified agriculture total rather than exact subtype percentages. The safest use of the map is to compare where those farm-related colors occur. Estimating a new cropland or pasture percentage from colored pixels would go beyond the data provided in the county package.
Shrubland at 6.55% and grassland at 6.10% are each larger than agriculture. Those classes appear throughout the county, including areas near farms, forest edges, and developed places. This is a useful reminder that open-looking ground is not automatically agricultural and that Brantley’s non-wetland landscape includes several kinds of vegetation.
UGA Extension Brantley County offers soil, water, and plant analysis together with guidance on forestry, livestock, horticulture, ponds, and production agriculture. Its local impact information estimates an annual farm-gate value of about $85 million. That county-specific context shows that agriculture can remain economically important even where its mapped land-cover share is relatively small.
Forest loss and “other difference” make up most of the 1985–2025 endpoint changes
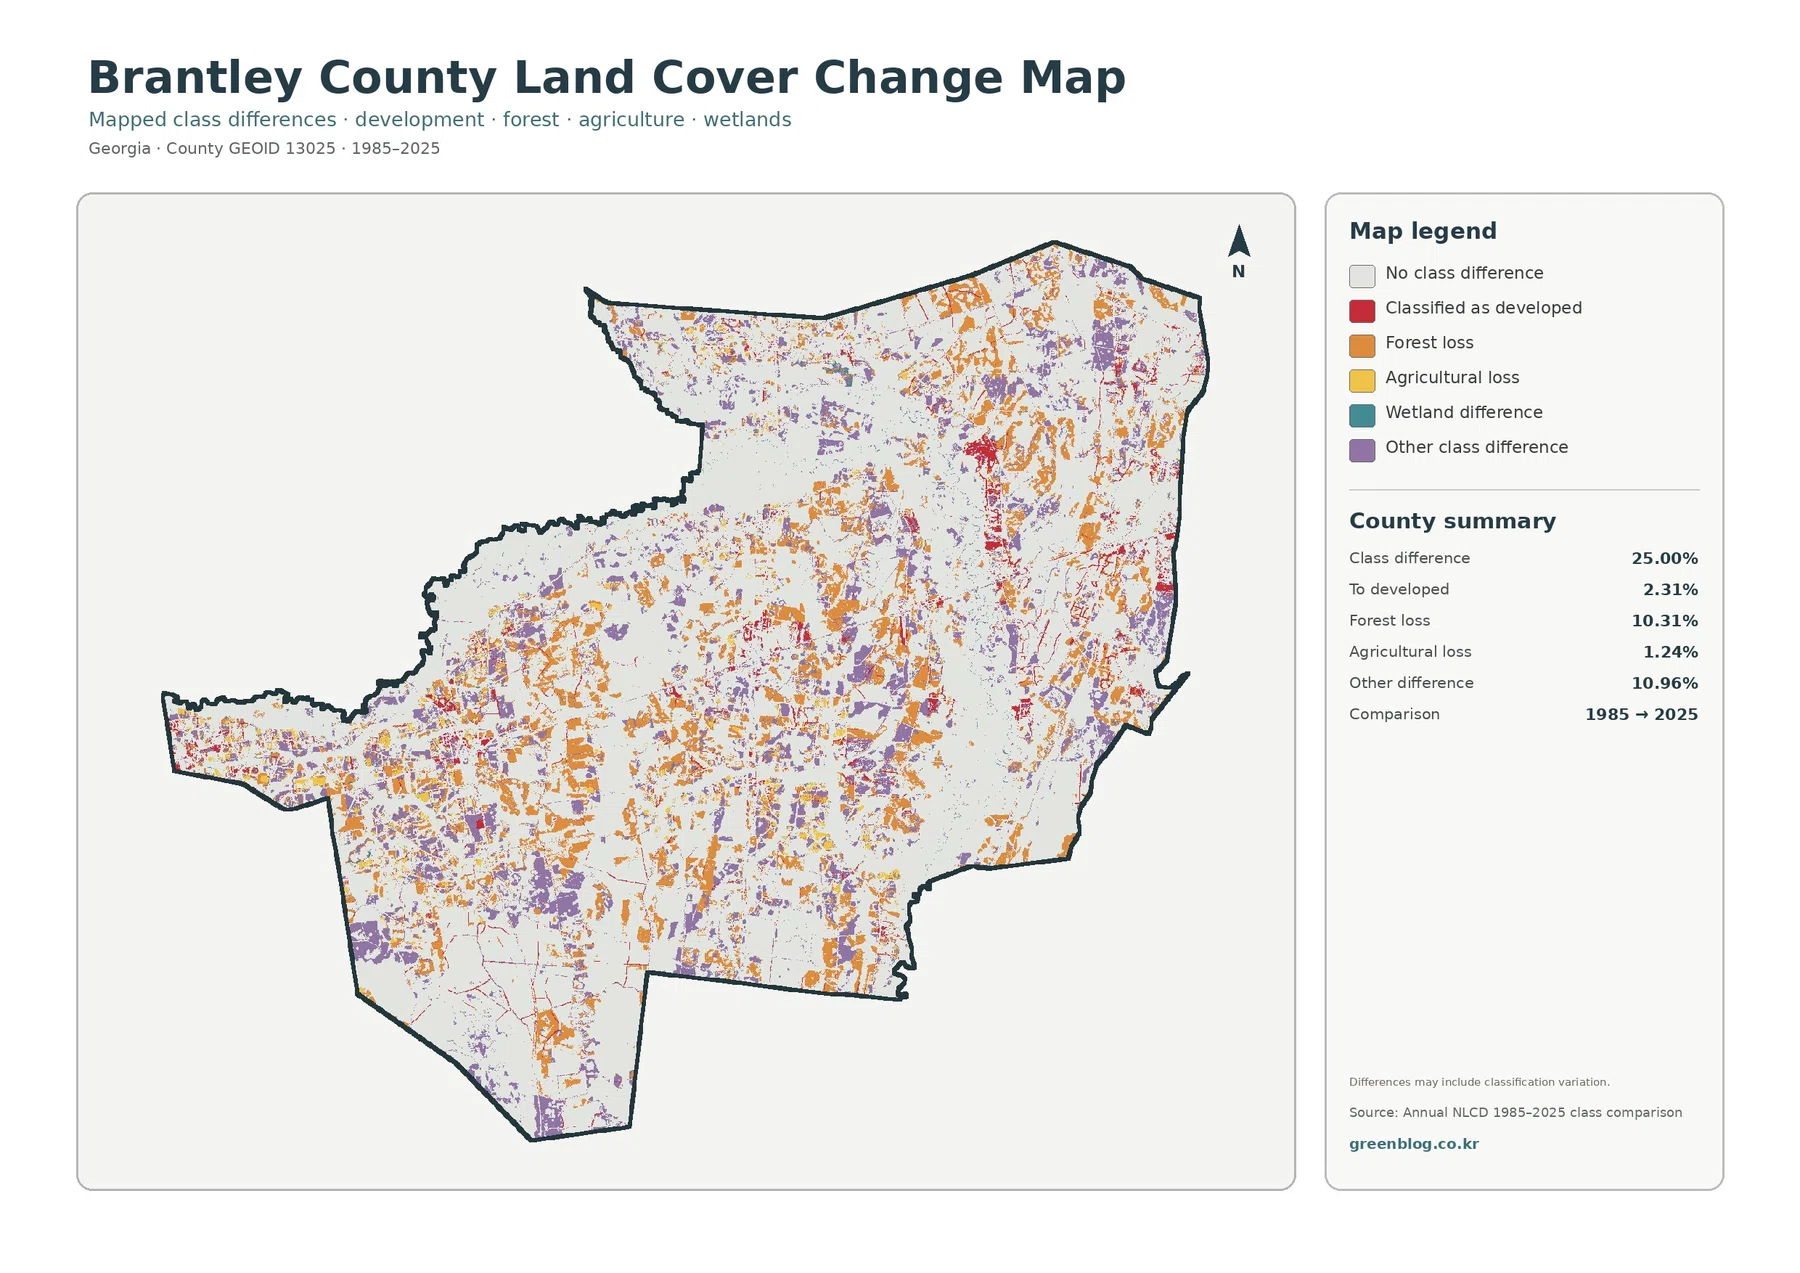
The total class difference between 1985 and 2025 is 25.00%. That does not mean exactly one quarter of Brantley County was physically transformed. The value measures raster cells assigned different cover classes at the two endpoints. Real land change can contribute, but season, imagery conditions, mixed cells, and classification methods may also affect whether a location receives the same class in both years.
Forest loss accounts for 10.31%, while other class difference is 10.96%. Orange and purple cells are scattered across the county, including the southwest, center, north, and east. The current forest share of 33.55% and the 10.31% forest-loss category should not be combined mathematically to reconstruct a 1985 forest percentage.
Cells classified as developed represent 2.31% of the endpoint comparison, and agricultural loss is 1.24%. Red developed differences are most noticeable around the current settlement areas and along several narrow traces. Wetland difference is present in the legend but the supplied county summary does not provide a separate exact percentage for it.
Change colors appearing next to one another are not enough to establish cause. A forest-loss cell beside a developed difference may reflect land conversion, but forestry activity, vegetation recovery, moisture changes, weather, or classification variation could also matter. Explaining one site requires imagery from additional years or local land-use records.
Frequently Asked Questions
What is the largest 2025 land-cover class in Brantley County?
Wetlands are the largest class at 40.42%, followed by forest at 33.55%. Developed land is 7.61%, shrubland 6.55%, grassland 6.10%, agriculture 5.01%, and water 0.46%. Wetlands are especially extensive through the center and east, while the western side contains more mixed rural and developed cover.
Why is developed land 7.61% while mean impervious cover is only 1.51%?
Developed land can include yards, trees, soil, and other permeable surfaces around buildings and roads. Impervious cover isolates the harder portion such as rooftops, pavement, and parking areas. Only 0.19% of the county is mapped at 50% or greater impervious surface, so heavily hardened ground is very limited.
Does the 25.00% class difference equal the area that physically changed?
No. Instead, the 25.00% figure is the portion of mapped cells whose endpoint classes differ between 1985 and 2025. Supplied components include 2.31% classified as developed, 10.31% forest loss, 1.24% agricultural loss, and 10.96% other difference. Classification variation may be included, so specific causes need additional evidence.
A presentation can start with the wetland majority and then zoom in on settlement
The 2025 overview is the strongest opening image for a county profile because the wetland majority and broad forest are immediately visible. The impervious map is a good second choice when the question turns to Nahunta, Hoboken, or other settled areas, since it isolates the relatively small places where rooftops and pavement are concentrated.
For agriculture, forestry, or vegetation topics, the forest-and-farmland view gives a cleaner picture of the smaller farm areas and the much larger natural cover. The change map should come later, after the audience understands that its colors represent 1985–2025 endpoint differences rather than current land cover. A Satilla River reference is most useful when paired with a separate hydrography source because the land-cover maps do not label river channels.
Land cover is not a land-use ordinance, parcel boundary, or ownership map
Annual NLCD divides the landscape into raster cells and assigns one representative cover class to each. A real location may contain wetland vegetation, trees, a road, a house, grass, and bare soil within a short distance, while the raster simplifies that mixture. Boundaries between wetland and forest or between settlement and rural cover should therefore be treated as generalized.
A developed cell does not establish zoning or development permission, and forest or wetland colors do not identify ownership or legal protection. Brantley County’s official website separately explains its Land Use Ordinance and review process. Property-specific planning questions require those local records rather than the land-cover classification.
The source JPG files are each 2480×1754 pixels. Enlarging them can make small colored areas easier to inspect, but it cannot add information beyond the original data. The package manifest does not mark these maps as meeting its A3 high-resolution reference. They are useful for screens, presentations, routine printing, and county comparison, while large-format output should be tested at the intended size.
Map File Information
The ZIP contains four original JPG maps covering Brantley County's 2025 land cover, forest and farmland, impervious surface, and 1985–2025 class differences.
- Included Files: 4 original JPG land cover map files shown in this article
- File Type: JPG files in a ZIP archive
- Intended Use: Printing, education, presentations, and map-based projects
Related Maps
- Appling County Georgia Land Cover Map
- Atkinson County Georgia Land Cover Map
- Bacon County Georgia Land Cover Map
Sources and Reference Data
- MRLC Annual NLCD Data – annual source data for Brantley County’s 2025 cover map and 1985–2025 endpoint comparison.
- USGS Annual NLCD Land Cover Classification – official class guidance used to interpret Brantley’s wetland, forest, developed, agricultural, and related cover categories.
- U.S. Census Bureau TIGER/Line Shapefiles – official county-boundary reference for Brantley County.
- UGA Extension Brantley County – Our Impact – county-specific agriculture, forestry, livestock, and natural-resource context.
- Georgia DCA – Brantley County, Hoboken & Nahunta Comprehensive Plan – official planning resources for the county and its two cities.
- Brantley County – Satilla River & Boating – official local context for the Satilla and Little Satilla river systems.
Green Map creates custom-edited map images using open geographic data sources such as geoBoundaries, Natural Earth, OpenStreetMap, and government open data.
These maps are edited visual materials, not raw data files, and are provided for education, documents, presentations, and graphic reference.