DeWitt County sits in south-central Texas with Cuero near the middle of its road network, Yorktown and Nordheim to the west, and the Guadalupe River cutting through the county from north to southeast. The county map is useful for roads and boundaries, while the city map simplifies the relationship among the three principal labeled communities. The water map brings the Guadalupe River, Sandies Creek, McCoy Creek, and smaller tributaries forward, and the elevation map shows why the western and northern parts of the county look different from the lower river corridor. High-resolution A3 JPG versions of the supplied maps are available in a ZIP download near the end of the page.
A good way to orient yourself is to start with Cuero. It is the county seat, several major highways meet there, and the Guadalupe River passes close enough that transportation and physical geography can be compared in the same part of the map. From Cuero, Yorktown lies to the southwest and Nordheim farther west. The western side is generally higher and more dissected by small valleys, while the central and southeastern river corridor sits lower. That contrast gives DeWitt County a more varied landscape than a quick glance at the boundary alone might suggest.
Table of Contents
Cuero as the Road Reference Point
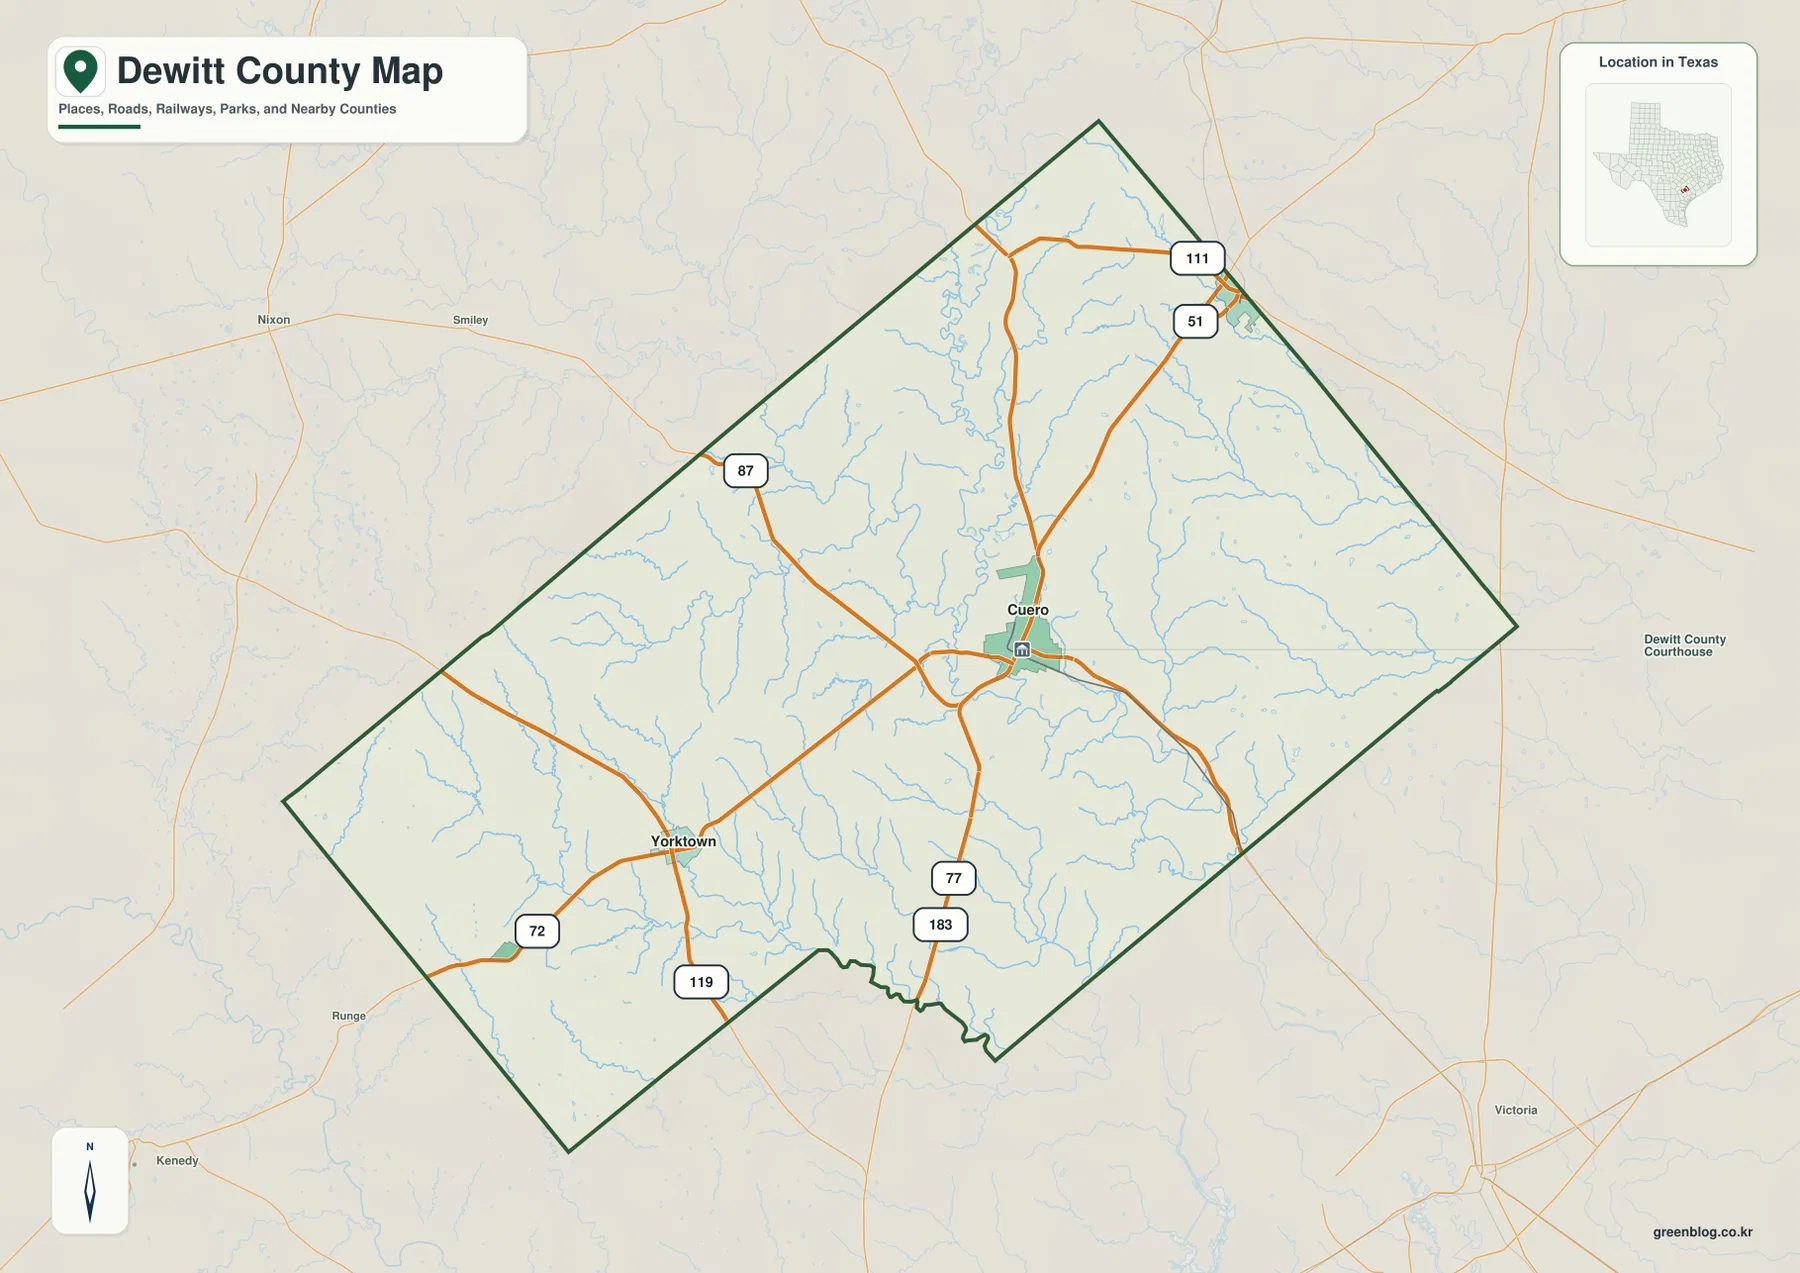
On the county map, Cuero is slightly east of center and sits where U.S. 87, U.S. 183, and U.S. 77 Alternate come together. The Texas State Historical Association’s Cuero entry also identifies the city at the convergence of U.S. 183, 77A, and 87. U.S. 87 crosses the county on a northwest-to-southeast path through Cuero toward Victoria, while the 183 and 77 corridor continues south from town. Because so many routes meet in one place, Cuero works as the clearest reference point for reading both local travel and the county’s relationship with the Victoria area.
West of Cuero, State Highway 72 runs through Yorktown, giving the western part of the county a direct connection to the county seat. Route 119 is also shown near Yorktown, while the northern part of the map includes route markers 111 and 51. Rather than treating each number as a separate map lesson, it is more useful to notice the pattern: roads converge on Cuero, then fan out toward Yorktown and the western ranch country, toward the north, and toward Victoria in the southeast. The spacing between roads also changes, with denser connections around Cuero and broader open areas toward the county’s outer edges.
The boundary itself is not a simple rectangle. DeWitt County stretches farther to the southwest, and the south-central edge bends inward before turning southeast. Nearby places such as Nixon, Smiley, Runge, Kenedy, and Victoria appear outside the county on the general map, helping place DeWitt in a broader regional setting. These labels are useful for orientation, but the map is not a live navigation product; current road closures, construction, and driving directions should always be checked with an up-to-date transportation service.
Cuero, Yorktown, and Nordheim on the City Map
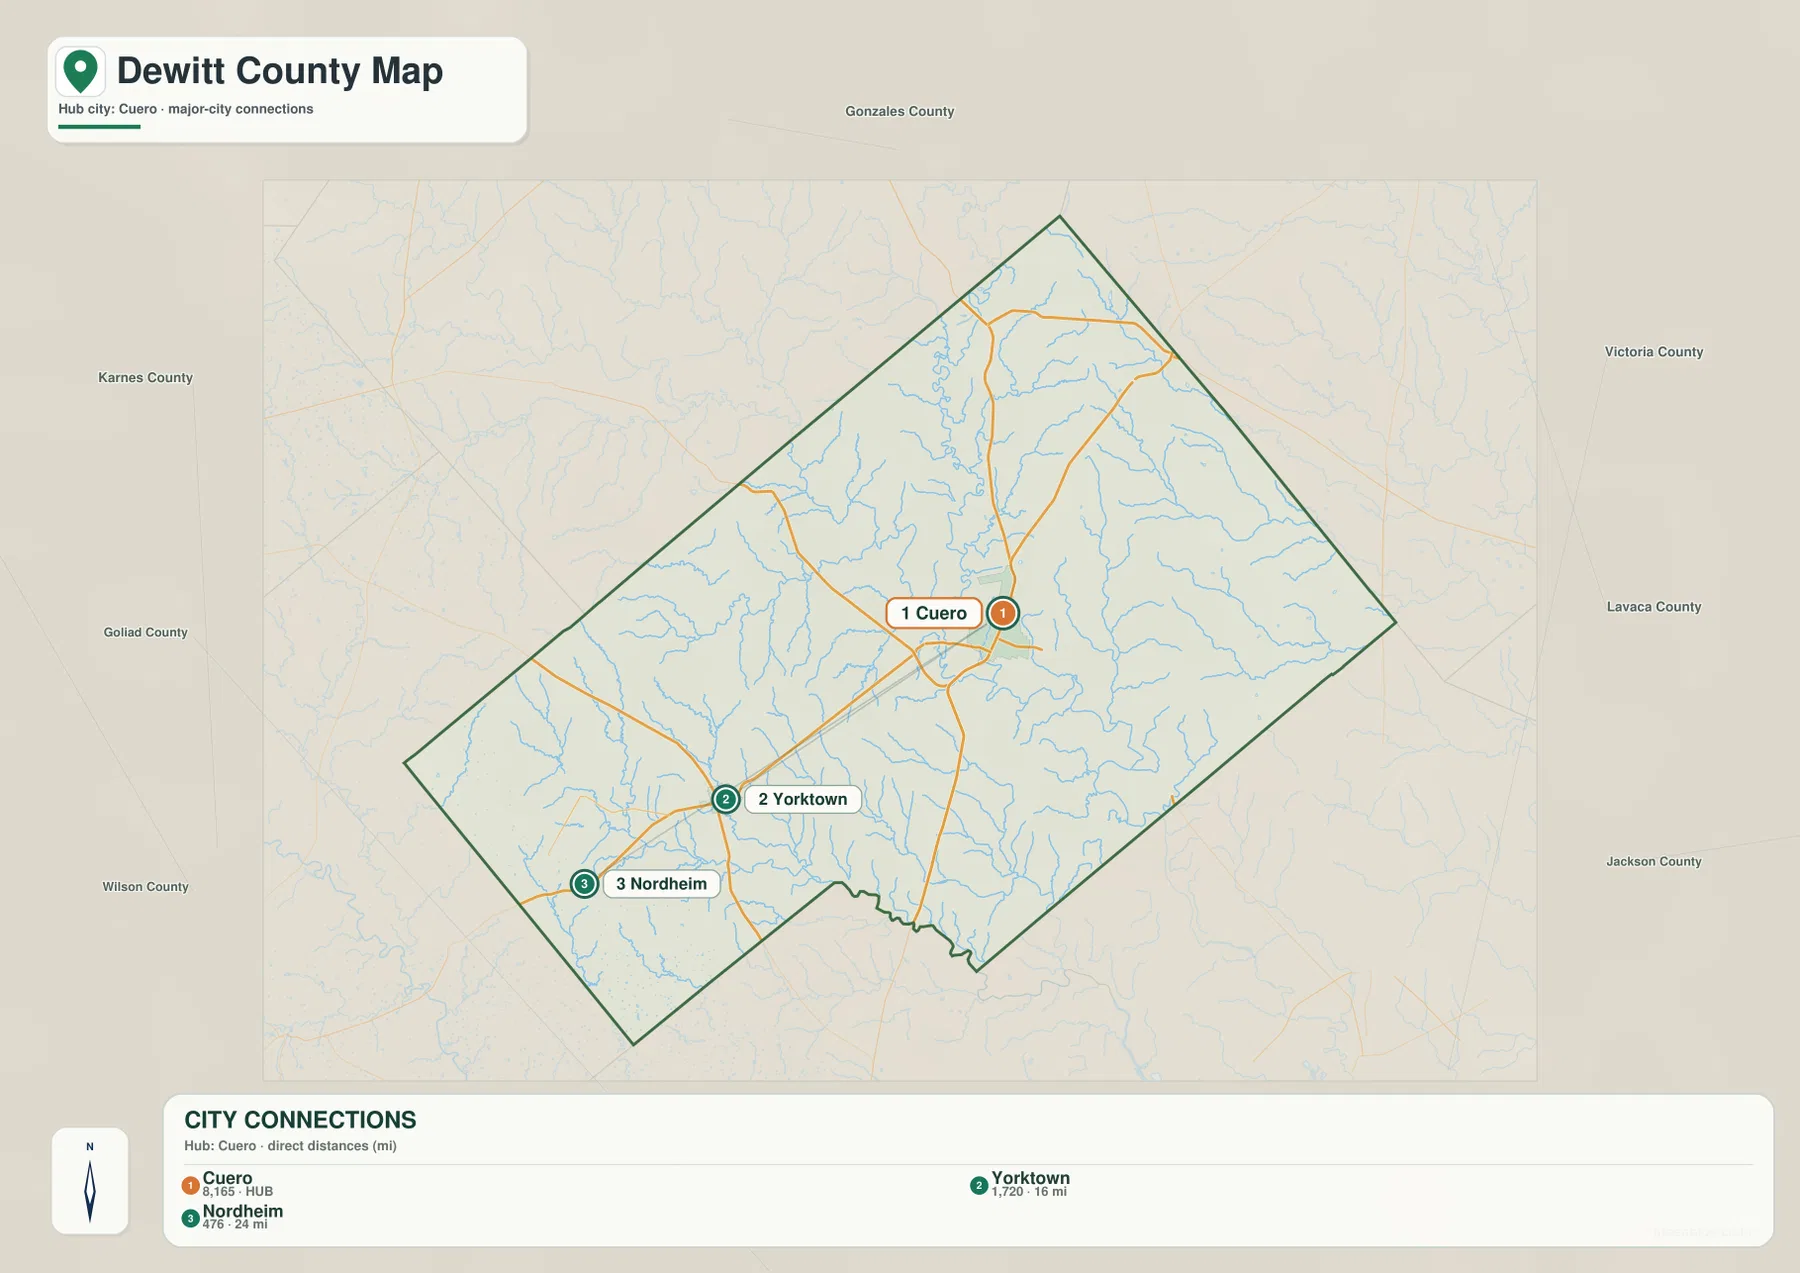
The city-connections map strips away some of the road detail and emphasizes three labeled communities. Cuero is ranked first and serves as the hub. Yorktown is shown about 16 miles to the southwest, while Nordheim is farther west at about 24 miles. The map specifically describes these as direct distances from Cuero, so they should be read as straight-line distances rather than road mileage. Actual driving routes are longer because they follow the highway network rather than a direct line between the city markers.
The map’s city index lists Cuero at 8,165, Yorktown at 1,720, and Nordheim at 476. Those values are useful for understanding the relative scale used by this particular city map, though readers who need current population estimates should check the latest Census data. Cuero is clearly the dominant labeled center, but Yorktown and Nordheim make the west side of the county easier to read. Yorktown sits where the western road network becomes more concentrated, while Nordheim lies even farther west in a more open landscape.
Comparing the city map with the elevation map adds another layer. Cuero is close to the lower Guadalupe River corridor, whereas Yorktown and Nordheim sit nearer the higher western terrain. The difference is not dramatic mountain relief, but it is large enough to change the texture of the landscape: the west has more closely spaced ridges and small valleys, while the river corridor is broader and lower. This is why the three-city map becomes more informative when it is not viewed by itself.
Guadalupe River and the Creeks Feeding the Central Valley
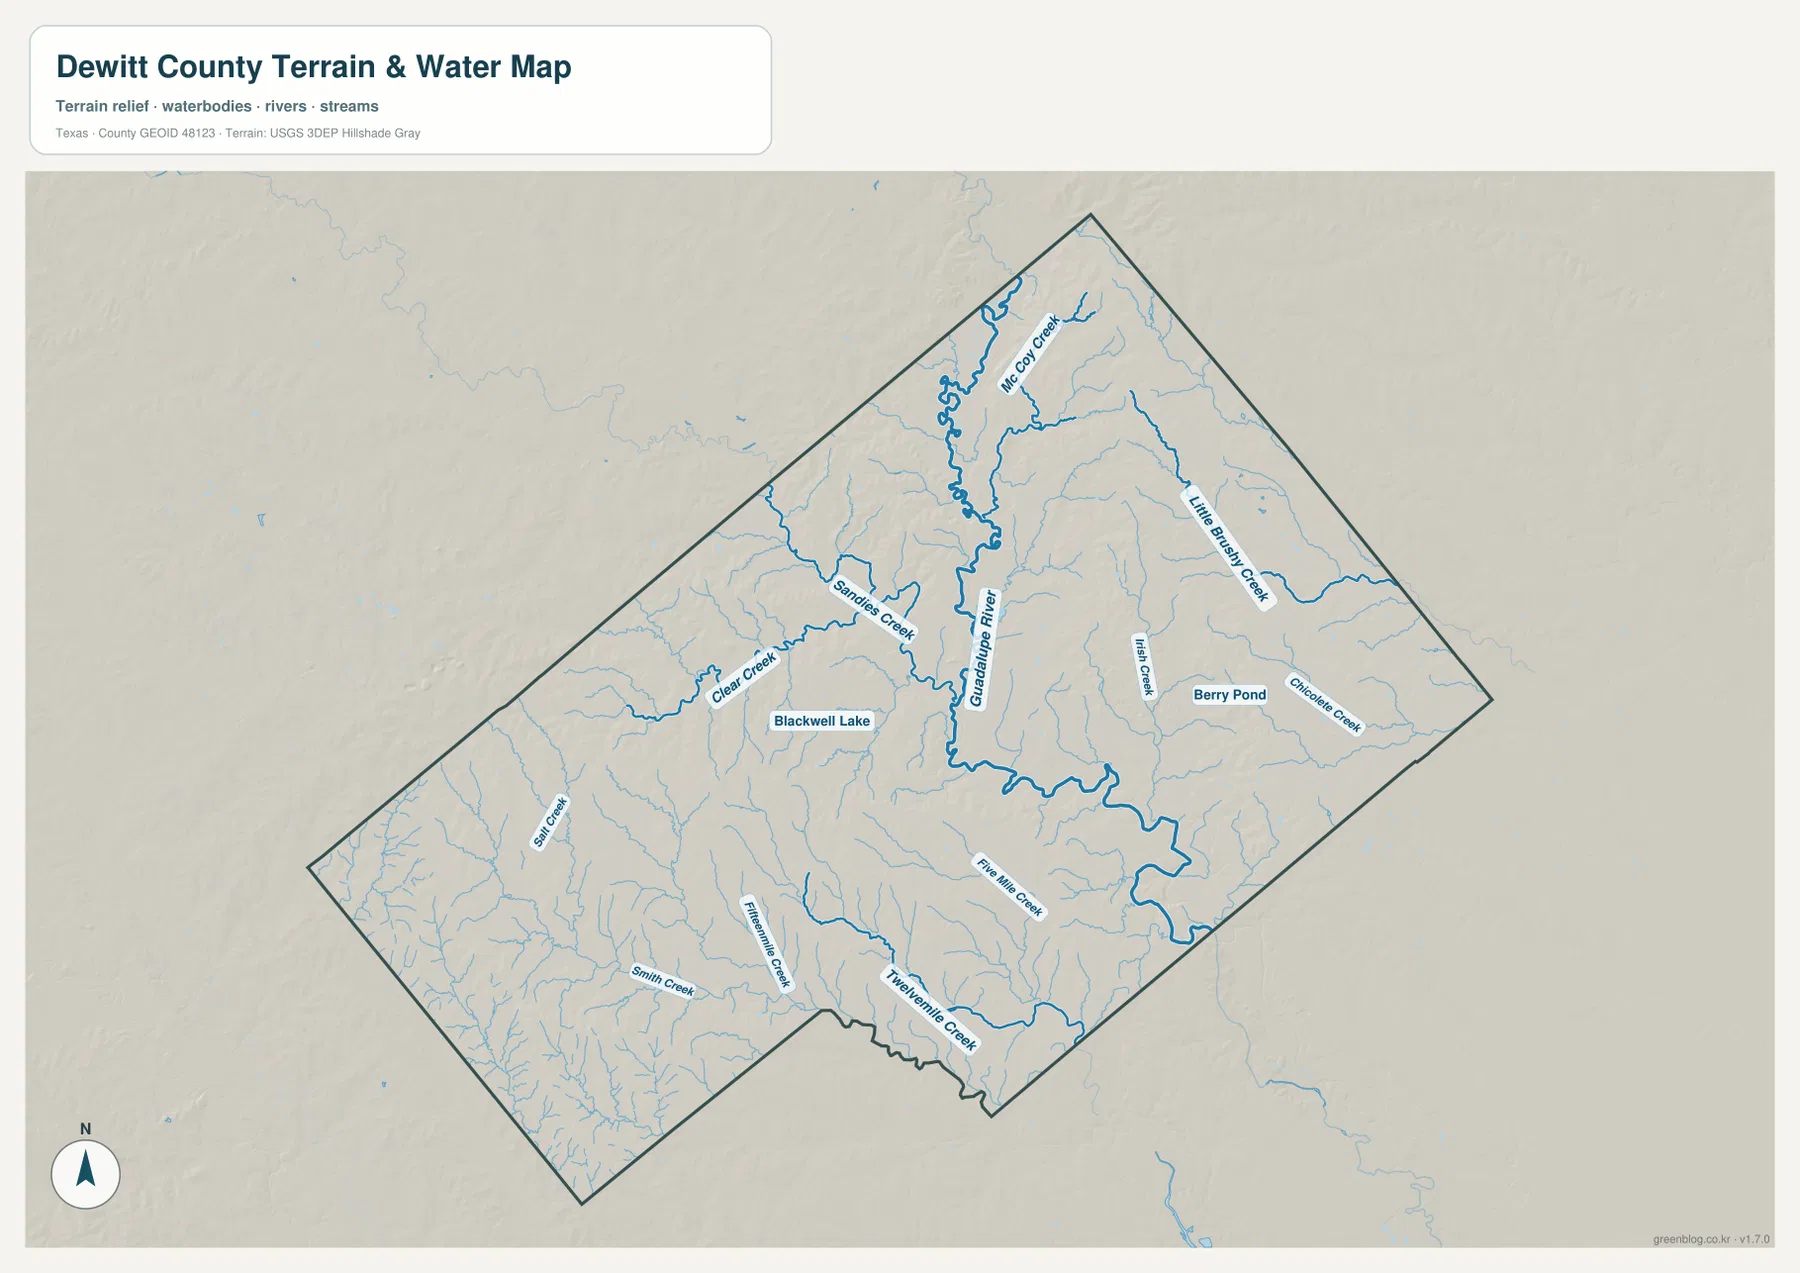
The Guadalupe River is the dominant feature on the water map. It enters the northern part of DeWitt County, bends through the center, and continues southeast toward the county boundary. The Guadalupe-Blanco River Authority maintains DeWitt County monitoring locations on the Guadalupe River near Cuero and on Sandies Creek, confirming the importance of both waterways in the local basin. On the supplied map, the river is drawn much more strongly than on the general county map, making its bends and tributary junctions easy to follow.
Several named creeks join or approach the Guadalupe system. McCoy Creek appears in the north-central part of the county, Sandies Creek crosses the northwest and central area, and Clear Creek is labeled farther west. Irish Creek and Little Brushy Creek are visible to the east, while the southwest contains smaller branches including Salt Creek, Smith Creek, and Twelve Mile Creek. Berry Pond and Blackwell Lake are also marked. The Texas State Historical Association’s DeWitt County profile names many of the same tributaries—Sandies, Salt, Smith, McCoy, Irish, Cuero, and Clear creeks—along with branches of Coleto Creek.
These waterways help explain why the county is not uniformly flat even though it lies on the Gulf Coastal Plain. Small streams cut shallow valleys into the higher western ground, then converge toward the lower central and eastern areas. The Guadalupe River corridor is especially clear when the water and elevation maps are compared side by side. Near Cuero, the river occupies a lower green band, while the terrain becomes higher toward Yorktown and the southwest. The water map should not be used as a flood-zone, parcel, or navigation map; for current river conditions and flood information, use official local and river-authority sources.
Western High Ground and the Lower Guadalupe Corridor
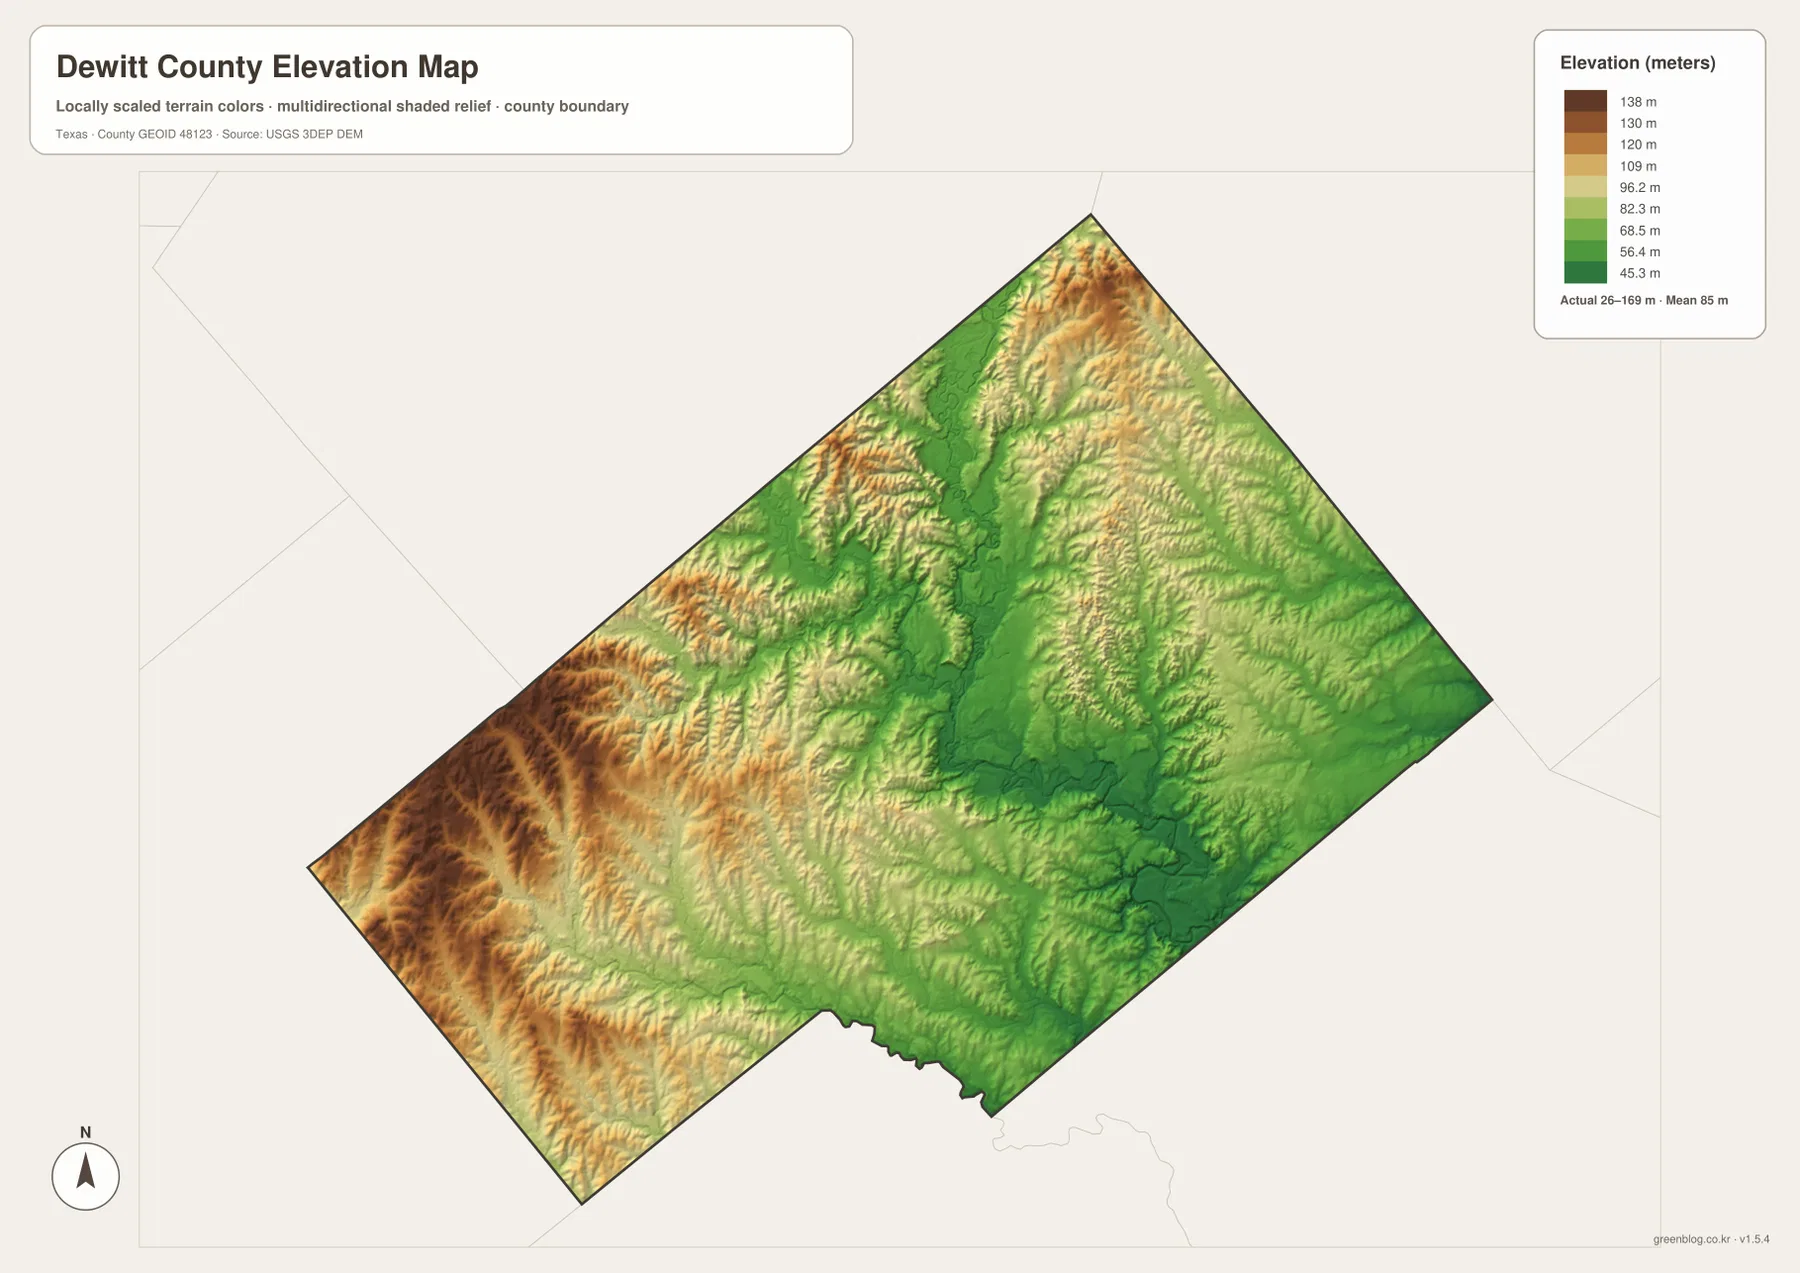
The elevation map uses locally scaled colors to show an actual range of about 26 to 169 meters, with a mean near 85 meters. The highest colors are concentrated in the southwest and across parts of the western side, with another band of higher ground near the north. By contrast, the Guadalupe River forms a long green lowland through the central part of the county before turning southeast. The map therefore shows a broad west-to-east and west-to-river drop rather than a single uniform plain.
The southwest is particularly textured. Brown and tan ridges are separated by many narrow valleys, producing a closely folded appearance in the shaded relief. Moving east, those colors fade into yellow-green and then darker green near the major drainage. The TSHA county profile describes the county as mostly nearly level to sloping, with higher elevations concentrated mainly in the western and northwestern portions and much lower ground toward the east. That general description matches the pattern visible in the supplied elevation map.
This elevation layer is best used for regional comparison, not engineering or survey work. It can show that Cuero and the river lie in a lower setting than much of the western county, and it can help explain why tributaries descend toward the Guadalupe system. It is also useful for interpreting the road map: major highways cross broad terrain efficiently, while smaller roads in the western part encounter more frequent ridges and creek valleys. The relief is modest by mountain standards, but it has a clear effect on the way the county looks from one side to the other.
Which DeWitt County Map Works Best for Your Task?
Use the general county map first when the question involves roads, the county boundary, or the relationship between Cuero and Yorktown. It keeps the main highways, waterways, and nearby communities in one frame. The city map is cleaner when the main goal is to compare Cuero, Yorktown, and Nordheim without as much background detail, especially if the straight-line distances from the Cuero hub are useful. For river and creek questions, the water map is the better starting point because tributary names and the Guadalupe channel are much easier to follow.
The elevation map becomes most useful after the water map. Once the Guadalupe River and the western creeks are located, the color changes show how those waterways relate to lower valleys and higher ridges. In a classroom exercise, a student can mark Cuero and Yorktown on the county map, trace the Guadalupe and Sandies Creek on the water map, and then compare the same places on the elevation map. That sequence connects settlement, roads, drainage, and relief without requiring advanced GIS terminology.
For printing, presentations, or local reference work, the downloadable JPG files provide a larger source than the WebP images displayed in the article. The package contains the general county map, city-connections map, water map, and elevation map in high-resolution A3 format. You do not need to use all four for every project: choose the county map for road context, the city map for settlement spacing, the water map for streams, and the elevation map for terrain comparison.
Frequently Asked Questions
Why is Cuero the best place to start on a DeWitt County map?
Cuero is the county seat, U.S. 87, U.S. 183, and U.S. 77 Alternate meet there, and the Guadalupe River passes nearby. Starting at Cuero makes it easy to trace roads toward Yorktown and Victoria, compare the western communities, and then switch to the water map without losing your geographic reference point.
Are the 16-mile and 24-mile city-map distances driving distances?
No. The city-connections map identifies Cuero as the hub and uses direct distances to Yorktown and Nordheim. They are straight-line measurements, so the mileage of an actual road trip will be longer and depends on the route taken.
Why does the Guadalupe River corridor appear lower on the elevation map?
The river follows a lower valley through the central and southeastern part of the county. The supplied elevation map shows higher ground across much of the west and southwest, while the Guadalupe corridor is a long green band. Comparing it with the water map shows tributaries descending from higher terrain toward the main river.
Map File Information
The ZIP contains the DeWitt County general map, city-connections map, water map, and elevation map as high-resolution A3 JPG files. Use these larger originals when you need a printable copy or more detail than the WebP images shown on the page.
- File Type: JPG
Related Maps
- Victoria County Texas map
- Refugio County Texas map
- Wilson County Texas map
- Atascosa County Texas map
- San Patricio County Texas map
Sources and References
The geographic descriptions were checked against the supplied maps and the following official or authoritative references.
- DeWitt County Texas – Official County Website
- Texas State Historical Association – DeWitt County
- Texas State Historical Association – Cuero, TX
- Texas State Historical Association – Yorktown, TX
- Guadalupe-Blanco River Authority – DeWitt County Monitoring Sites
- USGS 3D Elevation Program
Green Map creates custom-edited map images using open geographic data sources such as geoBoundaries, Natural Earth, OpenStreetMap, and government open data.
These maps are edited visual materials, not raw data files, and are provided for education, documents, presentations, and graphic reference.