Haralson County in northwest Georgia is mostly forested on the 2025 land-cover map, but its developed land does not form one continuous urban area. Instead, distinct built clusters appear in the west, near the county center, and in the southeast. Forest accounts for 62.33% of the mapped cover, followed by agriculture at 13.48% and developed land at 12.08%. The four maps on this page separate those broad patterns from farmland, impervious surfaces, and mapped change between 1985 and 2025.
The four original JPG maps used for this article are available together in one ZIP download below. They are useful when you want to compare Tallapoosa, Buchanan, Bremen, and the more rural parts of Haralson County at a larger size, print the legends, or place the maps in a classroom, presentation, or reference document.
Table of Contents
A forested county with separate built centers rather than one continuous urban belt
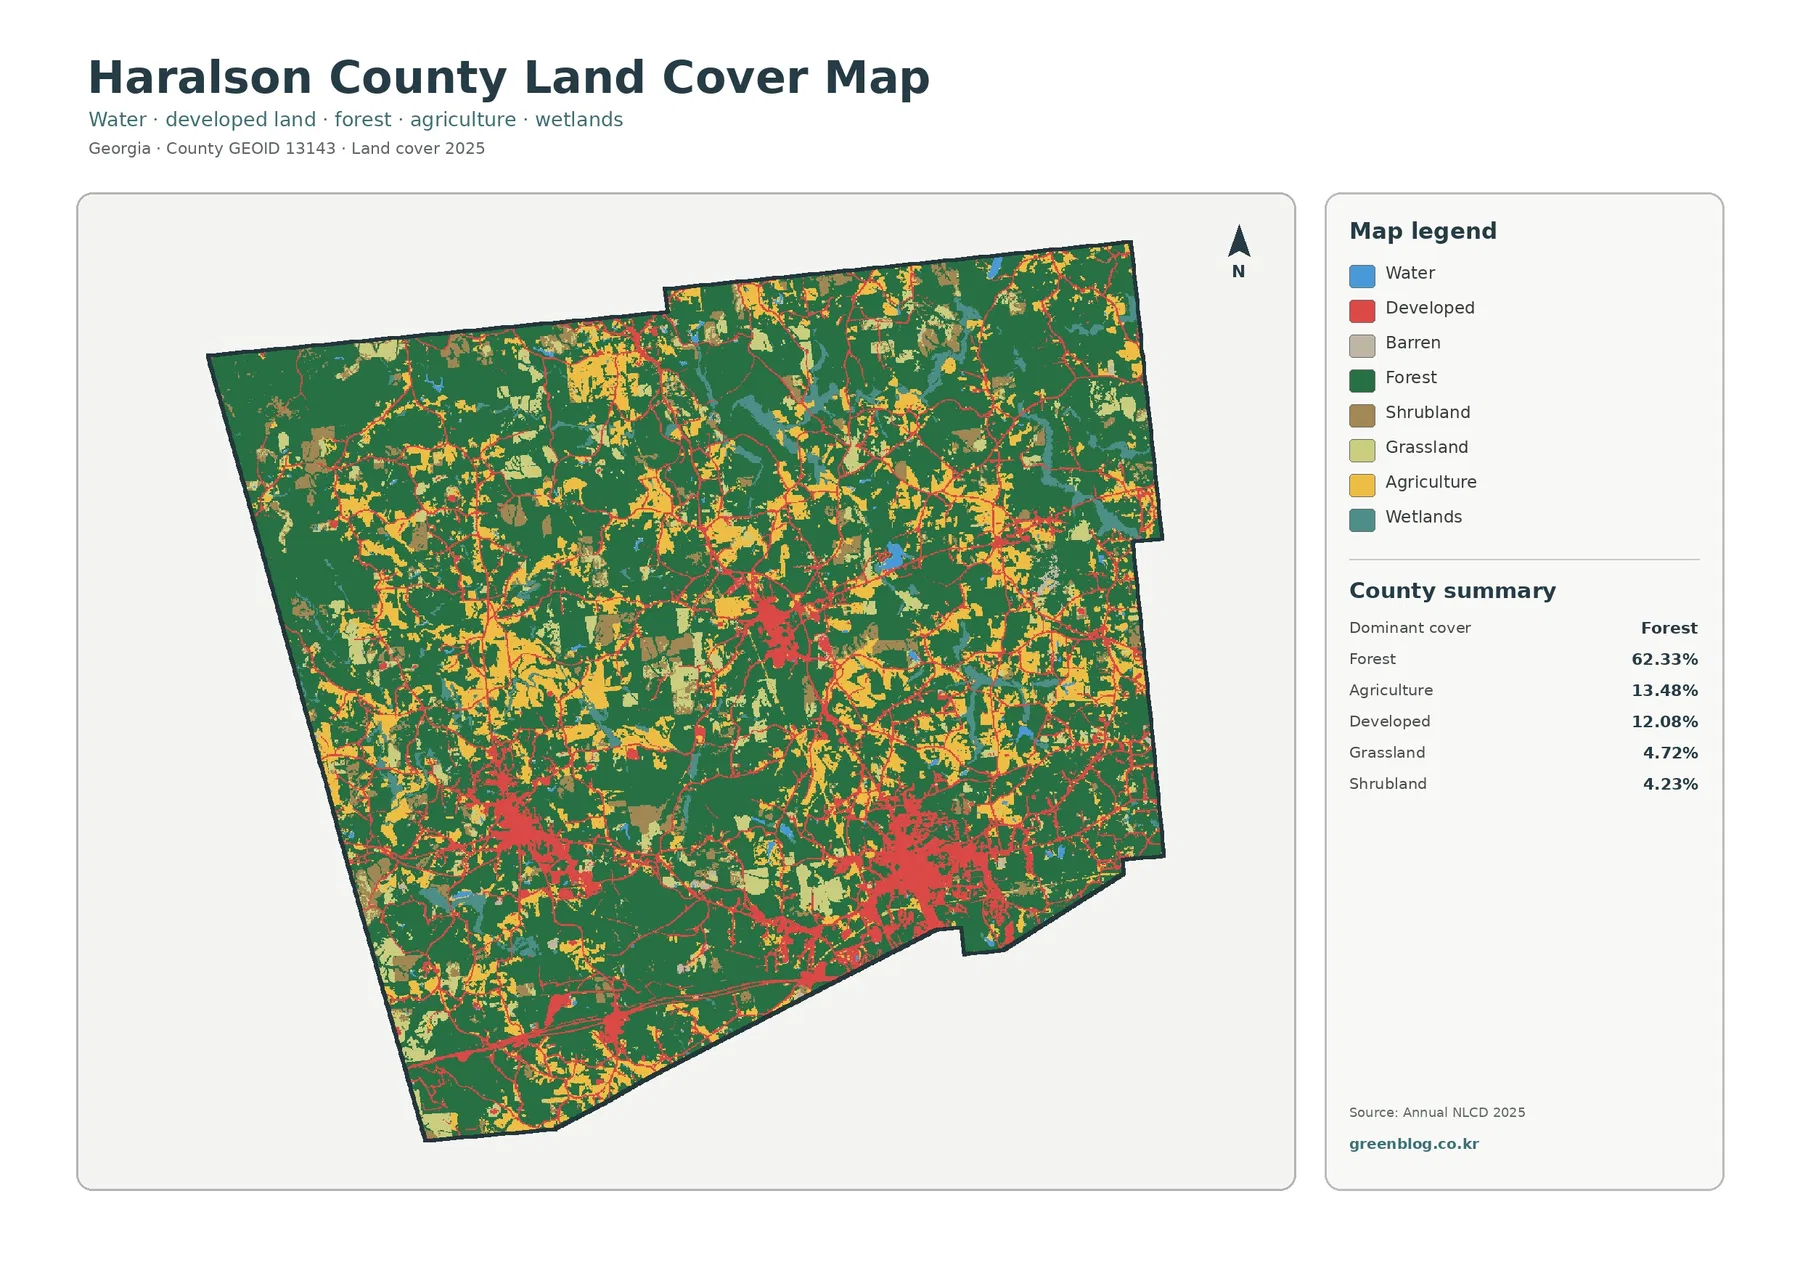
Haralson County’s official website places the county in northwest Georgia on the Alabama border. The county’s own city page lists Buchanan, Bremen, Tallapoosa, and Waco, identifying Buchanan as the county seat and Bremen as the largest city. That local context helps explain why the red developed cover is split into several centers on the map. The strongest clusters broadly align with Tallapoosa in the west, Buchanan nearer the middle, and Bremen in the southeast.
The separation between those centers is important. Large areas of dark green forest remain between them, especially across the northern and northeastern parts of the county. Agricultural cover and smaller areas of grassland or shrubland interrupt the forest in many places, but they do not erase the overall wooded character. From a county-wide view, the map reads as a forest-dominant landscape with several compact concentrations of settlement rather than a mostly developed county with isolated wooded remnants.
Developed cover is not limited to the three largest clusters. Thin red lines and small patches extend outward from the city areas and appear around rural settlements. These features are useful for seeing where built surfaces are distributed, but they should not be read as road centerlines or municipal boundaries. A land-cover cell identifies the dominant surface type at that location; it does not tell you the legal use of a parcel or the name of a road.
Water and wetlands occupy much smaller shares of the county than forest, agriculture, or developed land. Water is 0.52% and wetlands are 2.40% in the supplied 2025 summary. Their colors appear in narrow or scattered locations rather than in one dominant lake system. Even so, those small features matter when comparing land cover near streams and low areas, especially where developed patches approach water or wetland cover.
Forest dominates the total, but open land is spread through the wooded interior
The county summary gives forest a 62.33% share, making it the clear dominant class. Agriculture is 13.48%, developed cover 12.08%, grassland 4.72%, shrubland 4.23%, wetlands 2.40%, and water 0.52%. Those numbers describe the overall balance, but the map adds an important detail: the non-forest classes are not confined to one corner. Agricultural and open-land patches are scattered throughout the county, often breaking the forest into irregular blocks.
Agriculture is especially useful to examine as a pattern rather than a single percentage. Yellow areas appear in many parts of Haralson County, including the western half and the broad spaces between the city clusters. Some are small patches embedded in forest, while others sit next to grassland, shrubland, or developed cover. This makes the county look more like a mixed rural landscape than a simple division between town and wilderness.
Grassland and shrubland together account for nearly nine percent of the supplied summary, but they should not automatically be treated as farmland. Land cover describes what is physically on the surface as classified from imagery. It is different from zoning, ownership, tax status, or a legal land-use designation. A grassy area may be pasture, an open field, a maintained clearing, or another surface type, while shrubland represents a different vegetation class.
The developed 12.08% also varies greatly in density. The southeast and western clusters contain broader red areas, while many rural developed cells are narrow and scattered. This difference becomes more obvious when the land-cover map is compared with the impervious-surface map. A place can be classified as developed even when trees, lawns, or bare ground still occupy much of the cell, so developed cover and hard-surface percentage are related but not interchangeable measurements.
The forest-and-farmland view separates wooded blocks from pasture, crops, and other open cover
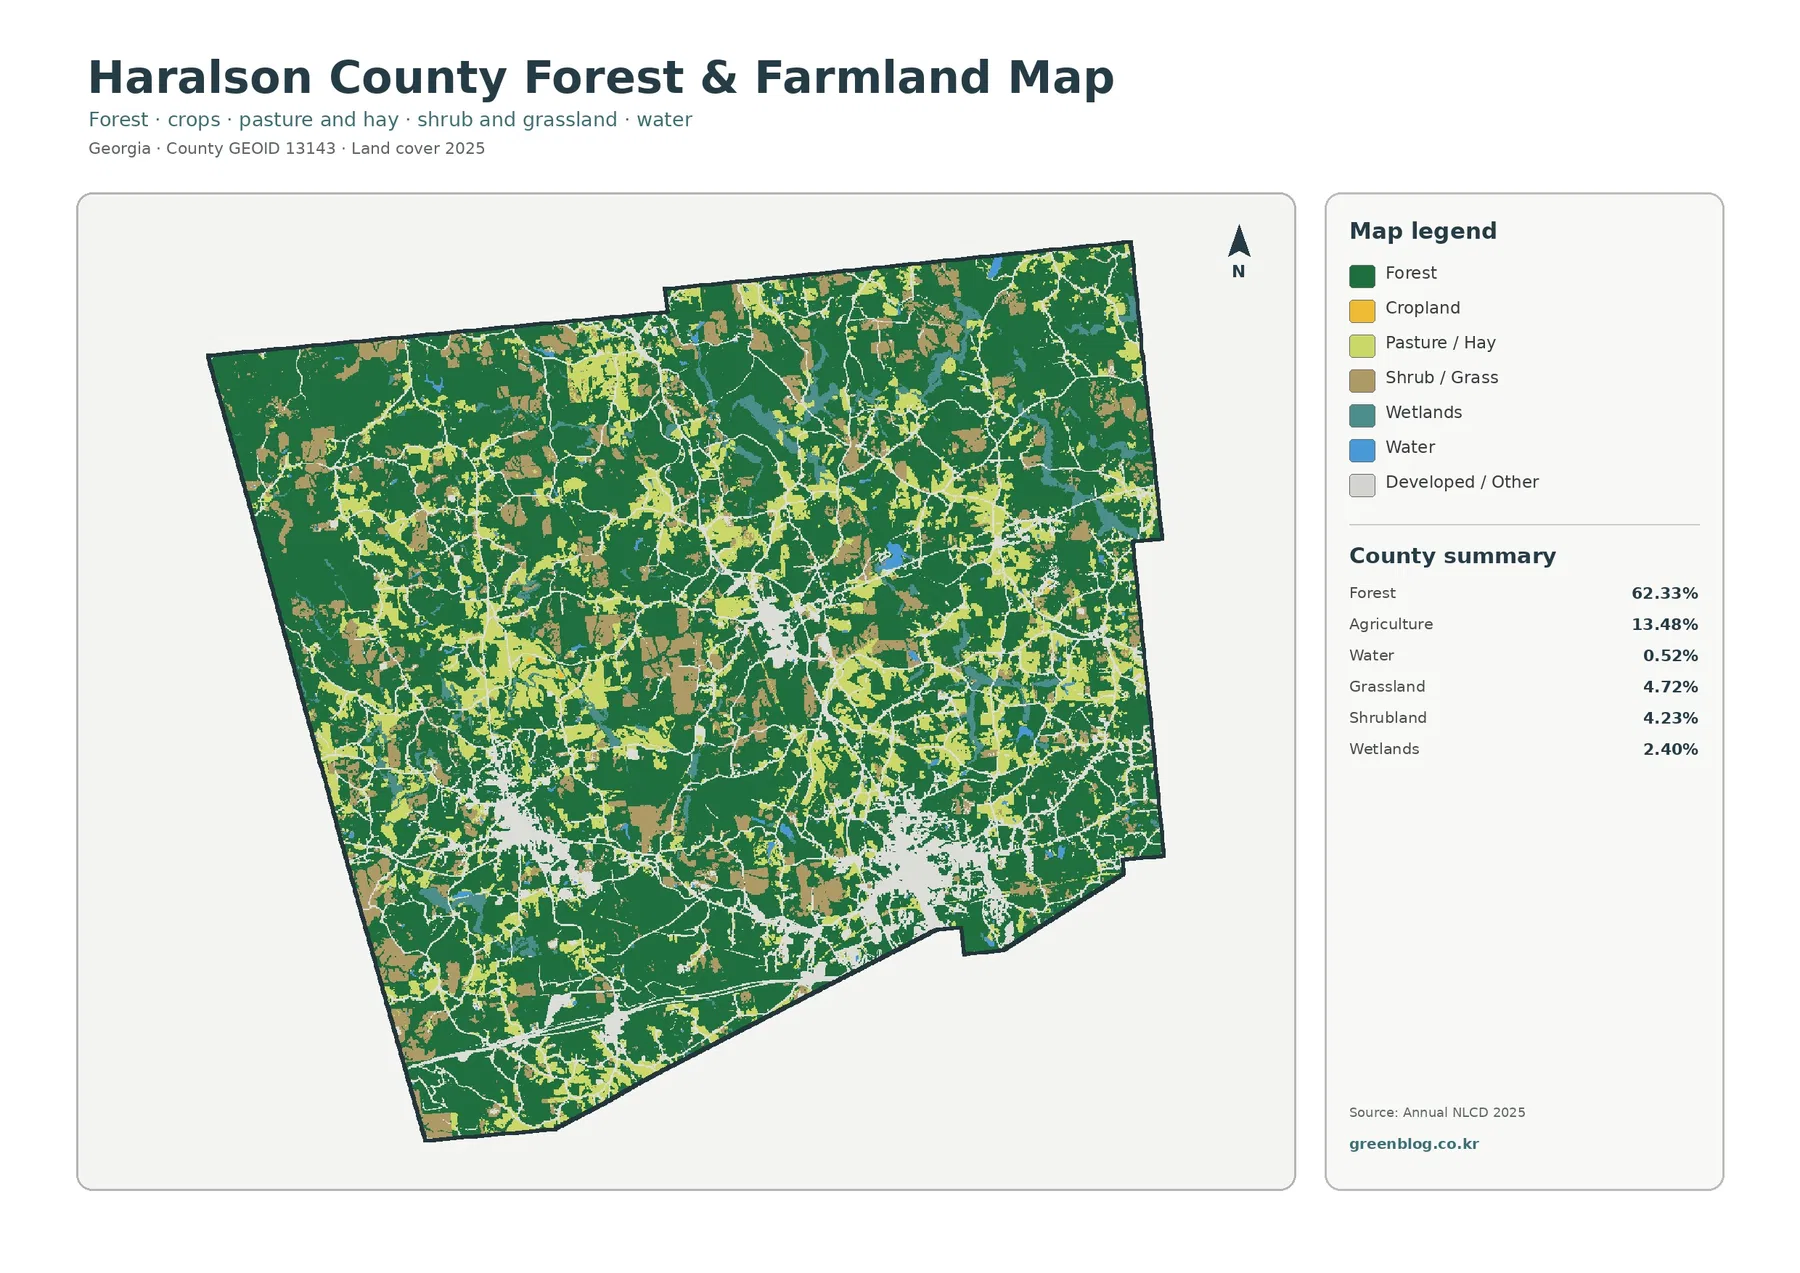
The forest-and-farmland map removes some of the visual competition from the general land-cover map and makes the rural mosaic easier to follow. Dark green forest is broadest across the north and east, although large wooded areas also remain in the west and south. Lighter agricultural and pasture colors become more noticeable around and between the city areas, where the forest edge is more fragmented.
Cropland is only one part of the open rural surface shown here. The legend also separates pasture and hay from shrub and grass cover. That distinction matters in Haralson County because many lighter patches are not the same class. Looking only for yellow cropland would miss a substantial amount of open vegetation, while grouping every light-colored area as agriculture would overstate what the land-cover classification actually says.
Around Tallapoosa and Bremen, gray developed/other cover replaces some of the green and light agricultural colors. Moving away from those centers, the map quickly returns to a mixture of forest, pasture, crops, shrub or grass, and occasional wetlands. Buchanan shows a similar transition at a smaller scale. The pattern is useful for comparing how sharply each built center changes into rural cover at its edges.
The boundaries between those colors are generalized raster boundaries, not surveyed property lines. Annual NLCD uses grid cells to classify the dominant cover at each location, so a single cell can contain trees, grass, a small road, and part of a building. The map is well suited to county-scale comparison, but it should not be used to decide where one farm, forest parcel, or municipal property begins and ends.
Bremen and Tallapoosa stand out most clearly when the map is reduced to hard surfaces
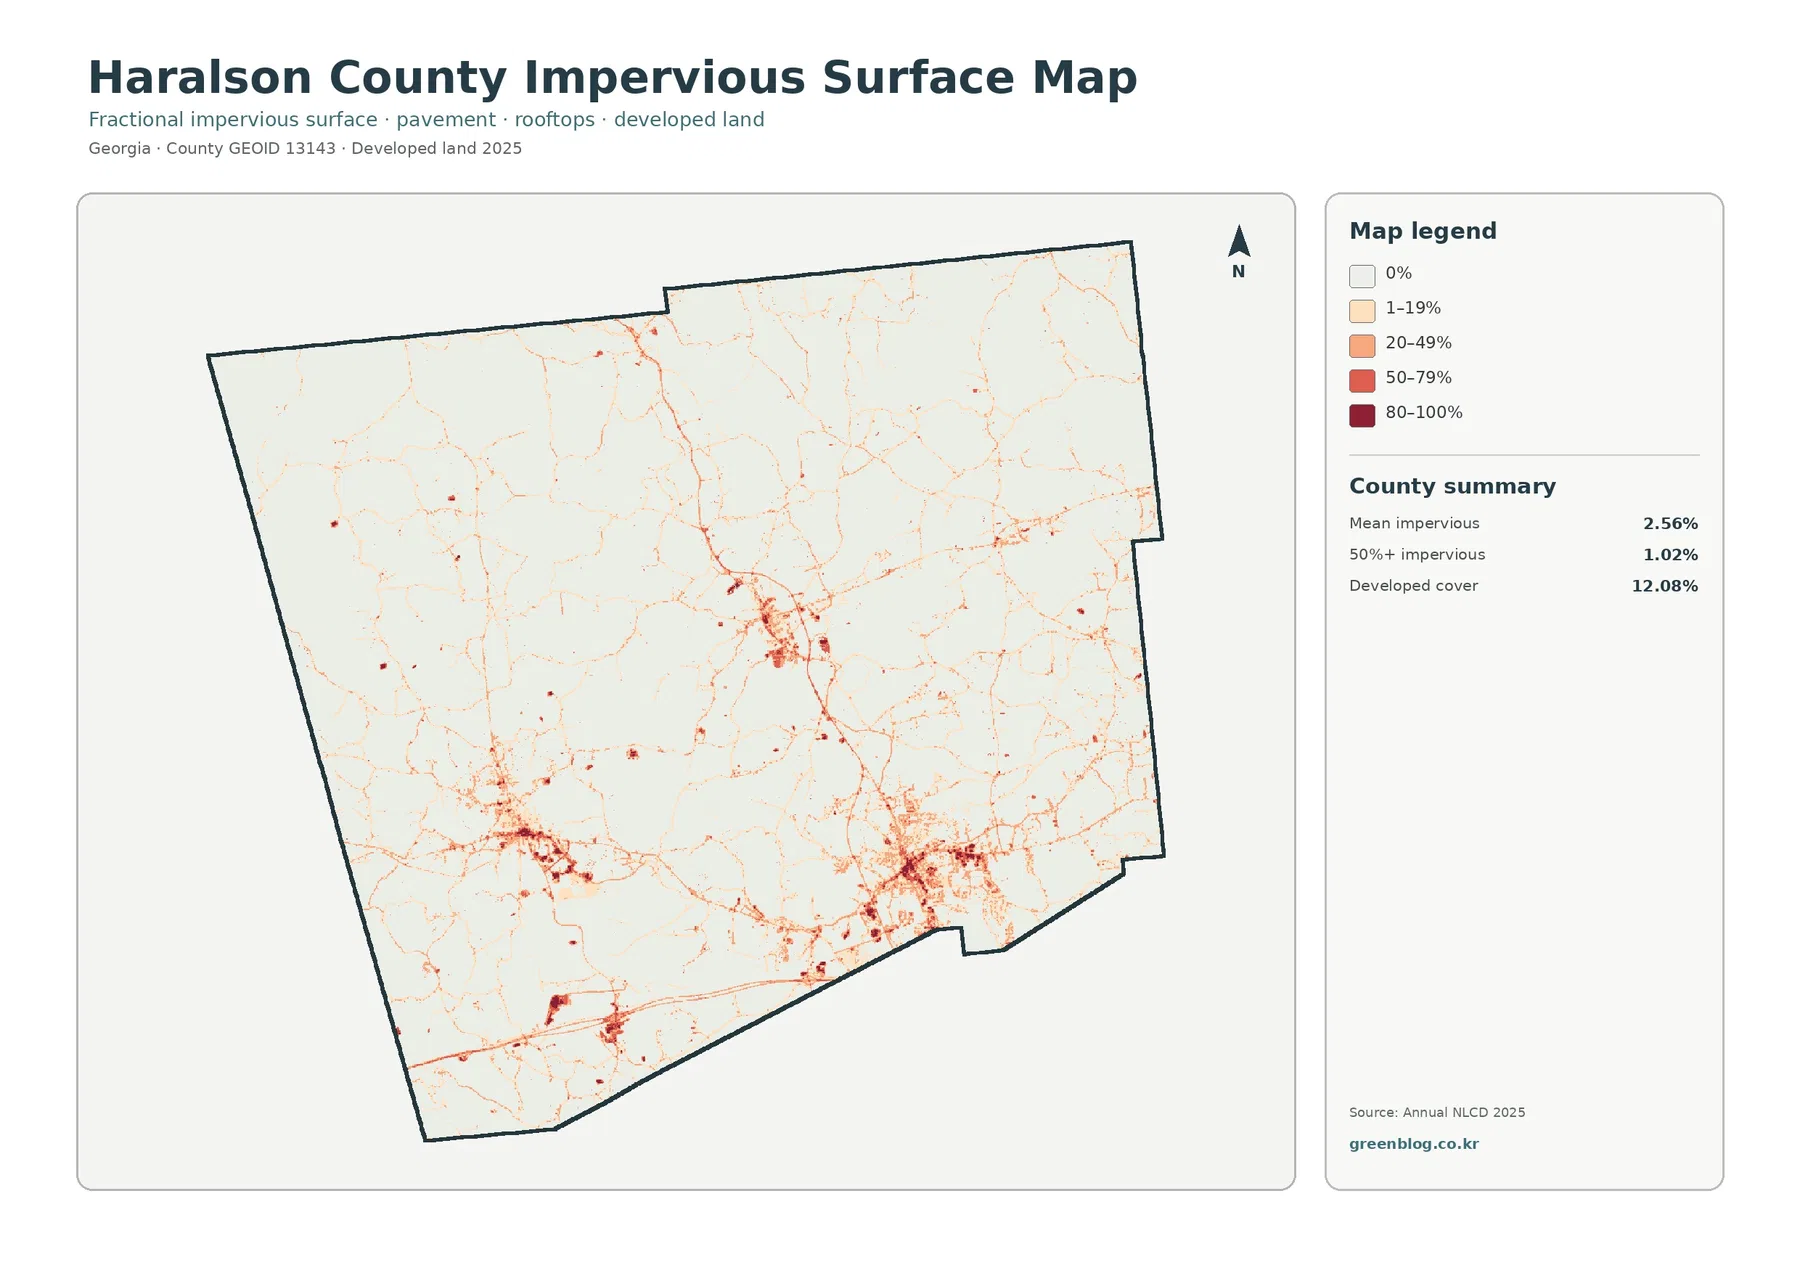
Impervious surface means pavement, rooftops, parking areas, and other hard surfaces that do not readily absorb water. Haralson County’s mean impervious value is 2.56%, while 1.02% of the mapped cells are at least 50% impervious. Those figures are much lower than the 12.08% developed-cover share because a developed land-cover class can still contain trees, lawns, soil, and other permeable surfaces.
The darkest impervious values form the clearest concentrations in the southeast and west. These areas broadly correspond to Bremen and Tallapoosa, with a smaller concentration near Buchanan. The county’s official city information supports those locations, and Georgia’s official tourism site describes Bremen as being at I-20 and U.S. 27. The impervious map is therefore especially helpful for separating a compact built center from the lower-density developed land around it.
Thin lines of lower impervious values extend between and beyond the larger clusters. They often appear in the same general corridors as developed cover, but proximity should not be turned into a claim of causation. The map can show that hard surfaces and developed cells occur near the same corridor; it cannot, by itself, prove why development occurred there or identify the construction date of a particular road or building.
The county-wide average also hides local contrast. Forest and agricultural land cover most of Haralson County, pulling the mean down to 2.56%, while individual urban cells can be far higher. For stormwater, heat, or drainage questions, the location of the high-value cells is often more informative than the county average. A real hazard assessment would still require terrain, soils, rainfall, drainage infrastructure, and hydrologic data in addition to this map.
The Alabama border and the county’s four cities give the map a useful geographic frame
Haralson County’s western edge is also the Georgia-Alabama state line. That makes Tallapoosa’s western location more meaningful when reading the county-wide map. Its developed cluster is not simply a distant satellite of Buchanan or Bremen; it is one of the county’s established cities near the state boundary. Forest and agricultural cover surround that western built area, creating a strong contrast between the city cluster and the rural land around it.
Buchanan occupies a more central position and serves as the county seat, yet its mapped built cluster is smaller than the broad southeastern concentration. The county’s official city page identifies Bremen as Haralson County’s largest city, which fits the much larger developed and impervious concentration in that part of the map. Administrative importance and the amount of developed land are therefore not the same thing.
Waco is the fourth incorporated city listed by Haralson County. It lies in the southern part of the county, between the larger western and southeastern centers. The maps show smaller developed and impervious features along the southern portion of the county, which can be compared with Waco and other settlement locations. Because municipal boundaries are not drawn on these land-cover maps, a separate city-boundary layer is required before assigning any individual cell to Waco.
This city framework is most useful when it stays secondary to the actual land-cover evidence. The maps tell us where forest, agriculture, developed land, and hard surfaces appear. Official local sources tell us where the recognized cities are. Comparing the two can clarify the pattern, but it should not be used to infer zoning decisions, annexation history, or the causes of growth without additional planning and historical records.
The 1985–2025 map records 34.18% class difference, not 34.18% confirmed land conversion
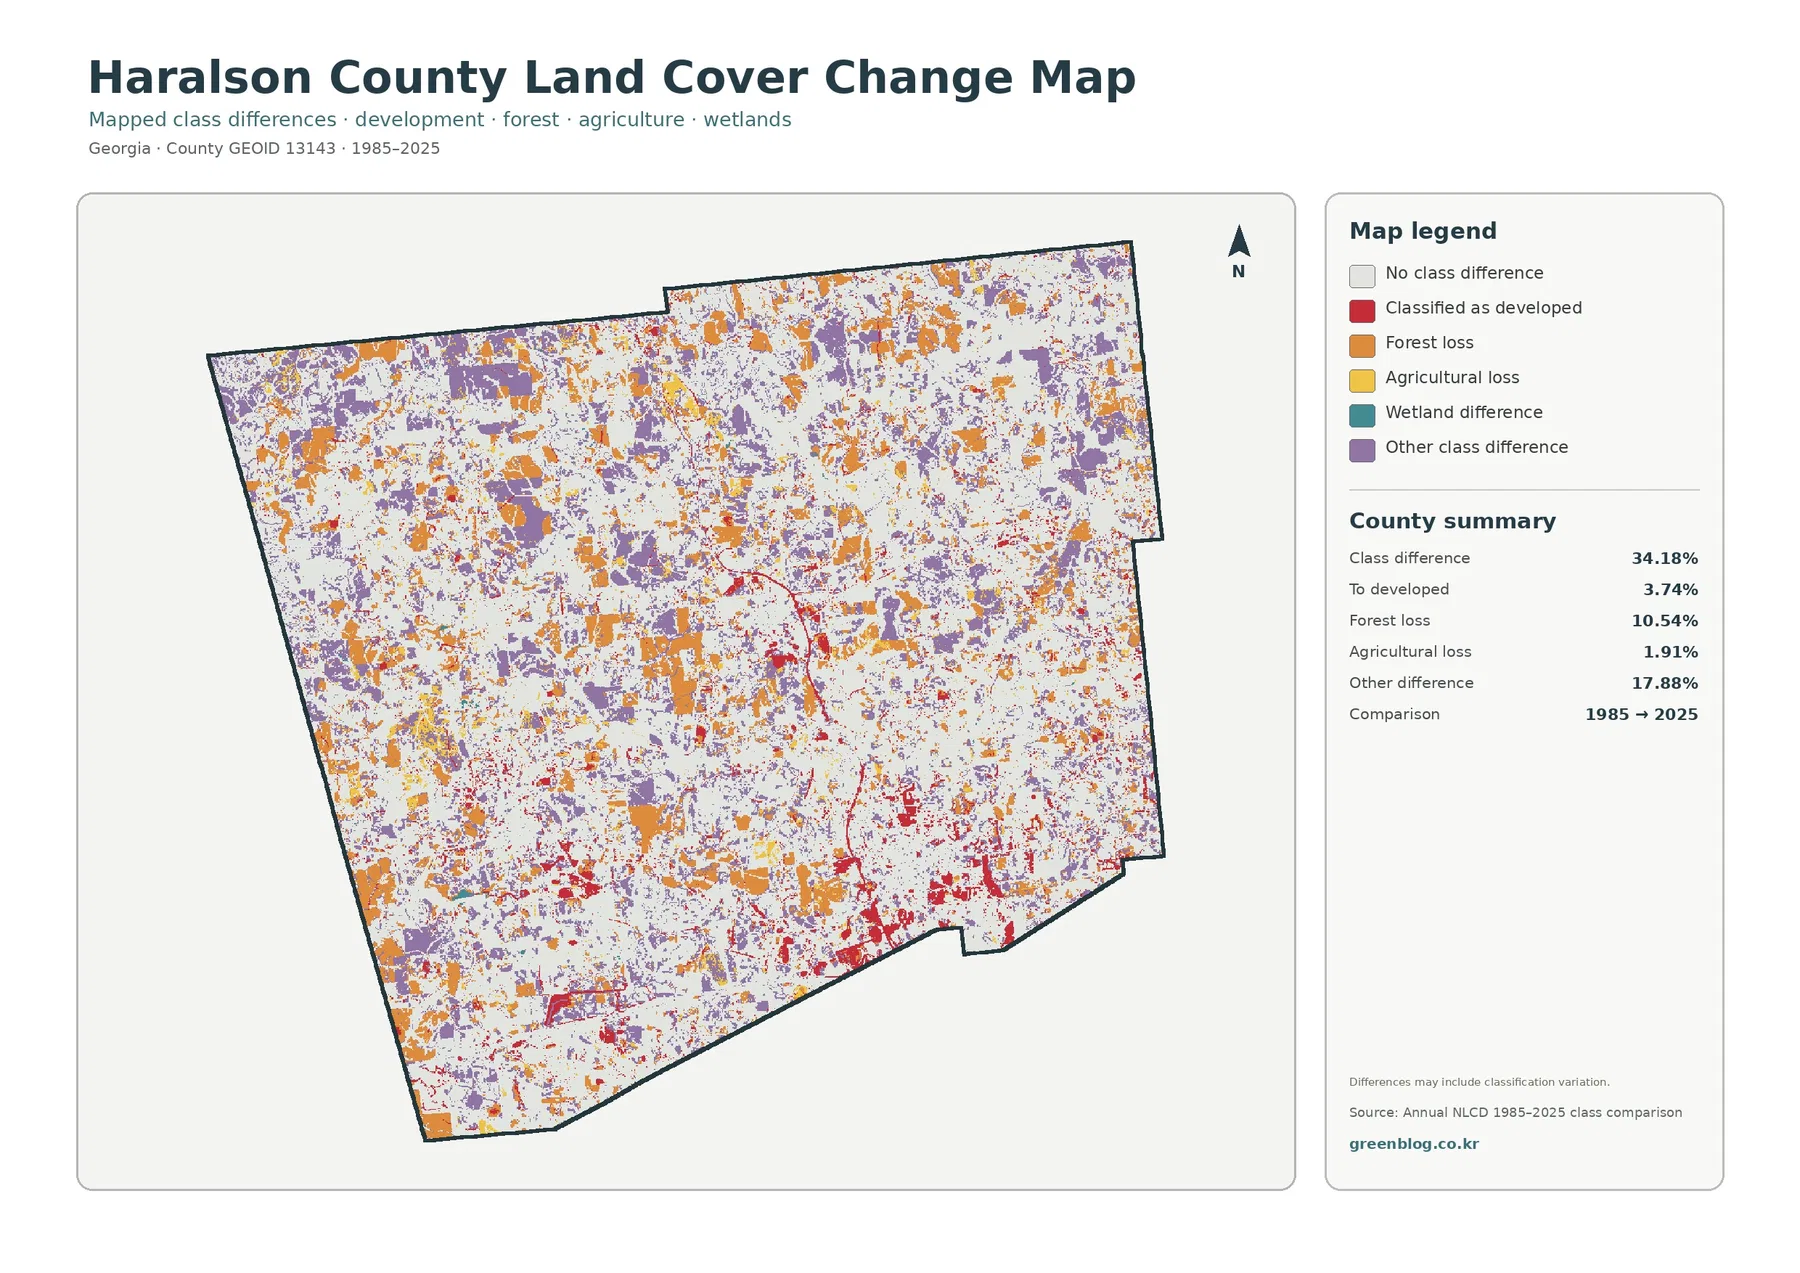
The change map reports a total class difference of 34.18% between 1985 and 2025. The supplied summary also lists 3.74% classified to developed, 10.54% forest loss, 1.91% agricultural loss, and 17.88% other class difference. Orange forest-loss and purple other-difference patches are spread across much of the county, while red areas classified to developed are more concentrated around the built centers and parts of the southern half.
The headline number needs a careful reading. The map itself warns that mapped differences may include classification variation. A cell can change class because the surface truly changed, but differences in imagery, classification methods, mixed pixels, or conditions at the time of observation can also contribute. For that reason, 34.18% should not be quoted as a verified percentage of the county that physically changed use.
Forest loss at 10.54% is one of the largest named change categories in the summary. On the map it appears as many patches rather than one continuous block. Some patches are near developed or open land, while others occur within areas that remain broadly forested in 2025. A specific patch cannot be assigned to logging, clearing, storm damage, or another event without older aerial imagery and additional records.
The 3.74% classified-to-developed value is easier to interpret when placed beside today’s 12.08% developed cover. Red change areas are visible around Tallapoosa, Buchanan, Bremen, and several connecting or southern locations, but they do not dominate the county. Haralson County’s long-term map is therefore not a simple story of urban expansion replacing everything else. It combines development-related differences with extensive forest and other classification changes across a still heavily wooded county.
A practical way to use all four maps without mixing their meanings
Start with the general land-cover map when the question is simply where the major cover types are located. It gives the fastest view of the 62.33% forest majority, the 13.48% agricultural share, and the separate developed clusters. At this stage, focus on large areas and contrasts rather than isolated pixels. The map is best at showing the county’s overall composition and where one class becomes more common than another.
Move to the forest-and-farmland map when open rural land needs more detail. Cropland, pasture/hay, and shrub/grass are easier to separate there. Then use the impervious map to ask a different question: where are hard surfaces most concentrated inside the broader developed areas? The contrast between 12.08% developed cover and a 2.56% mean impervious value is a useful reminder that the two measurements describe different aspects of the landscape.
Use the 1985–2025 map last. Once the present-day pattern is clear, the change categories can be compared without treating every color difference as confirmed conversion. This order also works well for teaching or presentations because each map answers a distinct question: what covers the land now, how forest and open rural cover are arranged, where hard surfaces concentrate, and where the classification differs across the forty-year comparison.
For printed material, a county-wide map works well beside one or two enlarged city areas. Tallapoosa, Buchanan, and Bremen provide clear examples of different built-cluster sizes, while the northern forest gives a contrasting rural reference. The original JPG files retain the full map layout, legends, and summary boxes, making them easier to use when web-preview dimensions are too small for labels or presentation graphics.
Why small patches and sharp color boundaries should be treated as generalized evidence
Annual NLCD is designed for consistent land-cover mapping across large areas, not for surveying individual parcels. USGS documentation describes the product as a 30-meter raster. Each grid cell receives a class, even when several surface types occur inside that area. A narrow road, a small building, trees, grass, and bare ground can all contribute to what one cell represents.
That limitation matters in Haralson County because forest, farms, pasture, shrub or grass, and rural development often meet along irregular edges. A sharp color boundary on the screen is a boundary between classified cells, not a surveyed fence or property line. The county-scale pattern remains useful, but decisions about a specific parcel require current aerial imagery, cadastral data, zoning information, and local records.
Impervious percentages need similar care. A developed cell does not mean the entire cell is paved, and a low impervious cell is not necessarily undeveloped. The two maps should be compared rather than substituted for one another. This is especially important around the edges of Bremen, Tallapoosa, and Buchanan, where lower-density development can contain substantial tree and grass cover.
The change map adds another layer of uncertainty because it compares classifications from two dates. Its note about classification variation should remain part of any interpretation. Broad, repeated patterns can identify areas worth checking, but confirmation of forest clearing, agricultural conversion, new construction, or wetland change requires independent evidence from the relevant period. The supplied percentages are best used as map-summary values, not parcel-level measurements.
Frequently Asked Questions
Where are the strongest developed clusters on the Haralson County maps?
The broadest developed and impervious concentrations appear in the west and southeast, broadly aligning with Tallapoosa and Bremen. A smaller cluster appears near Buchanan, the county seat. Haralson County’s official city page confirms those communities, but the land-cover maps do not draw municipal boundaries, so individual cells should not be assigned to a city without a separate boundary layer.
Why is developed cover 12.08% while mean impervious surface is only 2.56%?
Developed land cover can include lower-density places where buildings and roads are mixed with trees, lawns, soil, and other permeable surfaces. Impervious surface measures the hard portion more directly. The two values therefore describe different things, and the highest impervious percentages are concentrated in smaller parts of the broader developed areas.
Does the 34.18% class difference mean one-third of Haralson County physically changed between 1985 and 2025?
No. The supplied change map states that differences may include classification variation. The 34.18% value is a mapped class-difference summary, not a parcel-by-parcel measurement of confirmed physical conversion. Older aerial imagery, local land records, and other independent sources are needed to verify the cause and timing of a specific change patch.
Map File Information
This ZIP contains the four original JPG maps for Haralson County: land cover, forest and farmland, impervious surface, and 1985–2025 land-cover change.
- Included Files: Four original JPG land-cover maps used in this article
- File Type: JPG images packaged in a ZIP archive
- Intended Use: Printing, education, presentations, and map-based projects
Related Maps
- Appling County Georgia Land Cover Map
- Atkinson County Georgia Land Cover Map
- Bacon County Georgia Land Cover Map
Sources and References
- MRLC Annual NLCD Data – official access and background for Annual NLCD land-cover and impervious products.
- USGS Annual NLCD Land Cover Classification – classification guidance and 30-meter raster context.
- Haralson County Board of Commissioners – official county location and northwest Georgia/Alabama-border context.
- Cities in Haralson County – official information for Buchanan, Bremen, Tallapoosa, and Waco.
- Explore Georgia – Bremen – state tourism reference for Bremen’s I-20 and U.S. 27 location.
- U.S. Census Bureau TIGER/Line Shapefiles – official geographic boundary data.
Green Map creates custom-edited map images using open geographic data sources such as geoBoundaries, Natural Earth, OpenStreetMap, and government open data. These maps are edited visual materials, not raw data files, and are provided for education, documents, presentations, and graphic reference.