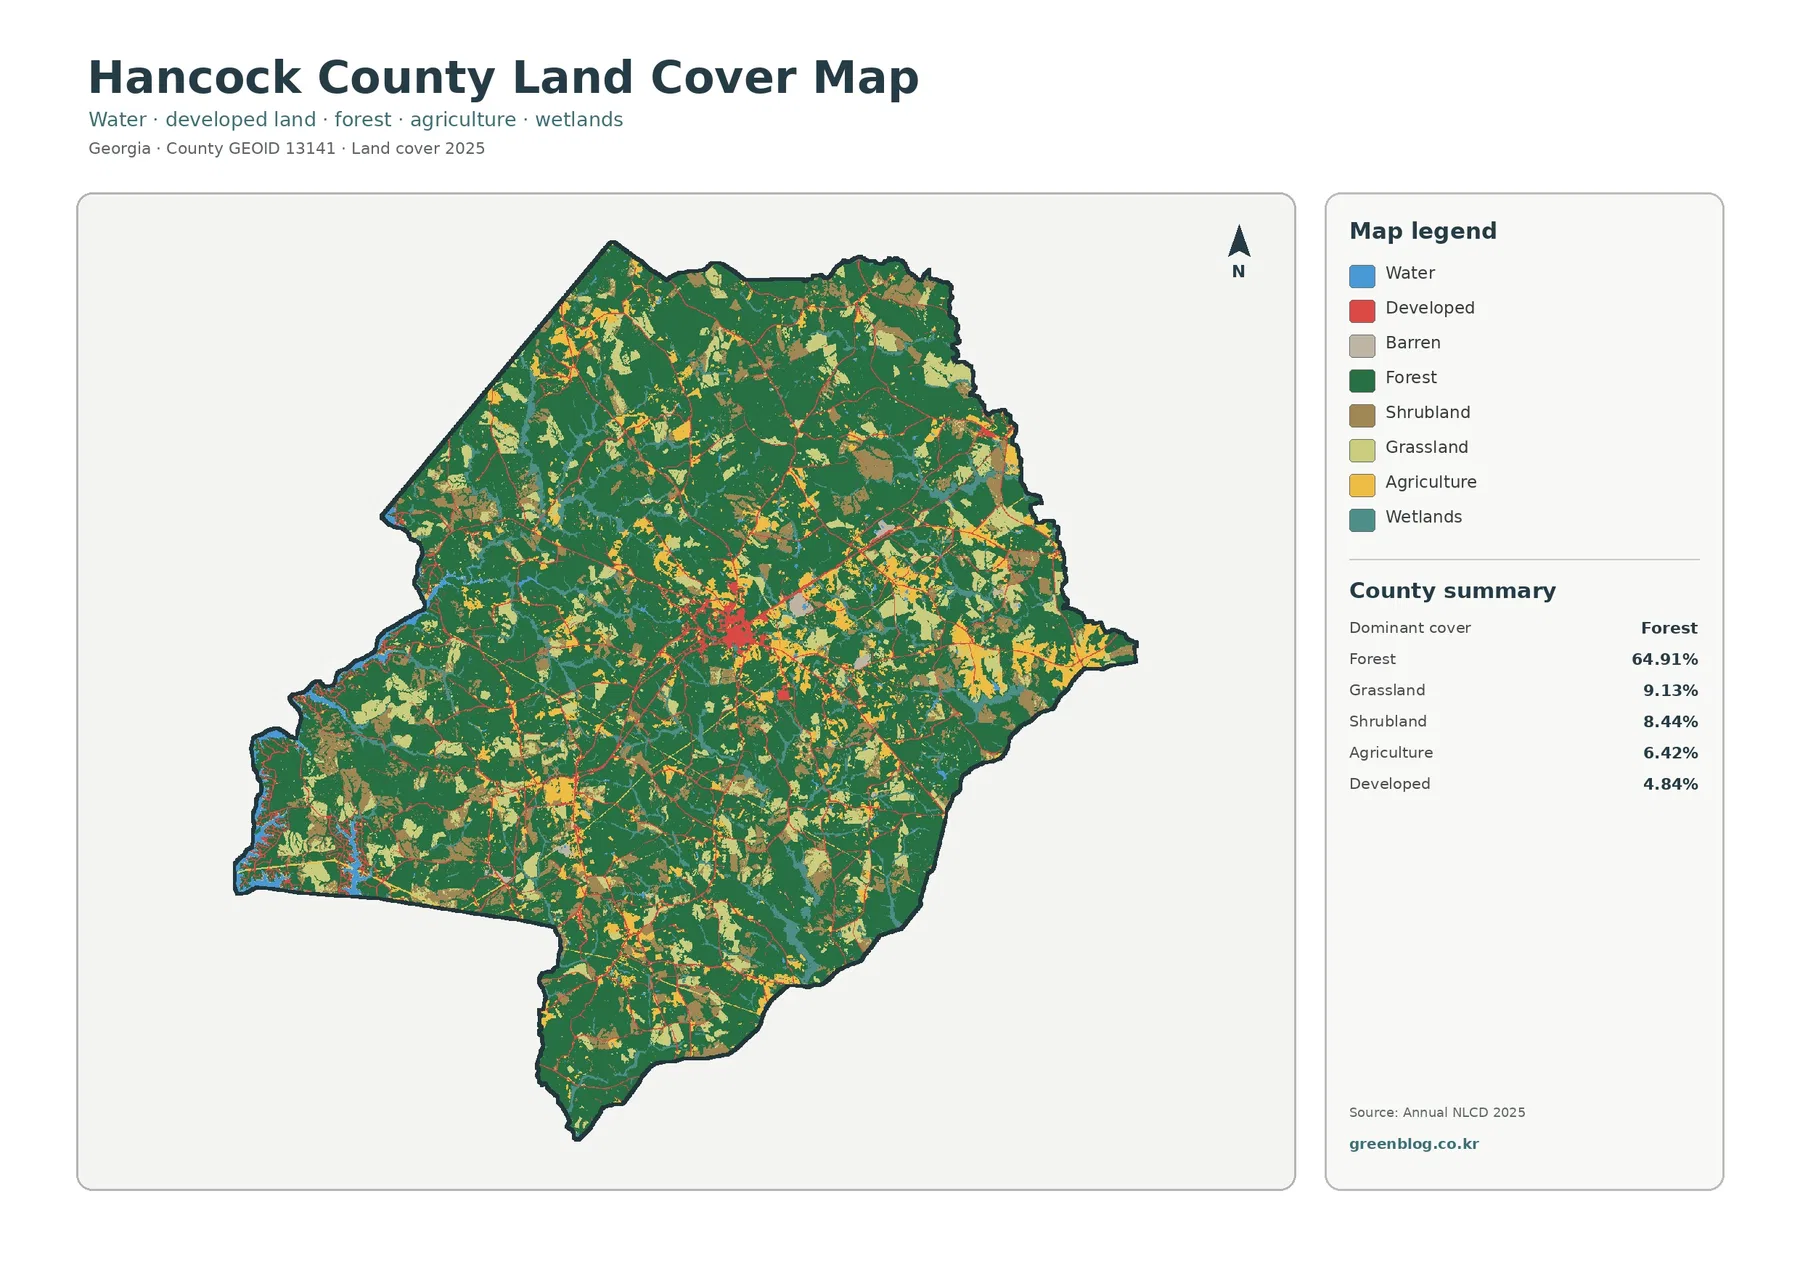
Hancock County, Georgia is a land-cover map where woodland dominates at first glance. The 2025 summary places forest at 64.91%, while grassland, shrubland, agriculture, wetlands, water, and developed cover break that green background into smaller pieces. The main developed concentration is compact and near the county’s center, which is consistent with the location of Sparta, the county seat. This page uses four map views to compare current cover, forest and farmland, impervious surfaces, and mapped change from 1985 to 2025.
The four original JPG maps are available together in the download box below. They are useful when you need a larger copy for printing, a closer look at the Sparta area, a reference for Lake Sinclair and local waterways, or a side-by-side comparison of current cover and long-term class differences.
Table of Contents
A mostly wooded rural county with one compact built center
Hancock County’s official website places the county in Georgia’s Piedmont and describes Sparta as its community center. The 2025 land-cover map matches that broad rural setting. Dark green forest covers large areas in every direction, while the developed class forms a much smaller red cluster near the middle of the county. Thin developed traces extend outward along transportation and settlement corridors, but they never become the dominant pattern across the county.
The green areas are not a single unbroken block. Grassland and shrubland appear as many small tan and olive patches, and agricultural cover is scattered among them. That mixture matters because a viewer could otherwise assume that every non-developed area is forest. In Hancock County, open land is a meaningful part of the pattern even though no single open-cover class comes close to the forest total.
Water occupies only 1.29% of the county summary, yet blue features are still easy to notice near the southwestern edge and in smaller locations. Hancock County’s visitor information specifically identifies Lake Sinclair and Shoulderbone Creek as local natural features. The land-cover map does not label those water bodies by name, so it is best used to locate water and wetland cover first and then confirm names with an official base map.
Grassland and shrubland matter almost as much as farmland when reading the open areas
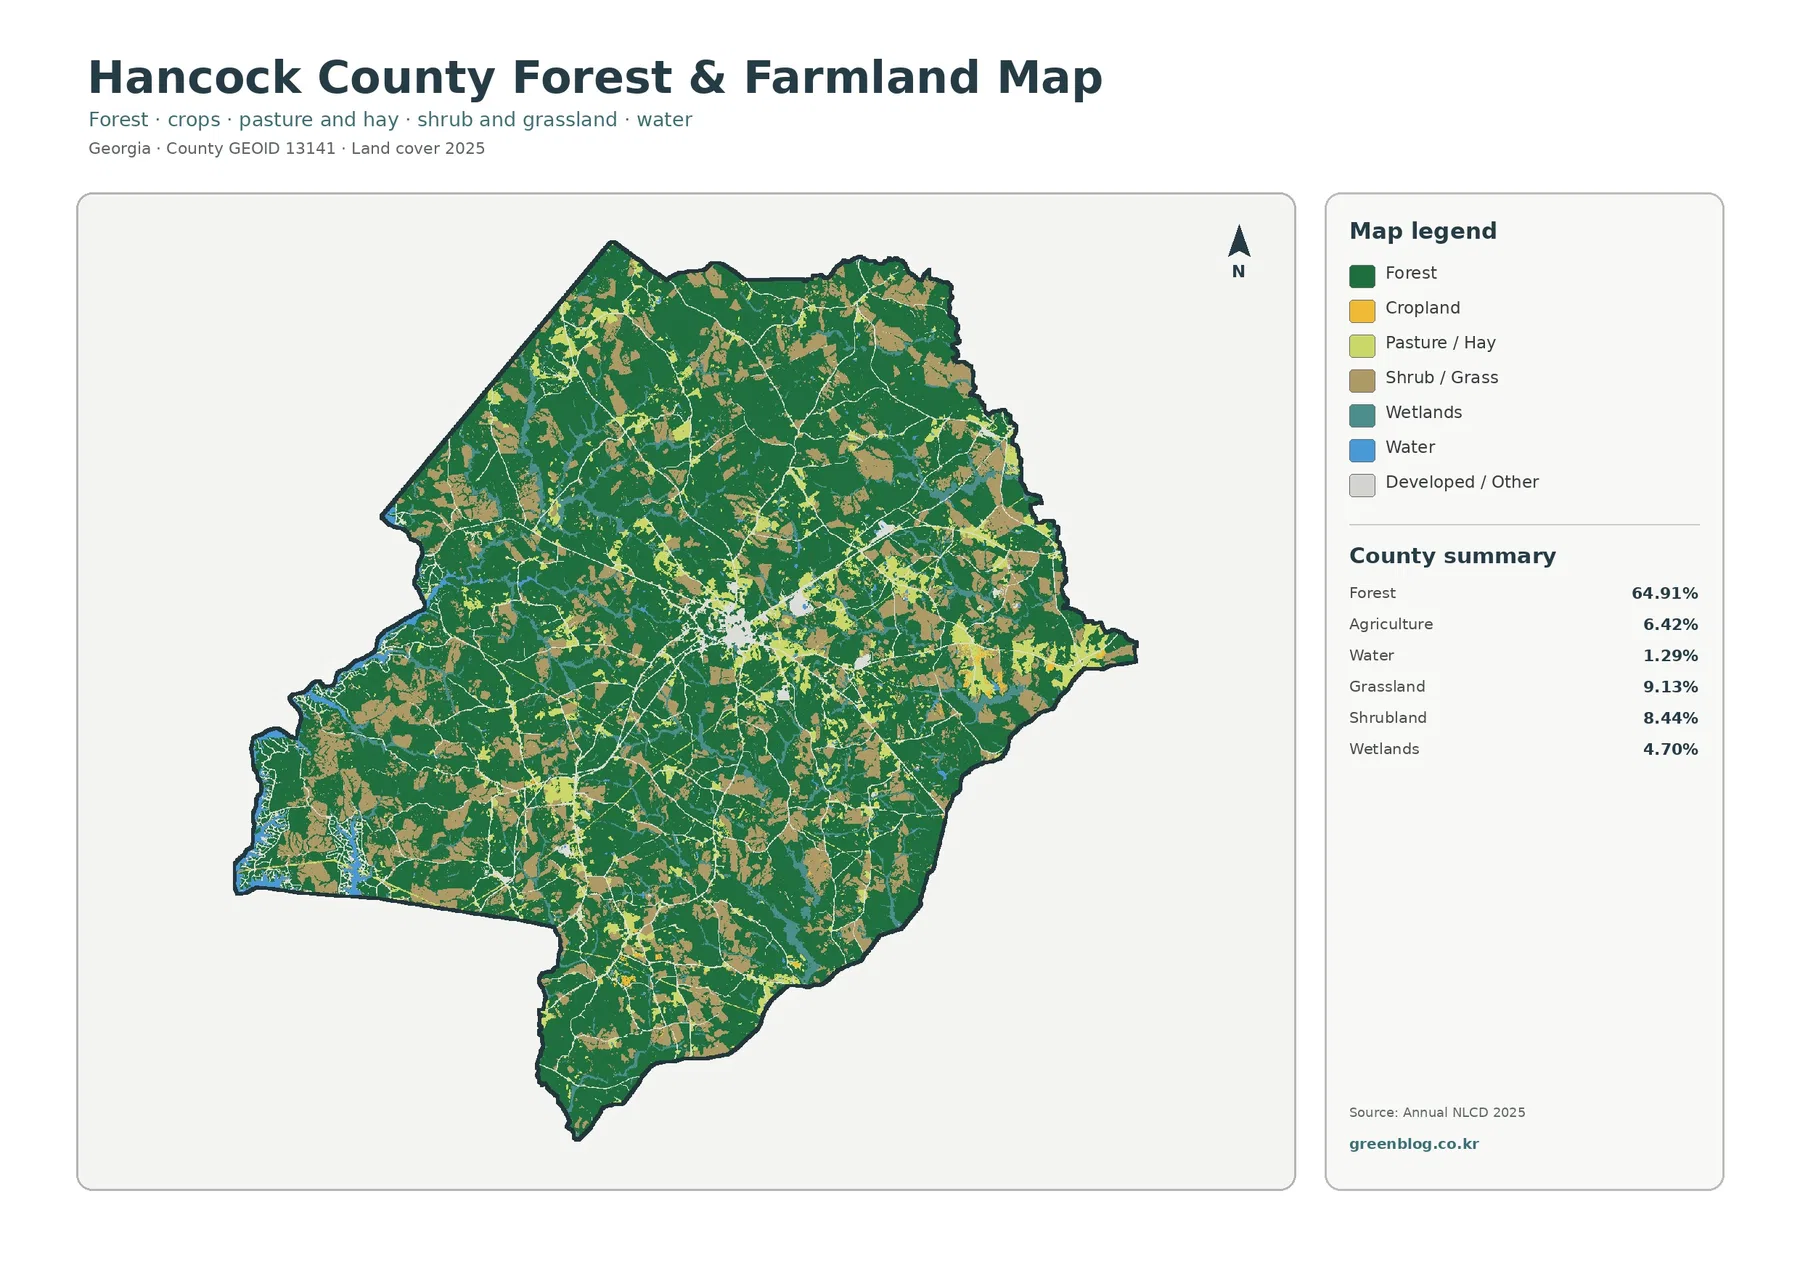
The county summary lists grassland at 9.13% and shrubland at 8.44%, both above agriculture at 6.42%. Those numbers explain why so many non-forest patches do not look like a single farm belt. Open cover is distributed in irregular pieces through the north, east, south, and interior, often next to forest rather than separated from it by a clean boundary.
The forest-and-farmland map makes this distinction easier to see because it separates cropland from pasture and hay while also retaining shrub and grass cover. Yellow cropland appears in scattered pockets, whereas pasture and hay use a lighter green that can be easy to miss on the general land-cover map. Together they show that agricultural landscapes in Hancock County are interwoven with woodland instead of forming one broad continuous agricultural plain.
A 2022 USDA Census of Agriculture county profile reports woodland, cropland, and pastureland within Hancock County farms. That agricultural source is useful as local context, but it should not be matched acre-for-acre against NLCD classes. The two datasets answer different questions: the Census of Agriculture reports land associated with farm operations, while NLCD classifies what the ground surface appears to be covered by at a mapped pixel.
This difference is also why the map should not be treated as a zoning or parcel-use map. A green forest cell does not tell you who owns the land, whether timber is managed commercially, or what the property is legally allowed to become. Likewise, a pasture-colored cell does not identify a specific farm. For parcel decisions, land-cover patterns should be checked against local GIS, deeds, zoning records, or current aerial imagery.
Sparta stands out more clearly on the impervious-surface map
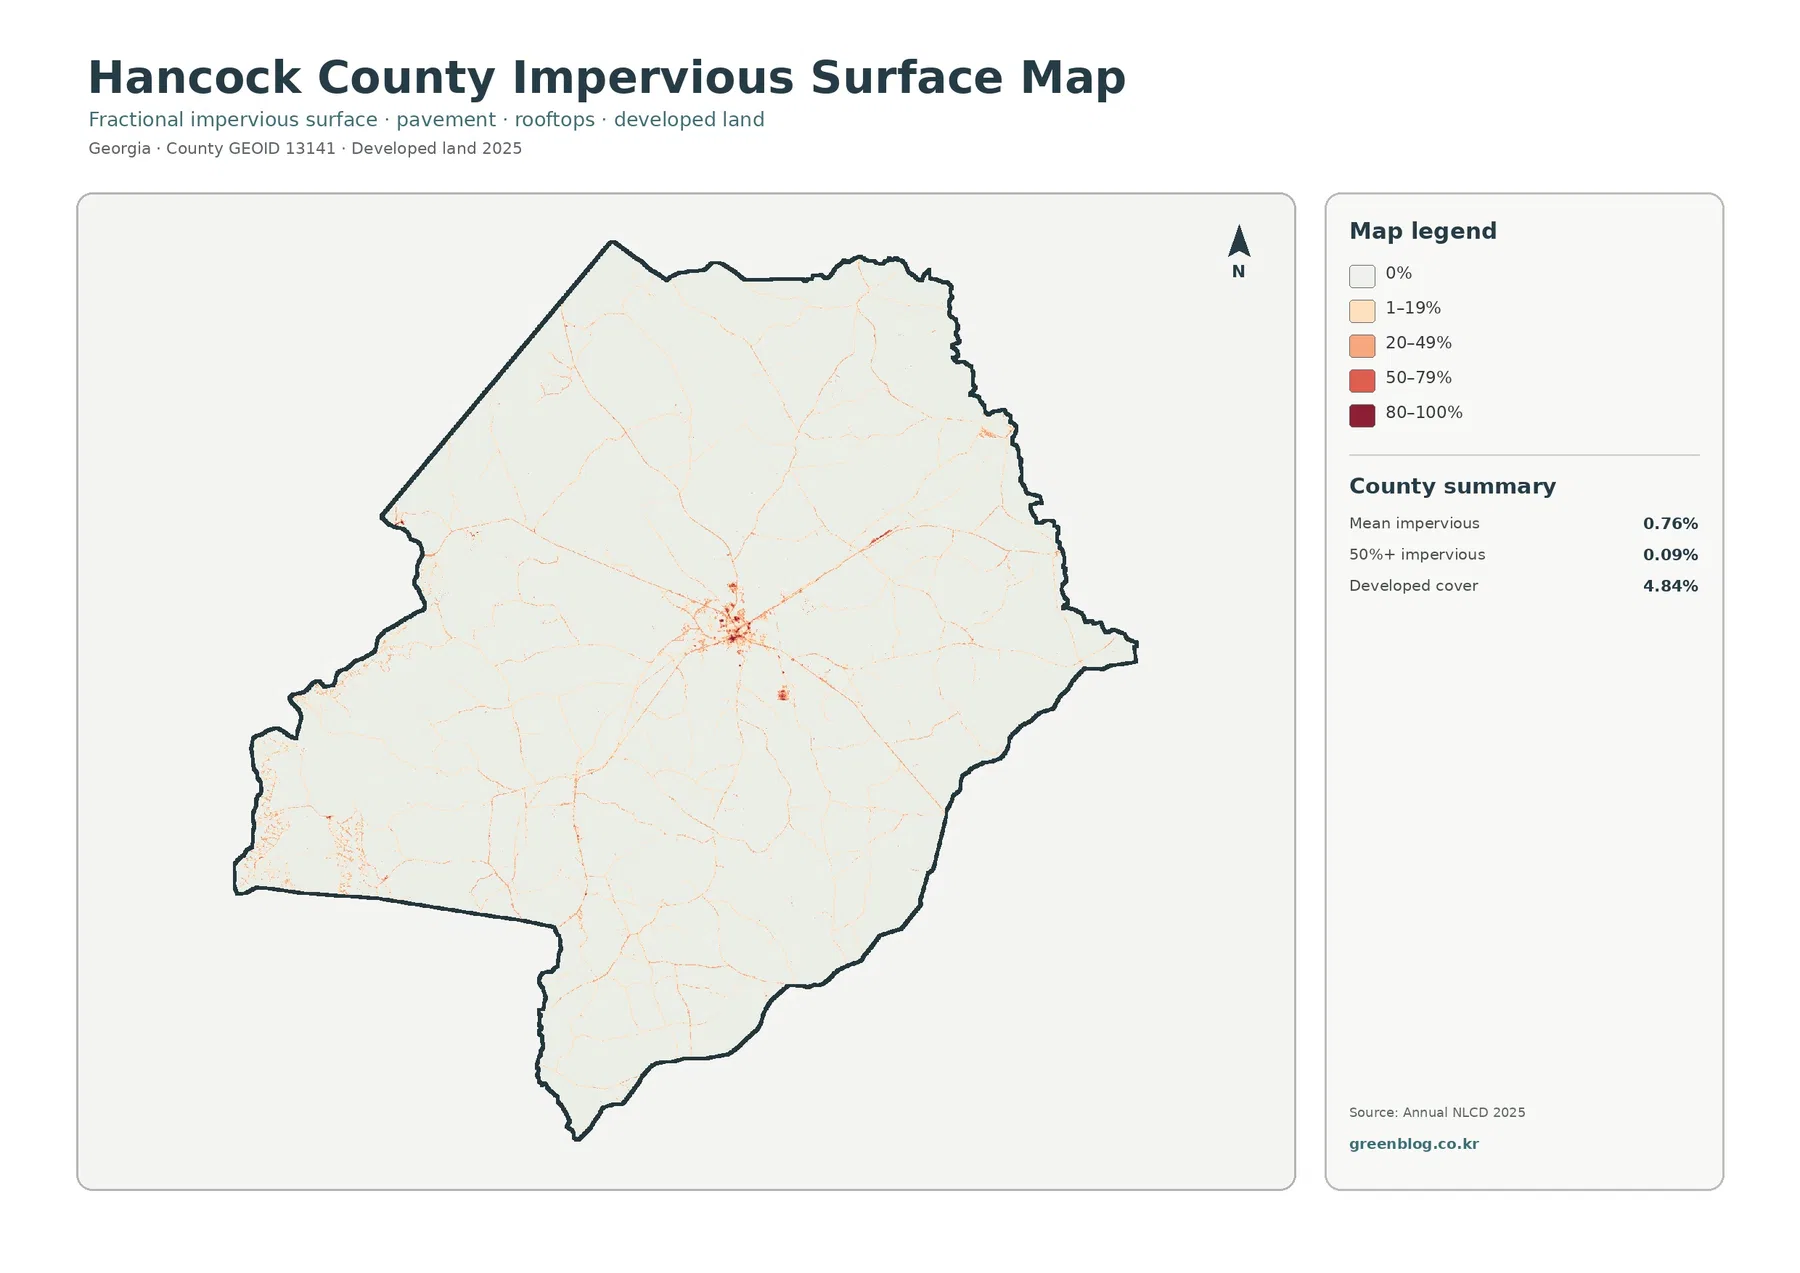
Impervious surface means pavement, rooftops, parking areas, and other hard surfaces that do not readily absorb rainfall. Hancock County’s mean impervious value is only 0.76%, and cells at or above 50% impervious account for just 0.09% in the map summary. Those values are consistent with a county where high-density built surfaces occupy a very small share of the total area.
The strongest concentration is a small red network near the center. Because official county information identifies Sparta as the county seat, this cluster can be read alongside Sparta’s location. Fine lines spread outward from that central area, while isolated traces appear elsewhere, especially along rural travel corridors. The map does not label road names, so those lines should not be assigned to a specific highway without a separate transportation layer.
Developed cover is 4.84%, much higher than the 0.76% mean impervious value, and that difference is expected. Developed land can include low-density residential areas with trees, lawns, exposed soil, and other permeable surfaces mixed among buildings and roads. Impervious mapping narrows the question to the hard surfaces themselves, which is why the most intense colors occupy a much smaller footprint than the developed class on the general map.
This map is useful for a first look at where hard surfaces are concentrated, but it is not a flood-risk map. Runoff depends on terrain, soil, drainage, rainfall, streams, and many other factors. Near Lake Sinclair or local creeks, a complete assessment would need elevation, hydrology, flood-zone, and site-specific information in addition to impervious cover.
The 42.30% class-difference figure needs a cautious reading
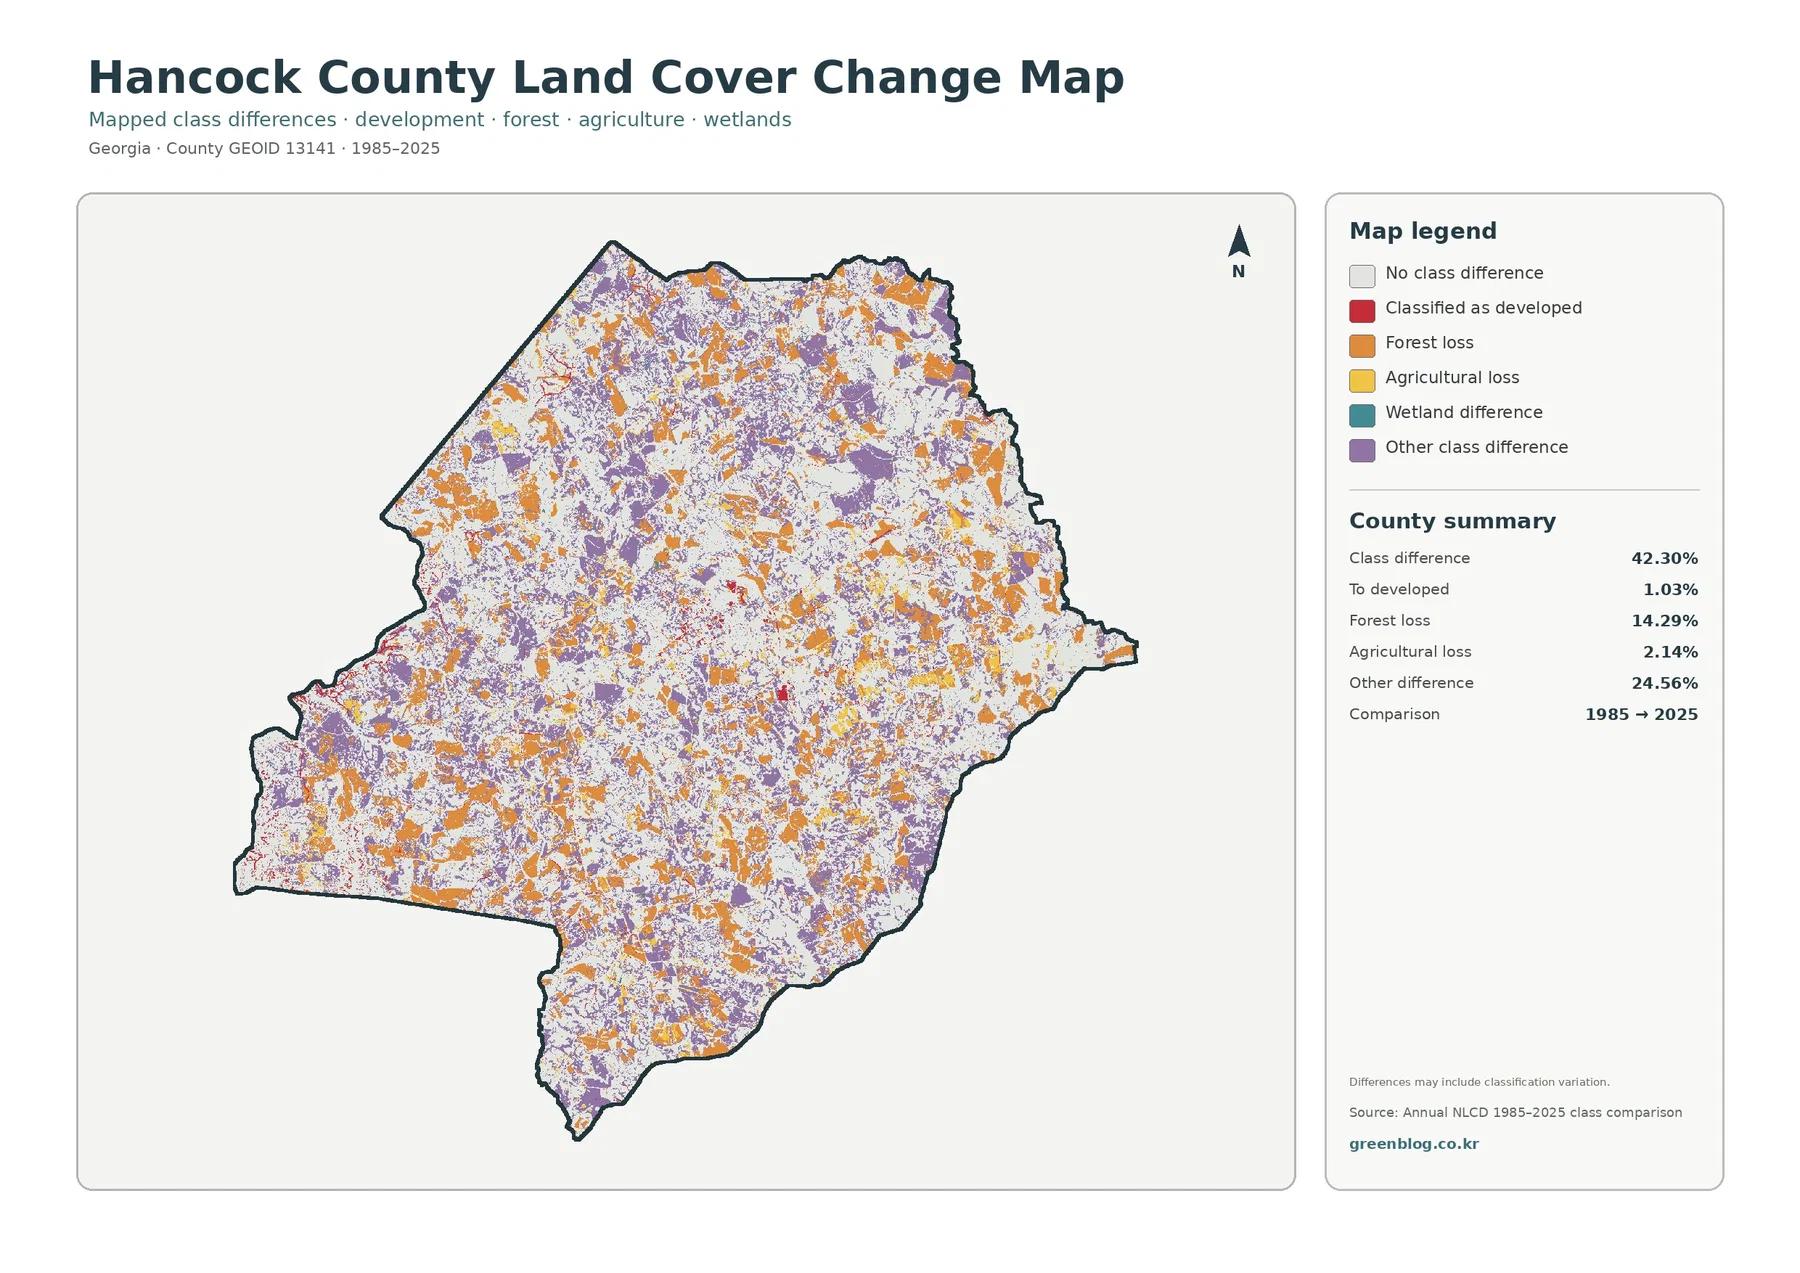
The 1985–2025 comparison reports class difference across 42.30% of the mapped area. Within that summary, 1.03% is classified as change to developed land, 14.29% as forest loss, 2.14% as agricultural loss, and 24.56% as other class difference. Orange forest-loss patches and purple other differences are spread widely across the county, while red change-to-developed patches are much more limited.
That 42.30% number should not be described as a literal conversion of 42.30% of Hancock County to a new land use. The map itself warns that mapped differences may include classification variation. Changes in imagery, classification methods, mixed pixels, and the way a 30-meter cell is assigned to a class can produce differences even when the real-world change is less dramatic than the color suggests.
Forest loss at 14.29% is therefore best used as a screening signal rather than a parcel-level conclusion. Large repeated areas can point to places worth examining in historical aerial photography or forestry records. Small isolated patches should be treated more cautiously, especially where forest, shrub, grass, and agriculture already form a fine-grained mixture in the 2025 map.
The relatively small 1.03% change-to-developed category also helps put the current landscape in context. Sparta’s built area is easy to find today, but the long-term comparison is not dominated by red development change. Hancock County’s change map is more notable for widespread differences among forest and other cover classes than for one sweeping urban expansion front.
Lake Sinclair, creeks, and the Piedmont setting add context to the small water share
Hancock County’s official visitor page highlights the shores of Lake Sinclair and Shoulderbone Creek, while the county website describes the area as part of Georgia’s Piedmont. Those references help explain the physical setting behind the land-cover map: a largely wooded inland county with rolling terrain, local streams, and a limited amount of open water rather than a landscape dominated by large lakes.
Water is 1.29% in the 2025 land-cover summary, but wetlands are 4.70%. The distinction is important. Open water is mapped separately from wet ground and vegetation influenced by frequent or persistent moisture. Wetlands can therefore occupy narrow or scattered areas that are difficult to notice at page scale even when their countywide share is larger than the open-water class.
New Georgia Encyclopedia places Hancock County between the Oconee and Ogeechee rivers in east-central Georgia. The land-cover map does not draw those drainage systems or watershed boundaries, but that broader location is useful when the page is used for regional study. A reader interested in streams or watershed management should pair these land-cover maps with an official hydrography layer rather than trying to derive stream names from the blue and wetland classes alone.
A practical order for using the four-map set
Start with the general land-cover map when you need the fastest overview. It establishes the 64.91% forest share, the small central developed area, the scattered open-cover classes, and the locations where water and wetlands appear. Once that pattern is familiar, the forest-and-farmland map is better for separating cropland and pasture from shrub and grass cover.
Use the impervious-surface map when the question is specifically about hard built surfaces. It makes the contrast between developed classification and actual pavement or rooftop concentration much clearer. The 1985–2025 change map should come last, because it answers a different question: where the mapped class differs between two dates, not simply what covers the ground today.
For classroom or presentation work, showing the maps in that sequence reduces confusion between current conditions and historical comparison. For print use, keep the legend large enough to read and avoid enlarging individual 30-meter cells as though they were surveyed boundaries. If a specific place matters, crop an enlarged view for discussion but keep the full county map nearby so the location remains clear.
What the map can show well, and where another source is needed
Annual NLCD is designed for consistent land-cover mapping over large areas. USGS documentation describes the land-cover product at 30-meter spatial resolution, which is appropriate for countywide patterns but not for surveyed parcel boundaries. A single cell may contain trees, lawn, pavement, a structure, or water at the same time, while the mapped class represents the product’s classification for that location.
This matters in Hancock County because forest, grass, shrub, and agriculture frequently meet in small irregular patches. A crisp color edge on the map can look exact when zoomed in, but it should not be interpreted as a legal property line or a precise field boundary. The maps are strongest for comparing broad concentrations, recurring patterns, and relative shares across the county.
The change map has an additional limitation because it compares classifications from two dates. Its 42.30% difference figure includes categories that may contain classification variation, so it should be paired with dated aerial imagery or local records before making claims about logging, development, farm abandonment, or wetland change at a specific site.
When comparing these figures with older NLCD statistics found elsewhere, check the product generation and year combination first. Annual NLCD methods and classification products have evolved, and values from different releases may not be directly interchangeable. The percentages on this page are taken from the supplied Hancock County 2025 maps and the supplied 1985–2025 comparison.
Frequently Asked Questions
Why does Hancock County look so green if grassland and shrubland are also significant?
Forest is still the dominant class at 64.91%, so dark green covers most of the map. Grassland at 9.13% and shrubland at 8.44% are important but are split into many smaller patches. The forest-and-farmland view is the easiest way to separate those open-cover types from the much larger forest areas.
Does 4.84% developed cover mean 4.84% of the county is pavement and buildings?
No. Developed cover can include low-density areas where vegetation and other permeable surfaces remain between roads and structures. The mean impervious value is only 0.76%, which measures hard surfaces more directly. That is why the impervious map shows a much smaller and more concentrated footprint, especially around central Sparta.
Can the 42.30% class difference be used as Hancock County’s exact land-change rate?
No. The change map notes that classification variation may be included. The figure is useful for locating broad areas where the mapped class differs between 1985 and 2025, but exact site-level change should be verified with historical imagery, local land records, or other dated evidence.
Map File Information
The ZIP contains the four original JPG maps for Hancock County: land cover, forest and farmland, impervious surface, and 1985–2025 land-cover change.
- Included Files: Four original JPG land-cover maps
- File Type: JPG files in one ZIP archive
- Intended Use: Printing, education, presentations, and map-based projects
Related Maps
- Appling County Georgia Land Cover Map
- Atkinson County Georgia Land Cover Map
- Bacon County Georgia Land Cover Map
Sources and References
- MRLC Annual NLCD Data – official Annual NLCD data and product access.
- USGS Annual NLCD Land Cover Classification – land-cover classes and product documentation.
- Hancock County – Visit Us – local context for Sparta, Lake Sinclair, Shoulderbone Creek, and the county landscape.
- Georgia Department of Community Affairs – Hancock County and Sparta Comprehensive Plans – official planning documents for the county and city.
- U.S. Census Bureau TIGER/Line Shapefiles – official geographic boundary data.
Green Map creates custom-edited map images using open geographic data sources such as geoBoundaries, Natural Earth, OpenStreetMap, and government open data. These maps are edited visual materials, not raw data files, and are provided for education, documents, presentations, and graphic reference.