Black Hawk County is centered on Waterloo and Cedar Falls, and this page provides high-resolution JPG map files that can be downloaded directly from the map file box below. The same maps appear in the article as fast-loading WebP previews, so you can compare the county’s main roads, city locations, waterways, and elevation before choosing the full-size file you need. The general map follows U.S. 20, U.S. 218, U.S. 63, I-380, and the routes linking Waterloo with Evansdale, Hudson, Dunkerton, Gilbertville, and La Porte City. The water view makes Cedar River, West Fork Cedar River, Wapsipinicon River, Black Hawk Creek, and several small lakes easier to follow, while the elevation map shows a range of about 240 to 313 meters and separates the lower river corridors from the surrounding rolling ground.
Waterloo is the most useful first reference point for reading the county. Black Hawk County’s official website places the county offices in Waterloo, and the county’s published history explains that voters selected Waterloo as the county seat in 1855 after an earlier period when Cedar Falls held that role. That history fits the geography visible on the maps: Waterloo sits near the center of the county’s largest concentration of roads and development, while Cedar Falls immediately to the west forms another large city rather than a distant satellite. The two cities are close enough that their mapped urban areas approach and connect across the central Cedar Valley, yet each remains clearly identifiable on the city and general maps.
Outside the Waterloo–Cedar Falls core, the county becomes more dispersed. Hudson lies to the southwest, Dunkerton to the northeast, and Gilbertville and La Porte City toward the southeast. Evansdale, Raymond, and Elk Run Heights are much closer to Waterloo on the east and southeast sides of the urban area. The hydrography also changes from west to east: Cedar River dominates the central part of the county, while Wapsipinicon River forms a separate major water corridor near the eastern side. Reading the settlements and rivers together gives a much clearer picture of Black Hawk County than treating it only as a metropolitan map.
Table of Contents
Waterloo and Cedar Falls anchor the junction of U.S. 20, 218, 63, and I-380
The general county map is most useful when the road network matters. Waterloo is positioned near the center of the main urban area, with several major routes radiating outward. U.S. 20 crosses the county from west to east south of the central city core and passes near Evansdale and Raymond. I-380 joins the U.S. 20 corridor on the southeast side of Waterloo before continuing toward the southeast. U.S. 218 runs south from Waterloo, while U.S. 63 enters from the north and provides another strong north–south reference. Together these roads explain why the Waterloo area appears as the county’s main transportation hub on the map.
Cedar Falls occupies a broad urban footprint immediately west of Waterloo. The map shows a dense set of streets and transportation lines between the two cities, along with streams and the river system that helped shape the central valley. This is not a parcel-level municipal boundary product, so the shaded developed area should not be used to decide an exact city limit. Its value is broader: it shows the close relationship between the two largest mapped cities and makes it easy to follow the major routes that leave the urban area toward the rest of Black Hawk County.
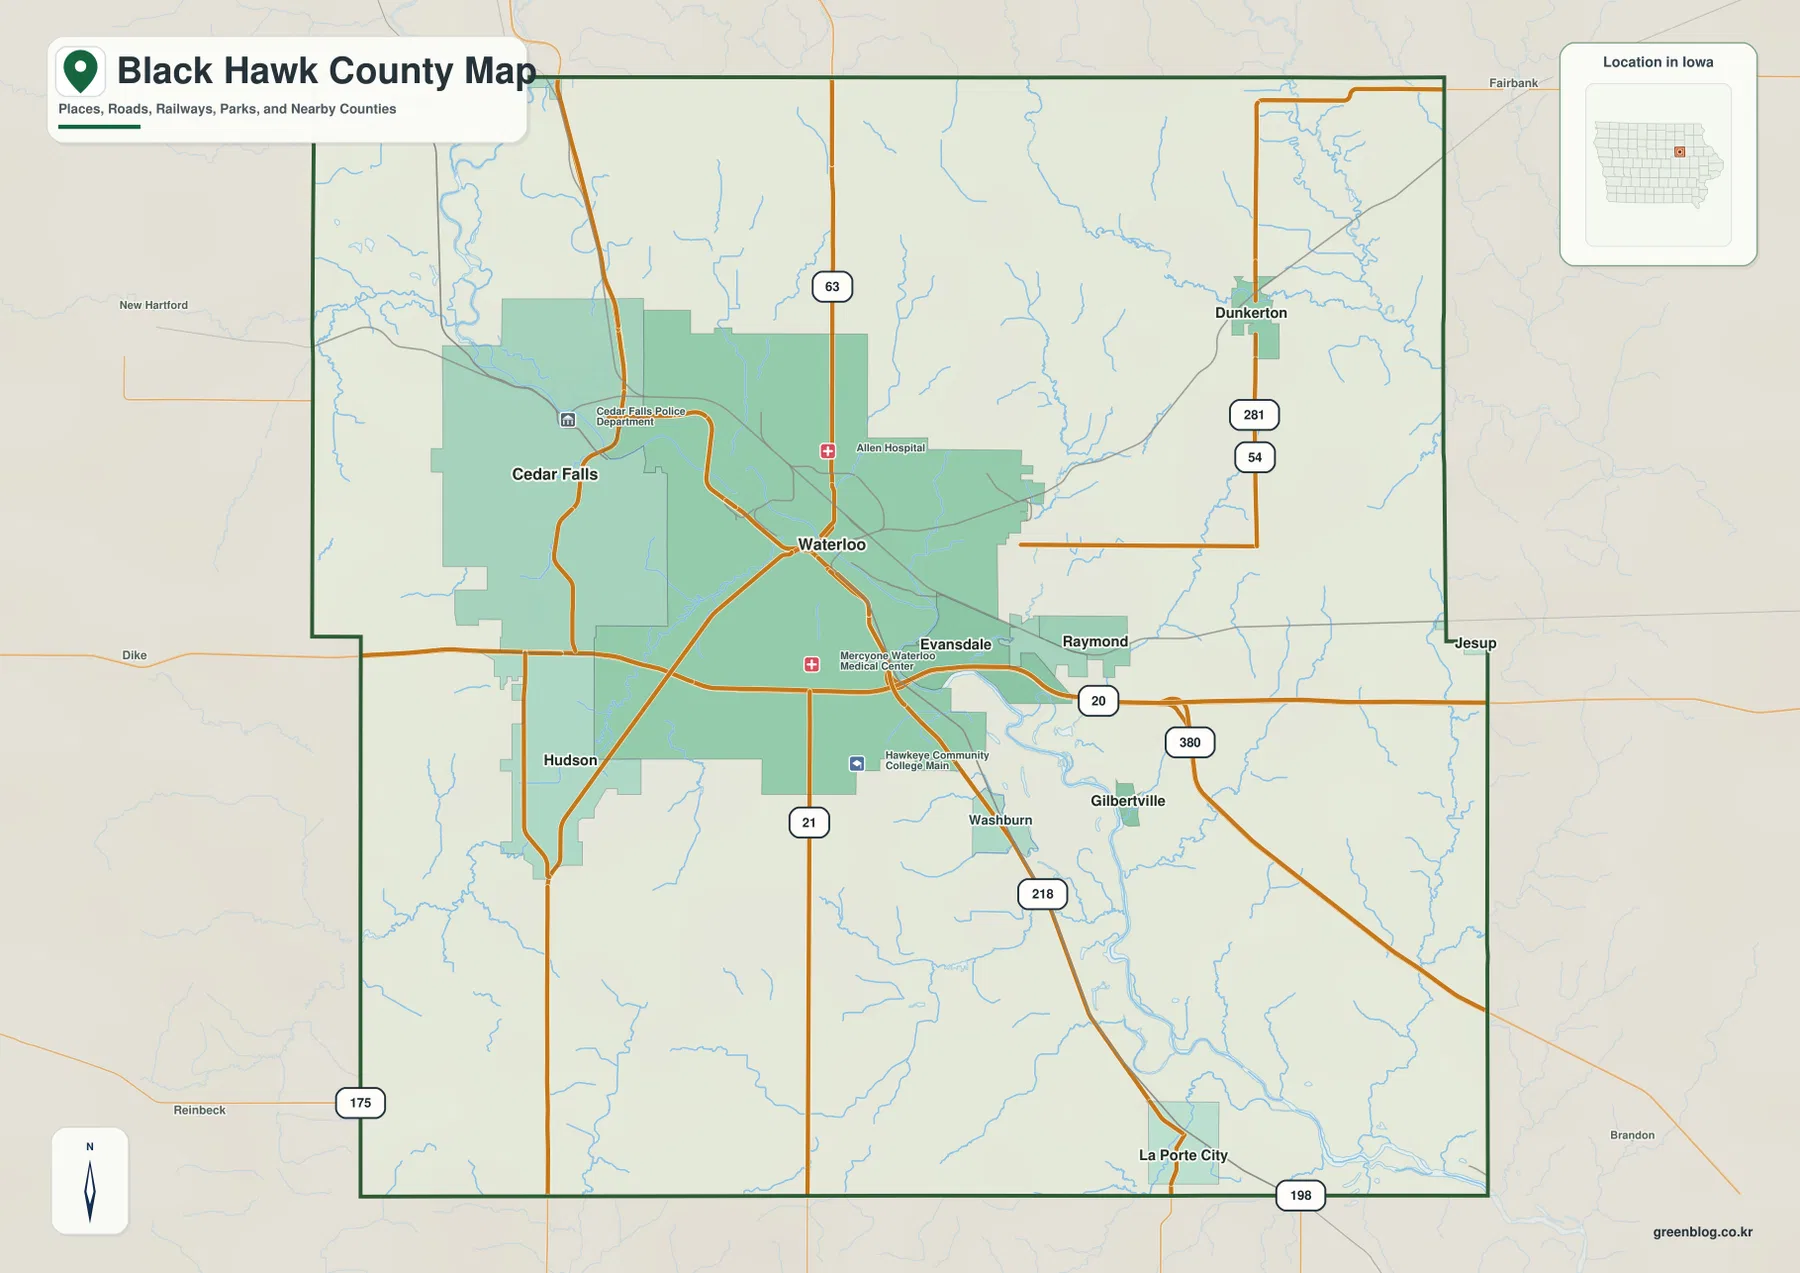
The smaller communities give the general map much of its geographic depth. Hudson is southwest of the main urban area and provides a useful reference for the southwestern part of the county. Dunkerton is northeast of Waterloo and sits near routes labeled 281 and 54 on the map, creating a very different road pattern from the central city grid. Raymond and Evansdale are close to Waterloo on the east, while Gilbertville is farther southeast. La Porte City lies near the southern edge and is separated from the main metro area by a long stretch of rural roads, streams, and rolling terrain.
The southeastern road pattern is easiest to understand by using U.S. 20, I-380, and U.S. 218 as reference lines. Once those are located, Gilbertville and La Porte City can be placed in relation to the larger Waterloo corridor. The general map also shows nearby places outside the county boundary, including Jesup, Fairbank, Reinbeck, and Dike, which helps explain how Black Hawk County connects with adjacent counties. Because this is a static reference map, it should not be treated as a live traffic source for closures, construction, congestion, or current detours.
The city view shows a tight Waterloo–Cedar Falls core and a much wider southern spread
The city map removes much of the road detail and highlights six major communities: Waterloo, Cedar Falls, Evansdale, Hudson, La Porte City, and Elk Run Heights. Waterloo and Cedar Falls sit close together in the central and western part of the county, while Evansdale and Elk Run Heights are clustered just east and southeast of Waterloo. Hudson is distinctly southwest of the core. La Porte City is the outlier, positioned near the southern edge of the county and separated from the central cities by a broad rural area. That simplified arrangement makes the city map especially useful when the question is location rather than route selection.
The printed city index shows reference values of 67,008 for Waterloo, 40,888 for Cedar Falls, 4,518 for Evansdale, 2,699 for Hudson, 2,071 for La Porte City, and 964 for Elk Run Heights. Those numbers are best treated as values printed on the source map, not guaranteed current population counts. Anyone who needs the latest official population should check the U.S. Census Bureau. For map reading, the more important information is the strong difference between the closely spaced Waterloo–Cedar Falls pair and the smaller communities spread toward the south and edges of the county.
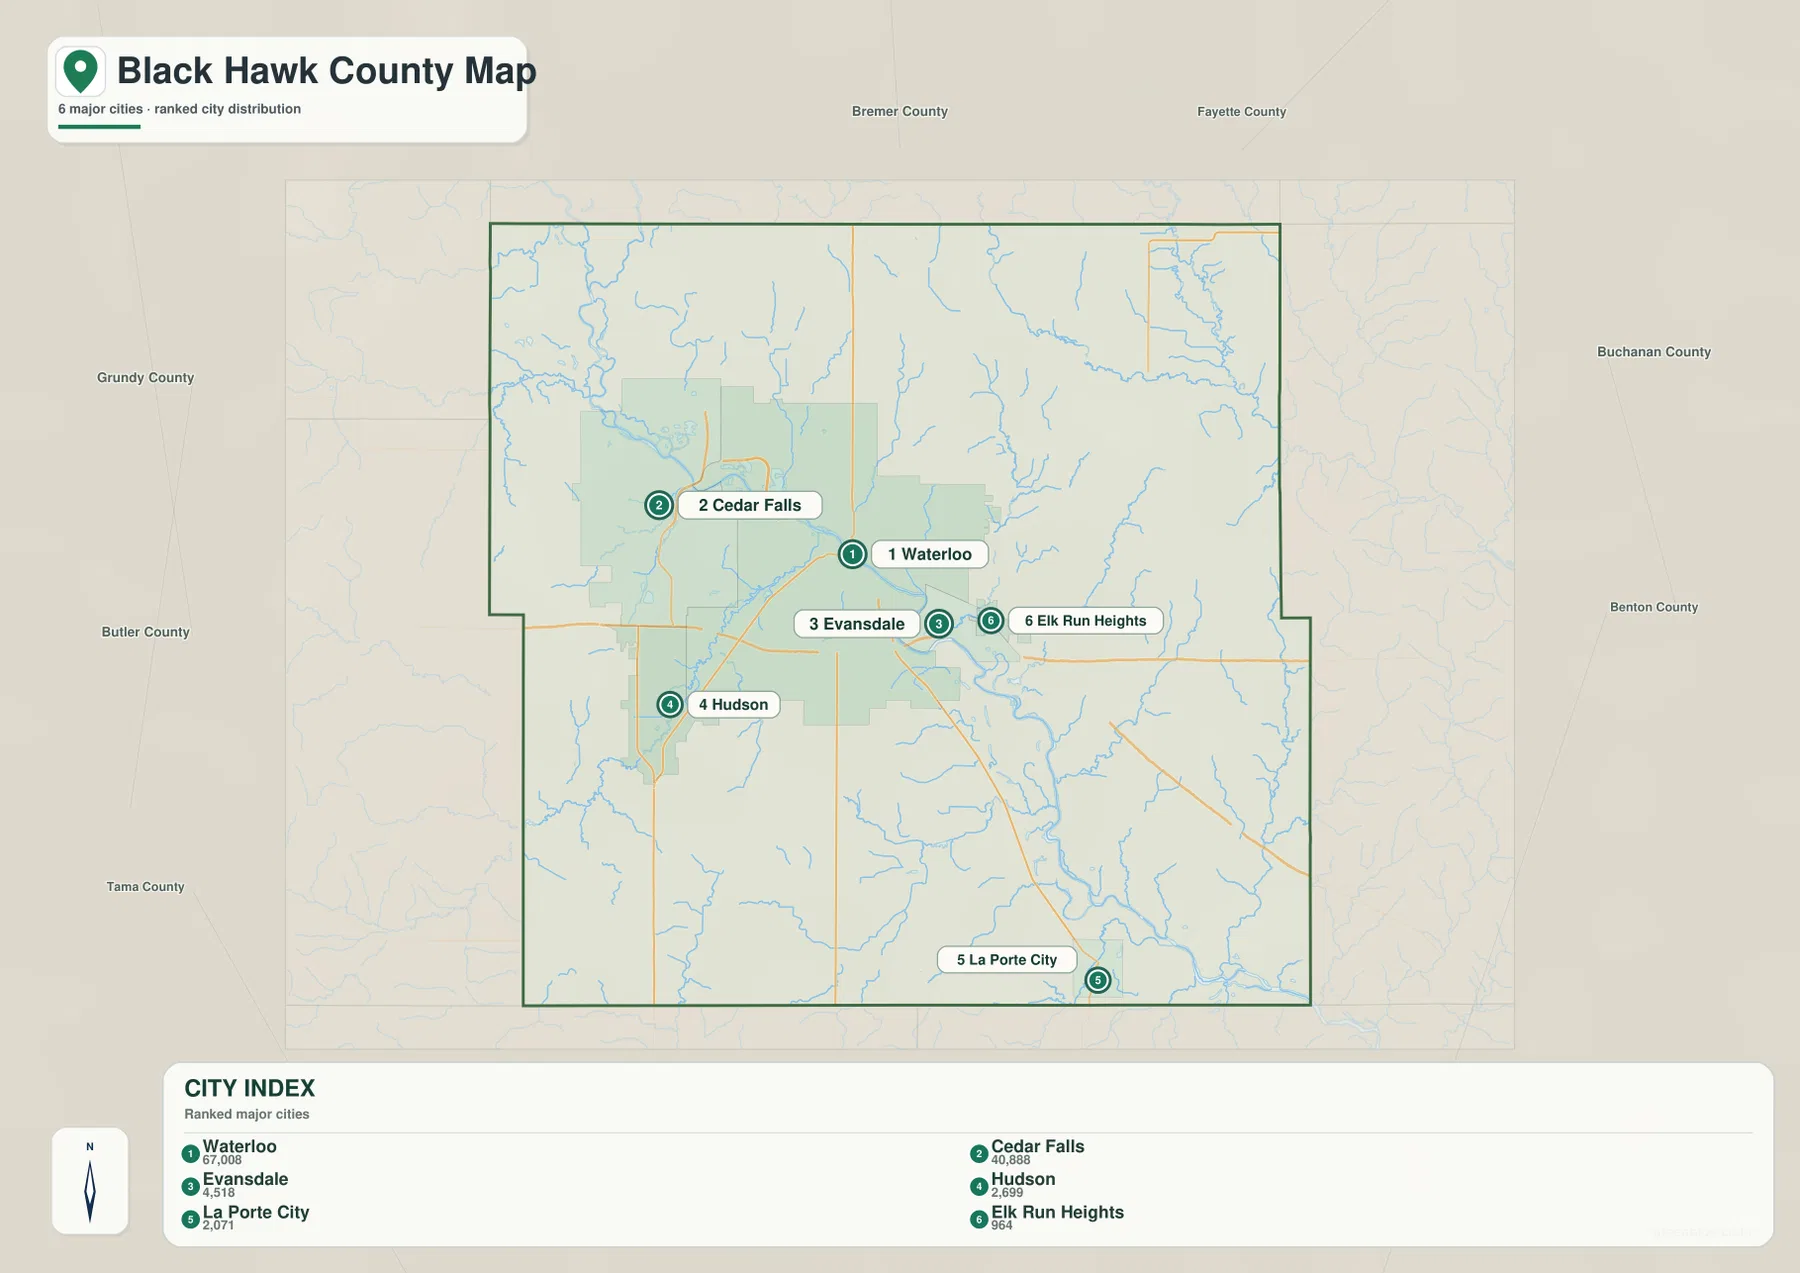
The proximity of Waterloo and Cedar Falls is one of the county’s defining visual features. On the general map, each city has a large developed footprint and a dense road network. On the city map, the same relationship is easier to see because the background information has been reduced. Waterloo then becomes the central reference for Evansdale and Elk Run Heights to the east, while Cedar Falls marks the western side of the primary urban concentration. The pair should therefore be read as two neighboring urban centers rather than as one large city and one distant small town.
La Porte City and Hudson provide useful contrasts. La Porte City is near the southern edge and belongs to a road-and-river setting that is visually separate from the main urban core. Hudson is closer to Waterloo but still lies outside the densest city cluster. If the task is a school report, county overview, or travel-planning sketch, the city map is a quick way to establish these broad relationships. When route numbers or stream crossings become important, the reader can move back to the general map and locate the same community in a more detailed setting.
Cedar River forms the central water corridor while Wapsipinicon River defines the east
The terrain-and-water map makes Cedar River the dominant feature of central Black Hawk County. The river enters the county from the northwest and bends through the Waterloo–Cedar Falls area before continuing toward the southeast. West Fork Cedar River is labeled in the northwestern part of the map, while Cedar River itself becomes the main channel through the central valley. Comparing this map with the general county map helps explain why the largest urban concentration occupies a broad river corridor rather than an arbitrary point in the middle of the county.
Wapsipinicon River is a second major water feature, but it belongs to the eastern side of the county and is clearly separated from the Cedar River system on the map. Smaller streams feed the county from many directions. Black Hawk Creek is prominent in the southwest, Spring Creek is labeled along the eastern side, and Miller Creek appears toward the south. The county therefore does not have one simple set of parallel streams; the map shows a branching network shaped by several larger river valleys and many short tributaries.
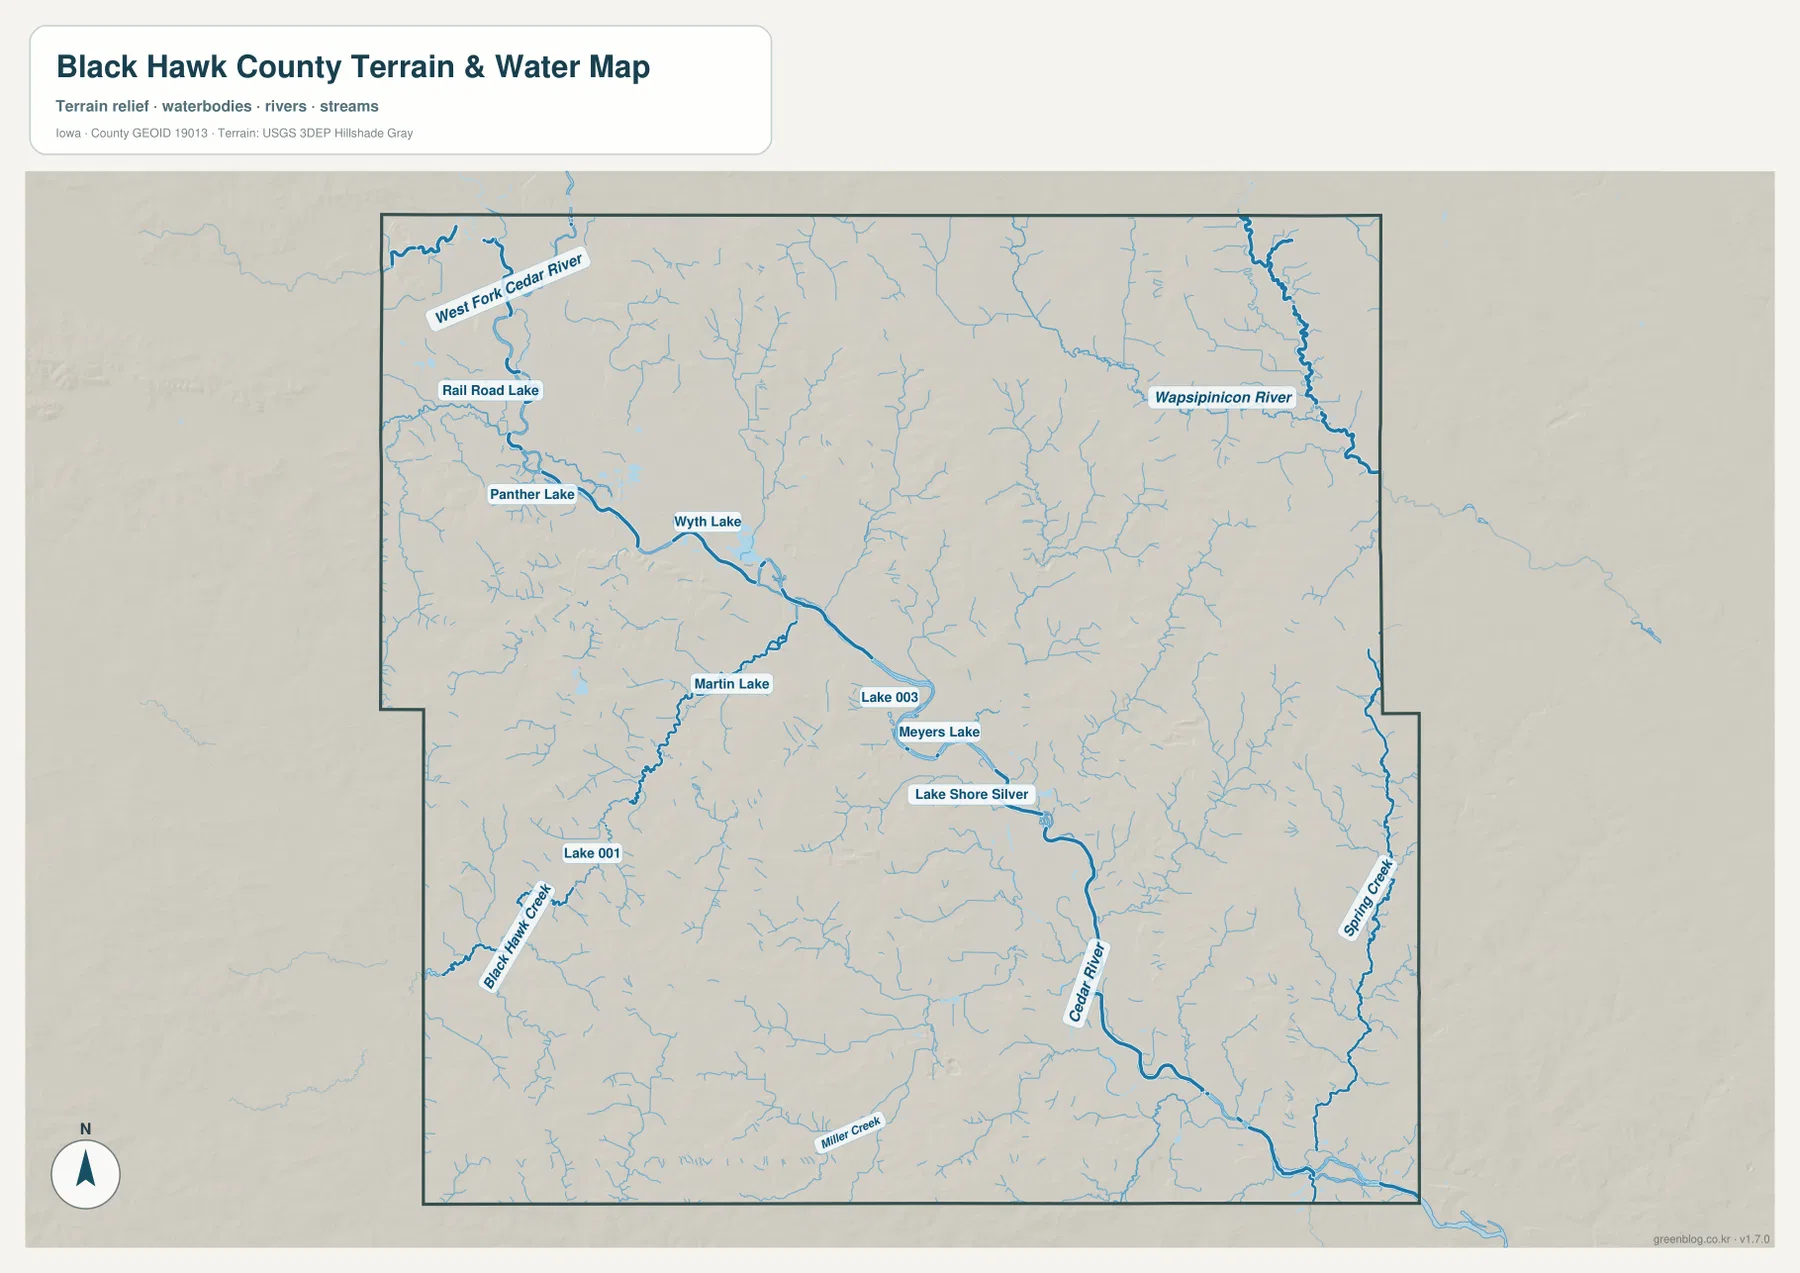
Several smaller water bodies are labeled as well, including Rail Road Lake, Panther Lake, Wyth Lake, Martin Lake, and Meyers Lake. They help fill in the local water geography around the major rivers and show that the urban county still contains many small water features. Black Hawk County Conservation states that it manages nearly 9,000 acres of public land, including parks, river accesses, wildlife areas, trails, and other open spaces. That county information provides useful context for a map where rivers and green corridors continue through and around the developed Waterloo–Cedar Falls area.
This water map should be used as a reference for the location of rivers, streams, and lakes, not as a flood-insurance, property, navigation, or live river-stage map. It does not show current water levels, flood probabilities, parcel ownership, channel depths, or water quality. Those decisions require current agency data. Here, the map’s best use is to locate the main water corridors and then compare them with the cities, roads, and elevation patterns shown on the other maps.
A 240–313 meter range separates broad river lowlands from higher rolling ground
The elevation legend shows an actual mapped range of about 240 to 313 meters, with a mean near 280 meters. Greens represent the lower part of that local range, while yellow, tan, and brown indicate progressively higher terrain. The most obvious low area follows Cedar River through the middle of the county. On the elevation image, a broad green corridor bends through the central area in the same general path as the river on the water map, making the connection between river location and low terrain immediately visible.
Waterloo and Cedar Falls occupy part of that lower central setting, but the county is not uniformly flat. Higher tan and brown ridges appear to the west and southwest, and another broad set of higher areas occupies the north and east. Numerous narrow green valleys cut into those uplands, reflecting the smaller creeks seen on the water map. The result is a rolling surface with a wide central valley and many smaller tributary cuts rather than a single flat plain stretching from one county line to the other.
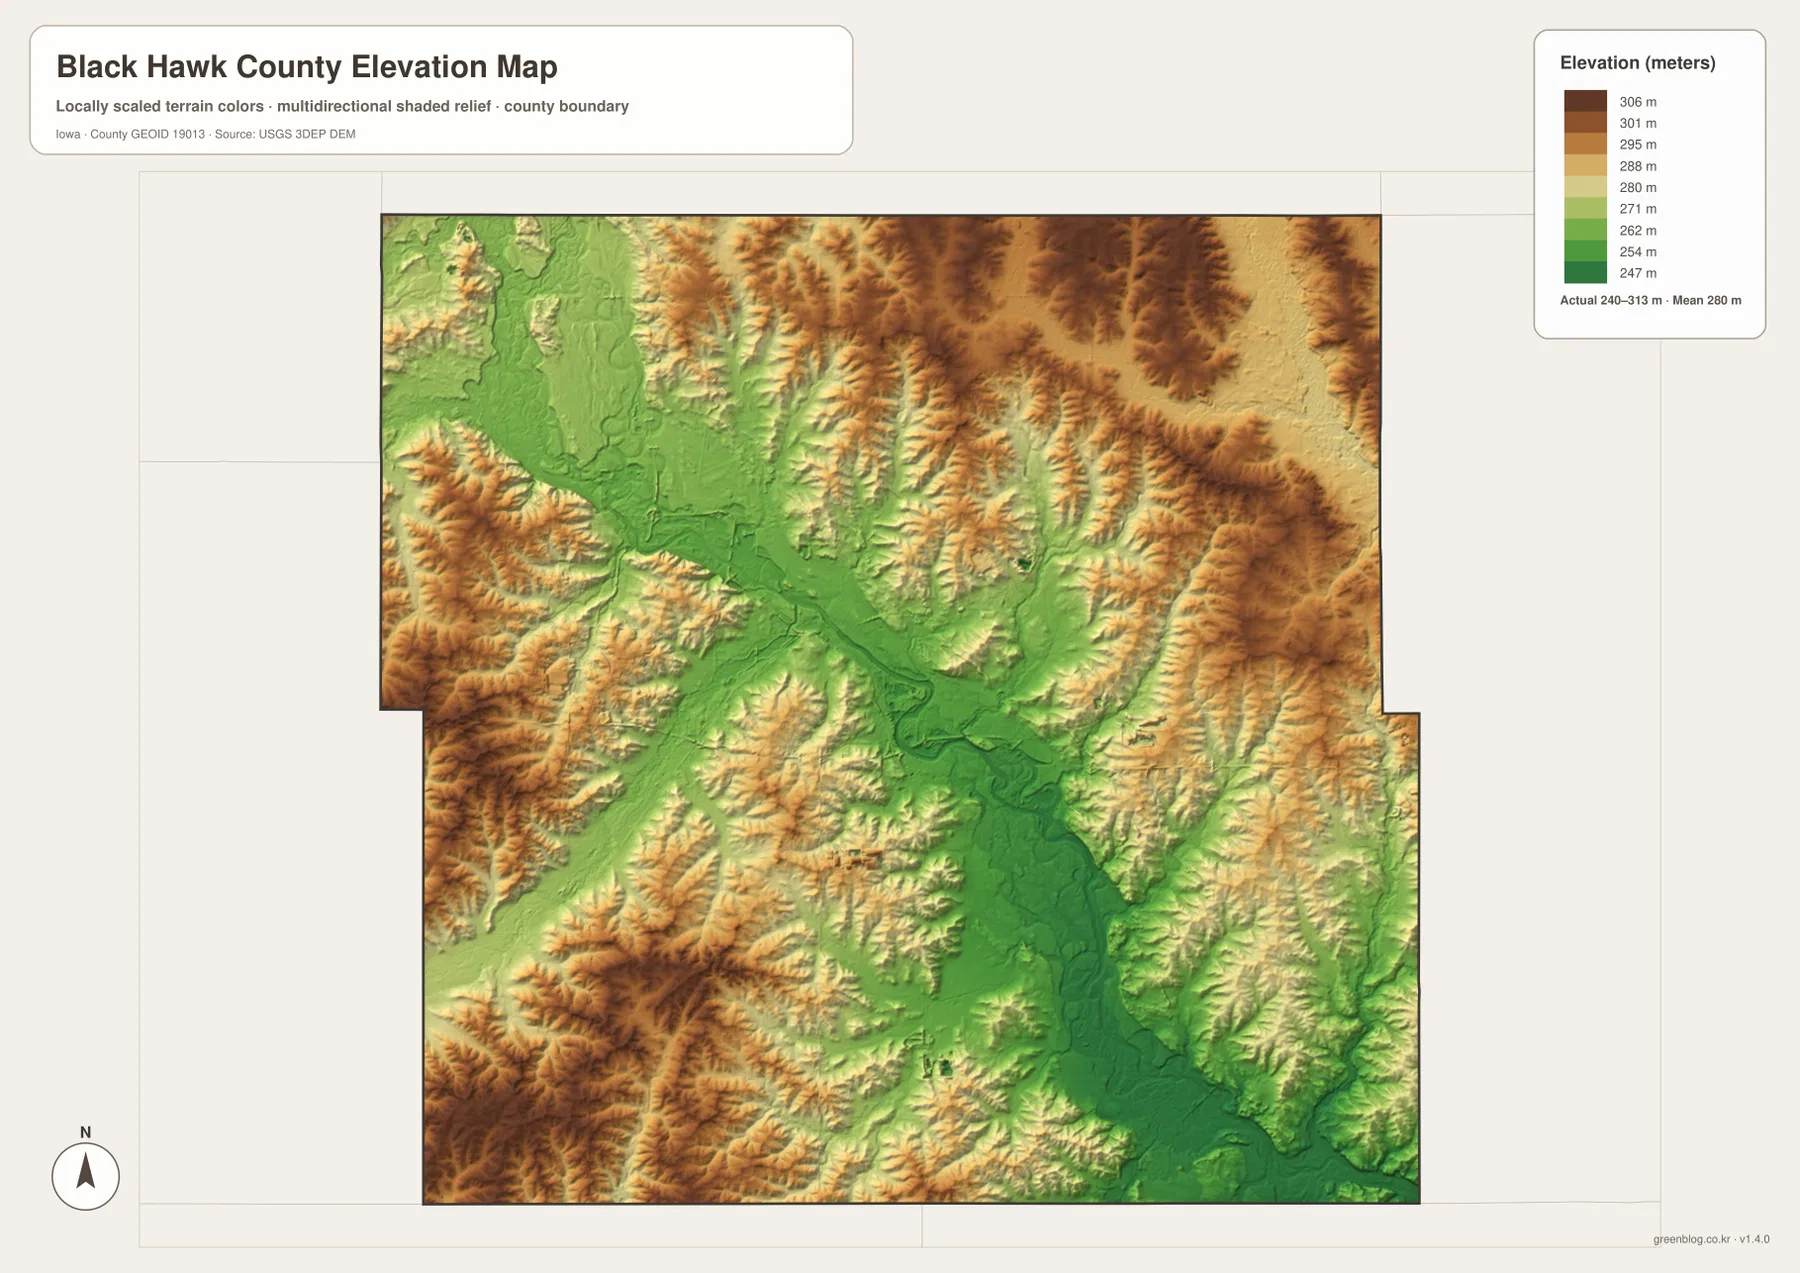
The eastern Wapsipinicon River corridor is lower than the ridges around it, but it appears narrower and more confined than the broad central Cedar River lowland. Toward the southeast, the lower terrain associated with Cedar River continues toward the county edge. These differences matter when comparing the city and road maps. A road that looks straight on the general map may cross several small valleys and ridges, while a community close to a river occupies a different local setting from a town on higher ground.
The elevation colors are suitable for county-scale comparison, not survey-grade engineering. The image is based on USGS elevation data and is useful for recognizing broad lowlands, uplands, and creek valleys, but it cannot determine the exact elevation or slope of an individual parcel, building site, or drainage project. For those purposes, a higher-resolution official dataset or field survey is required. On this page, the elevation map is most useful when paired with the hydrography to explain the shape of the Cedar and Wapsipinicon valleys.
Combining the four views makes the urban core and rural edges easier to understand
For Waterloo and Cedar Falls, begin with the general map and then switch to the city map. The general map provides route numbers, waterways, and the shape of the developed area, while the city view simplifies the county to the six highlighted communities. This combination makes it easy to see that Cedar Falls is immediately west of Waterloo, that Evansdale and Elk Run Heights sit on the eastern side of the core, and that Hudson and La Porte City occupy much more separated positions to the south and southwest.
When the goal is to understand Cedar River rather than the road network, the water and elevation maps are the stronger pair. First locate Cedar River, West Fork Cedar River, Wapsipinicon River, Black Hawk Creek, and the larger named lakes on the hydrography image. Then compare the same areas on the elevation map. The low green corridors follow the rivers and many tributaries, while brown and tan ground rises between them. Around central Waterloo and toward the southeast, this relationship is especially clear because the broad river lowland remains visible across a long distance.
The rural portions of the county are also easier to interpret when the maps are combined. Hudson in the southwest, Dunkerton in the northeast, and La Porte City in the south do not share the same road or terrain setting. The general map explains their connections to the metro area, the water map shows the nearby rivers and creeks, and the elevation map reveals the surrounding hills and low corridors. A county overview that uses only the city map would miss those differences, while a road-only map would understate how much the river system shapes the landscape.
The WebP images embedded here are reduced previews for fast page viewing. The downloadable archive contains the matching original JPG files for the general county map, city map, terrain-and-water map, and elevation map. Each JPG is 3638×2572 pixels, giving more room to inspect route labels, smaller place names, stream names, and terrain detail when zoomed or printed. Reviewing the previews first is the easiest way to decide which full-size file is most useful for a particular project.
Static maps are excellent for location and landscape comparison, but any information that can change should be checked against a current official source. Current traffic and construction conditions require a transportation source, current population values should come from the Census Bureau, and water or elevation decisions should use the appropriate USGS or local agency product. The strength of this map set is that the same county can be viewed through roads, cities, water, and terrain without confusing those separate purposes.
Frequently Asked Questions
Which maps best show how Waterloo and Cedar Falls relate to Cedar River?
Start with the general county map to locate both cities and the major roads, then use the terrain-and-water map to follow Cedar River and West Fork Cedar River through the central part of the county. The elevation map adds the final layer by showing the river corridor as lower green terrain surrounded by higher rolling ground.
Are the population numbers printed in the city index current official counts?
They should be treated as reference values printed on the source map, not as guaranteed current statistics. The city map is most useful for comparing the positions and relative scale of Waterloo, Cedar Falls, Evansdale, Hudson, La Porte City, and Elk Run Heights. Use the U.S. Census Bureau for the latest official population figures.
What files are included in the downloadable ZIP?
The archive contains four high-resolution JPG files matching the general county map, city map, terrain-and-water map, and elevation map shown in the article. Each file is 3638×2572 pixels, so it provides more detail for zooming and printing than the embedded WebP preview.
Map File Information
Download the Black Hawk County maps shown in this article as high-resolution JPG files.
- Printable Size: 3638×2572 pixels each
Related Maps
Sources and references
- Black Hawk County official website — county government and Waterloo office context
- Black Hawk County Conservation — public lands, river access, parks, and conservation information
- Brief History of Black Hawk County — Cedar River valley and early county history
- U.S. Census Bureau TIGER/Line Shapefiles — county boundary and geography reference
- USGS National Hydrography — rivers and water-feature reference data
- USGS 3D Elevation Program — elevation reference data
Green Map creates custom-edited map images using open geographic data sources such as geoBoundaries, Natural Earth, OpenStreetMap, and government open data.
These maps are edited visual materials, not raw data files, and are provided for education, documents, presentations, and graphic reference.