Harris County in west-central Georgia is predominantly forested, with 67.94% forest cover in the supplied 2025 summary. Water along the western edge, broad wooded areas around the Pine Mountain region, and smaller developed clusters around the county’s towns give the map a varied pattern. This page compares the current land-cover map with a forest-and-farmland view, an impervious-surface map, and a 1985–2025 change map.
The four original JPG maps are available together in one ZIP download below. They are useful for printing, classroom work, presentations, or simply viewing the legends and county summaries at a larger size than the web previews.
Table of Contents
Forest dominates the county while Lake Harding gives the western edge a distinct water pattern
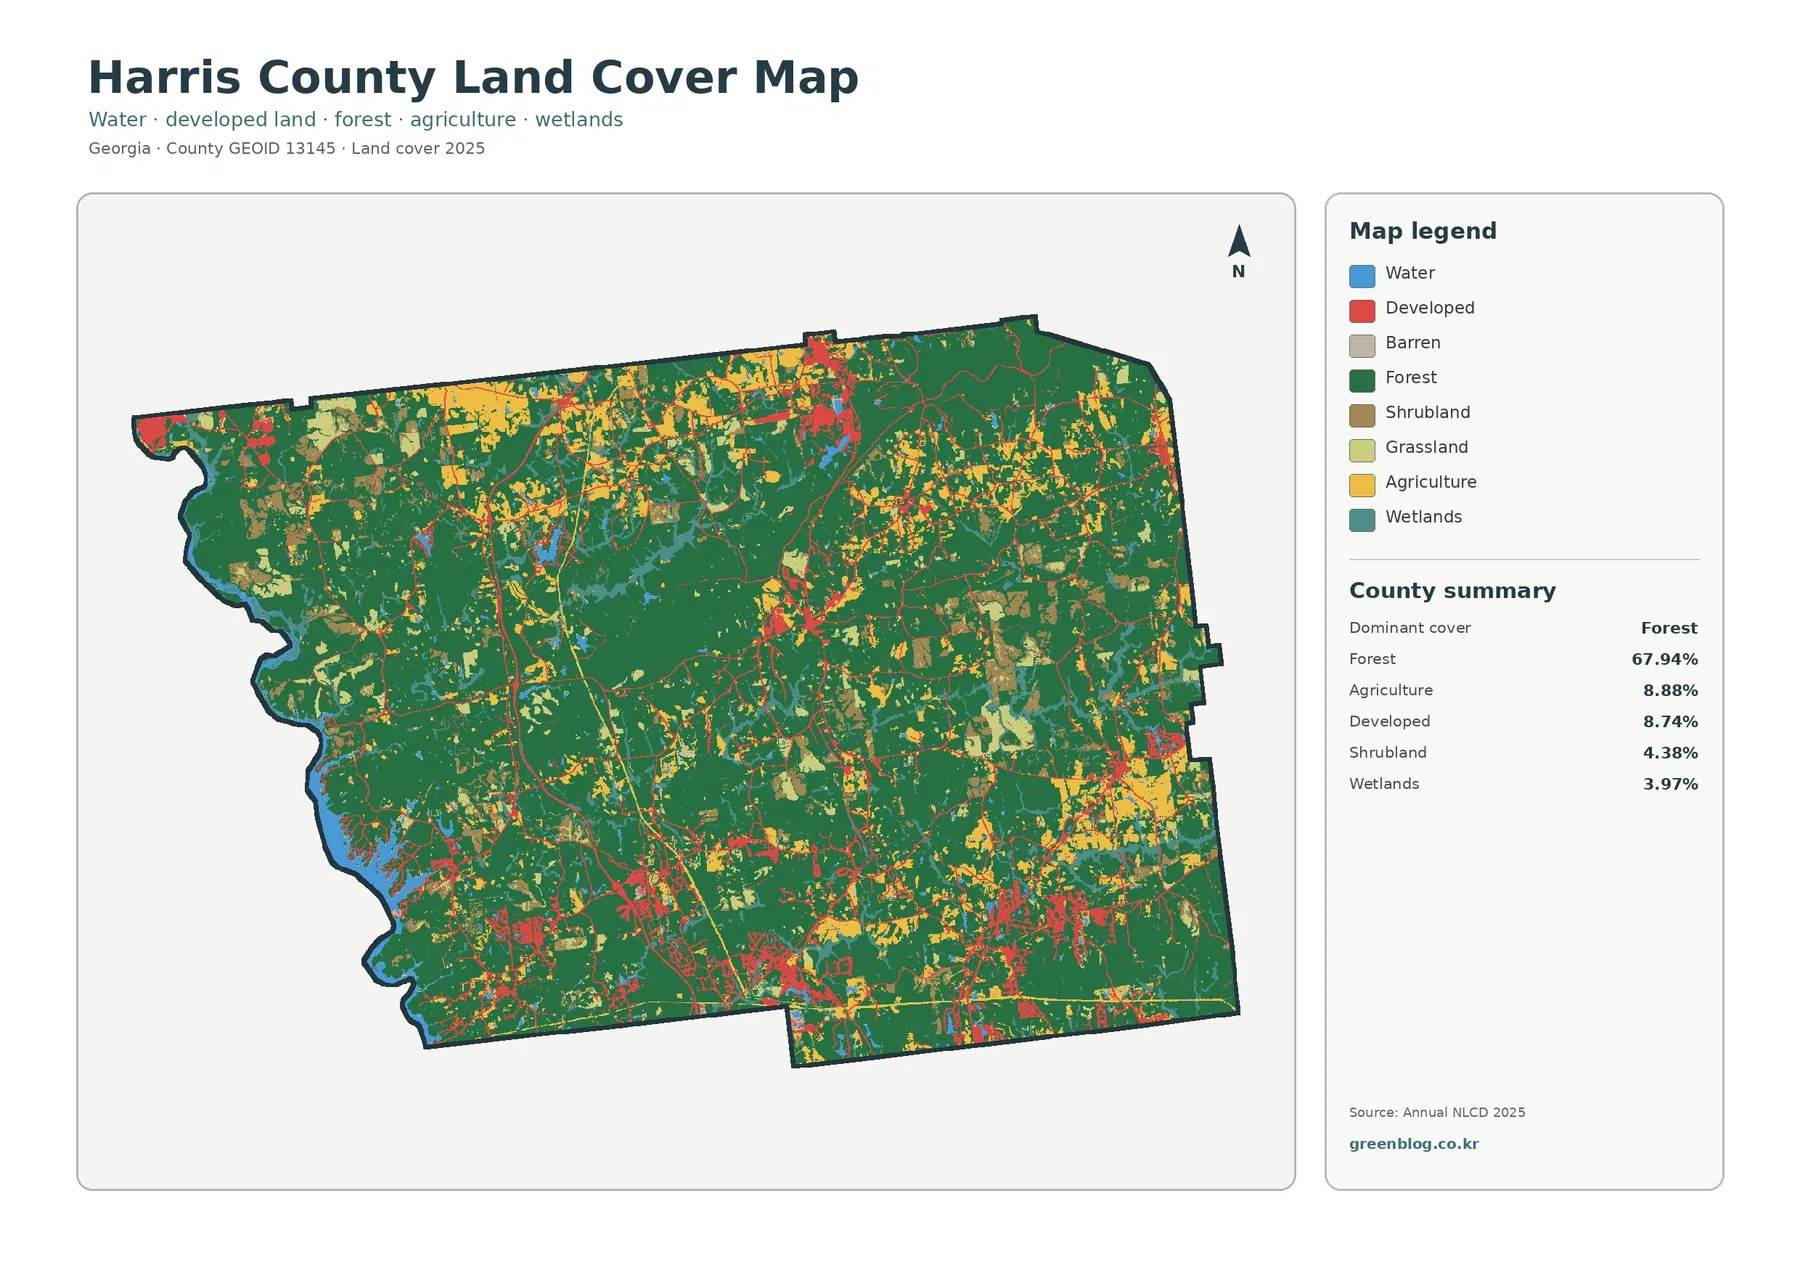
The 2025 map is green across most of Harris County. Forest accounts for 67.94% of the summary, so nearly two-thirds of the mapped surface falls in the forest class. Large wooded blocks are especially evident through the interior and northern half of the county. Agriculture, grassland, shrubland, wetlands, and developed areas interrupt that cover, but none approaches forest in total share.
Water is most recognizable on the western boundary. Harris County’s official attractions page describes Lake Harding as a reservoir on the Chattahoochee River along the Alabama border. The map shows a long blue edge there, with coves and narrow water features extending toward the county interior. Water represents 2.36% on the forest-and-farmland summary, a modest county-wide percentage but a major visual feature on the west side.
The north provides a different kind of reference point. Pine Mountain and much of F.D. Roosevelt State Park are associated with extensive wooded terrain, and Georgia State Parks describes the park as a large hiking landscape along Pine Mountain Ridge. The land-cover map does not show the park boundary, yet the broad forested surface in the north and northeast is consistent with that regional setting.
Developed cover makes up 8.74% of the county and appears as several separate clusters rather than one continuous city. Harris County’s official city page lists Hamilton, Pine Mountain, Waverly Hall, West Point, and Shiloh, along with unincorporated communities such as Cataula and Ellerslie. The scattered red patches on the map fit a county with multiple small centers separated by large rural and forested areas.
The rural landscape is more varied than the forest percentage alone suggests
Forest is the dominant class, but the county is not a single uninterrupted block of trees. Agriculture accounts for 8.88%, shrubland for 4.38%, wetlands for 3.97%, and the forest-and-farmland map lists grassland at 3.59%. These classes appear as irregular patches among the larger green areas, creating a mixed landscape around farms, settlements, stream corridors, and forest edges.
Agricultural cover occurs in several parts of the county rather than one concentrated farming district. Yellow cropland and lighter pasture or hay areas are particularly noticeable in parts of the north, east, and southeast. Many patches sit next to forest instead of replacing it across a wide continuous area, which gives the county a fine-grained mixture of woods and open land.
Land cover should not be confused with legal land use. A cell classified as agriculture does not automatically define a farm parcel, and a forest cell does not prove that the land is protected. Annual NLCD classifies the physical surface observed from remote-sensing data. Zoning, ownership, permitted use, and parcel boundaries come from different sources.
Wetlands also deserve attention because their 3.97% share is larger than the water share. Teal patches follow narrow drainage areas and occur near the western water system as well as farther inland. At county scale these features help identify where wet cover is more common, but a detailed wetland boundary or jurisdictional decision requires specialized wetland information and field verification.
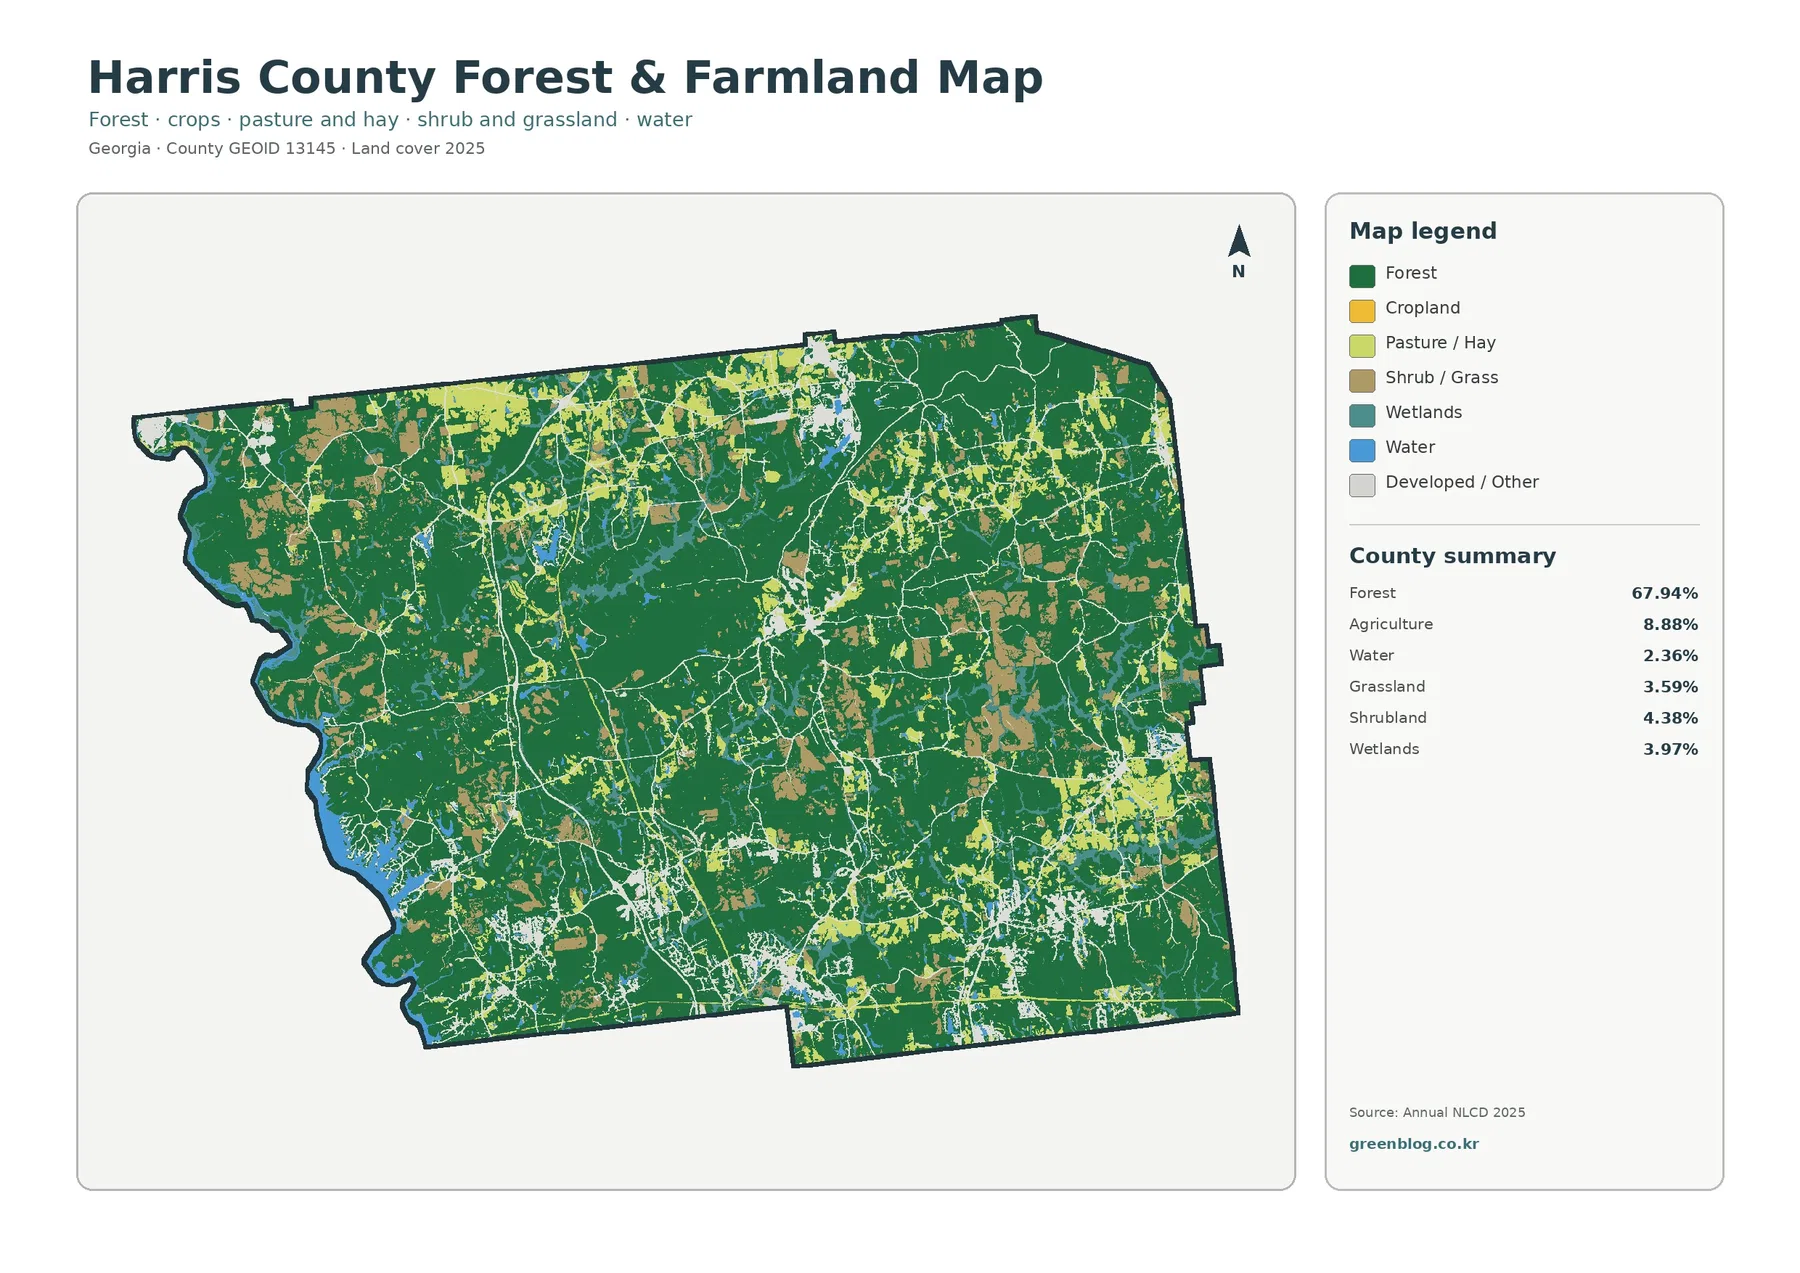
Forest, pasture, crops, and shrub cover become easier to separate in the second map
The forest-and-farmland map reduces the number of competing colors and makes the rural pattern easier to follow. Forest remains broad through the north, interior, and much of the west. Cropland, pasture or hay, and shrub or grass form smaller openings within that forest, while developed/other cover traces towns, roads, and other built areas.
Pine Mountain provides useful context for the northern wooded area. Harris County identifies Pine Mountain as home to Callaway Gardens and much of F.D. Roosevelt State Park, while the state park site describes forested trails across Pine Mountain Ridge. Those references help explain the regional setting, but the raster colors should not be treated as exact park or property boundaries.
The southern and eastern portions contain more frequent mixtures of open land and developed/other cover. Forest is still common, yet the green areas are broken by pasture, crops, shrub or grass, and settlement-related surfaces. This is a good example of why county-wide percentages need a map: two places can both be “mostly forested” while differing greatly in how continuous the forest actually is.
Annual NLCD is a 30-meter raster, meaning the landscape is divided into grid cells and each cell receives a representative class. A small road, trees, grass, and part of a building can occur inside the same cell. The map is therefore useful for broad patterns, but the edge between green and yellow should not be read as a surveyed farm or property line.
A 1.60% mean impervious value highlights how compact the hardest surfaces are
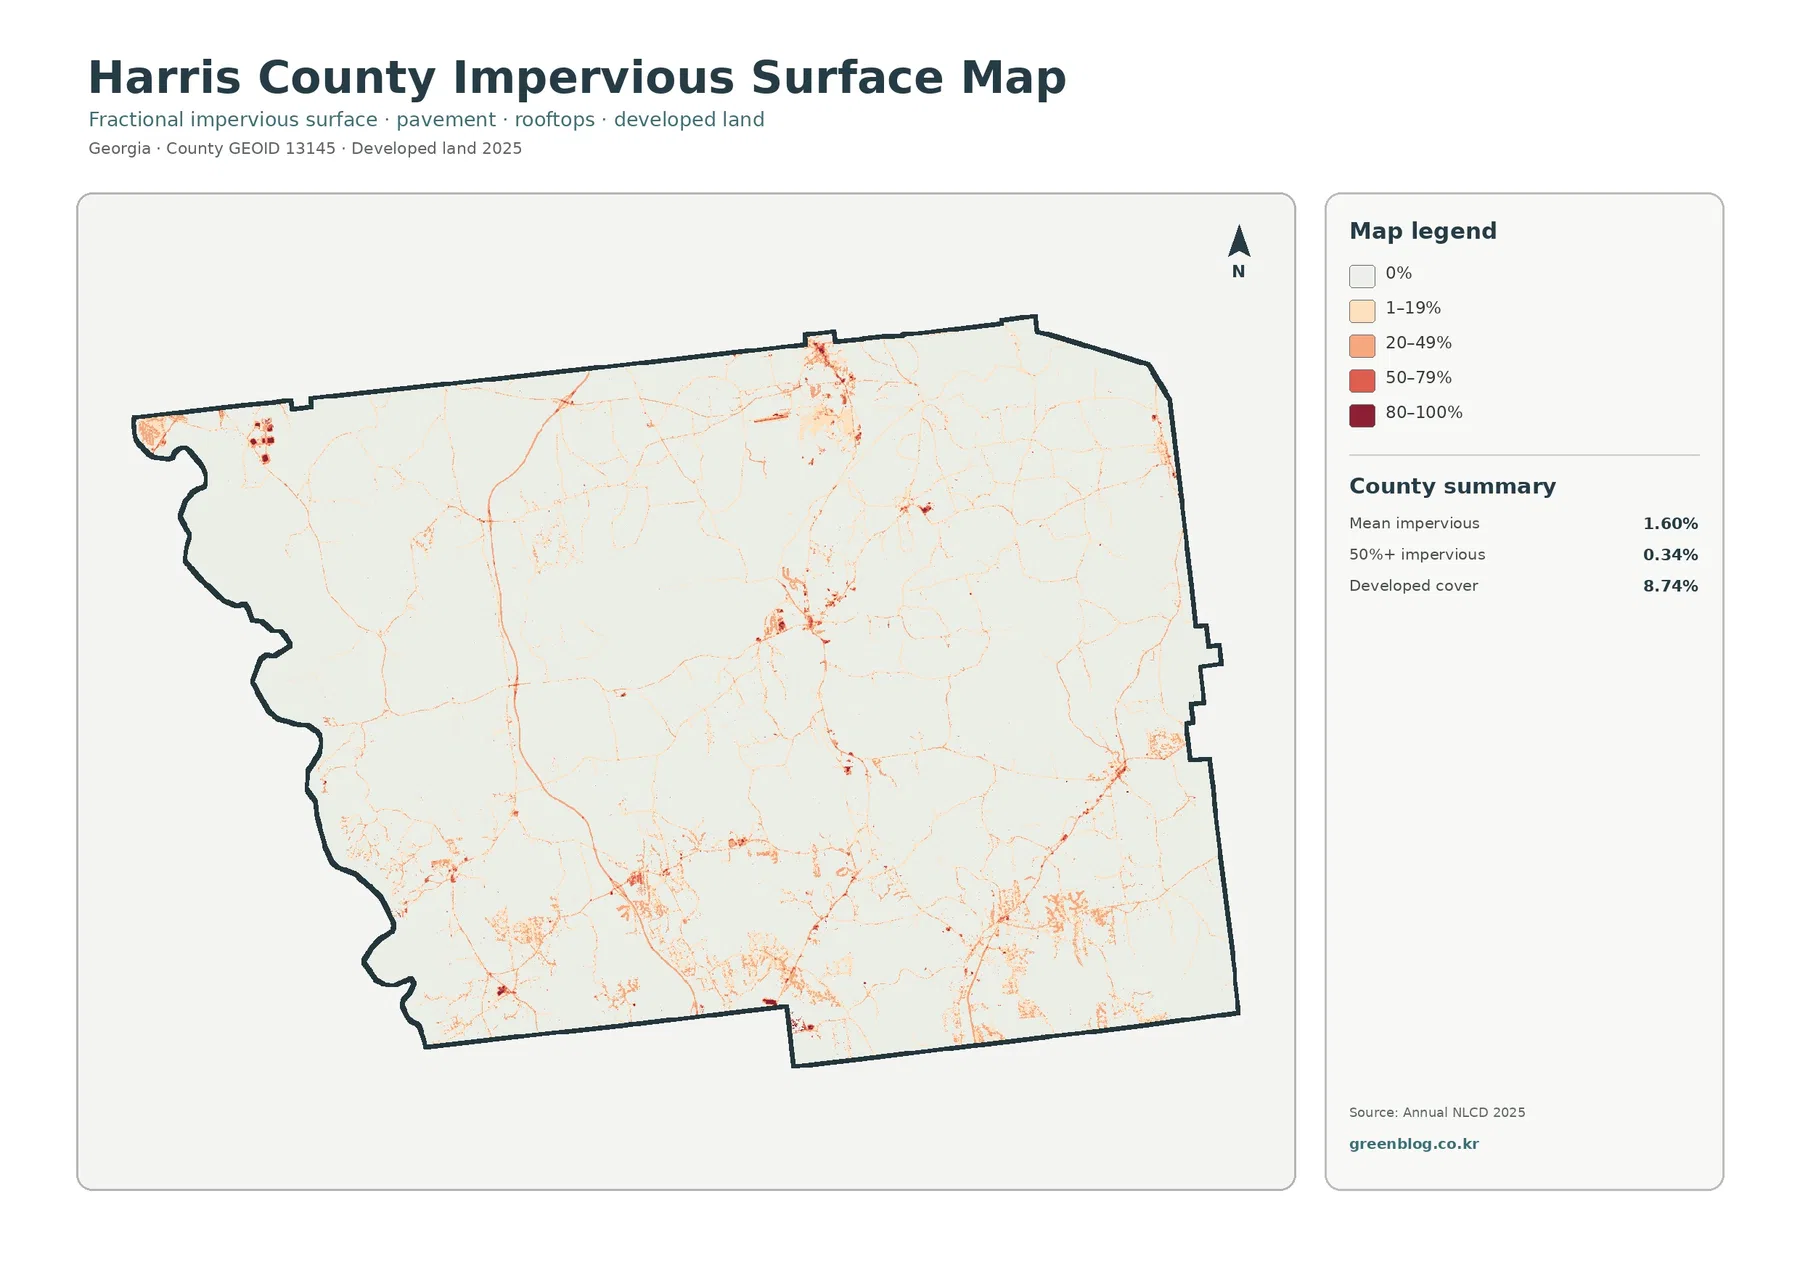
Impervious surface means pavement, rooftops, parking areas, and other hard surfaces that do not readily absorb water. Harris County’s mean impervious value is 1.60%, and only 0.34% of mapped cells are at least 50% impervious. Those figures are far below the 8.74% developed-cover share because developed land can include large amounts of grass, trees, and other permeable surface.
The darker impervious values occur in small concentrations around established settlement centers. Broadly, they appear near Pine Mountain in the north, Hamilton near the center, and several southern or southeastern communities. Smaller concentrations also occur toward the northwest and along connecting road corridors. Most of the county remains very light on this map, reflecting the large forest and rural land base.
Hamilton is useful as a central reference because Harris County identifies it as the county seat. Pine Mountain, Waverly Hall, West Point, and Shiloh provide other official community anchors, while Cataula and Ellerslie are among the unincorporated communities. Comparing those known locations with the hard-surface pattern is helpful, but municipal limits are not drawn here, so individual cells should not be assigned to a city without a boundary layer.
The county average can hide strong local differences. A 1.60% mean does not mean that every neighborhood or commercial center is lightly paved. For questions about runoff, drainage, or heat, the location of the higher-value cells matters more than the county average alone. A full assessment would also require terrain, soils, rainfall, drainage infrastructure, and current engineering data.
The 1985–2025 comparison reports a 30.49% class difference, not a confirmed conversion rate
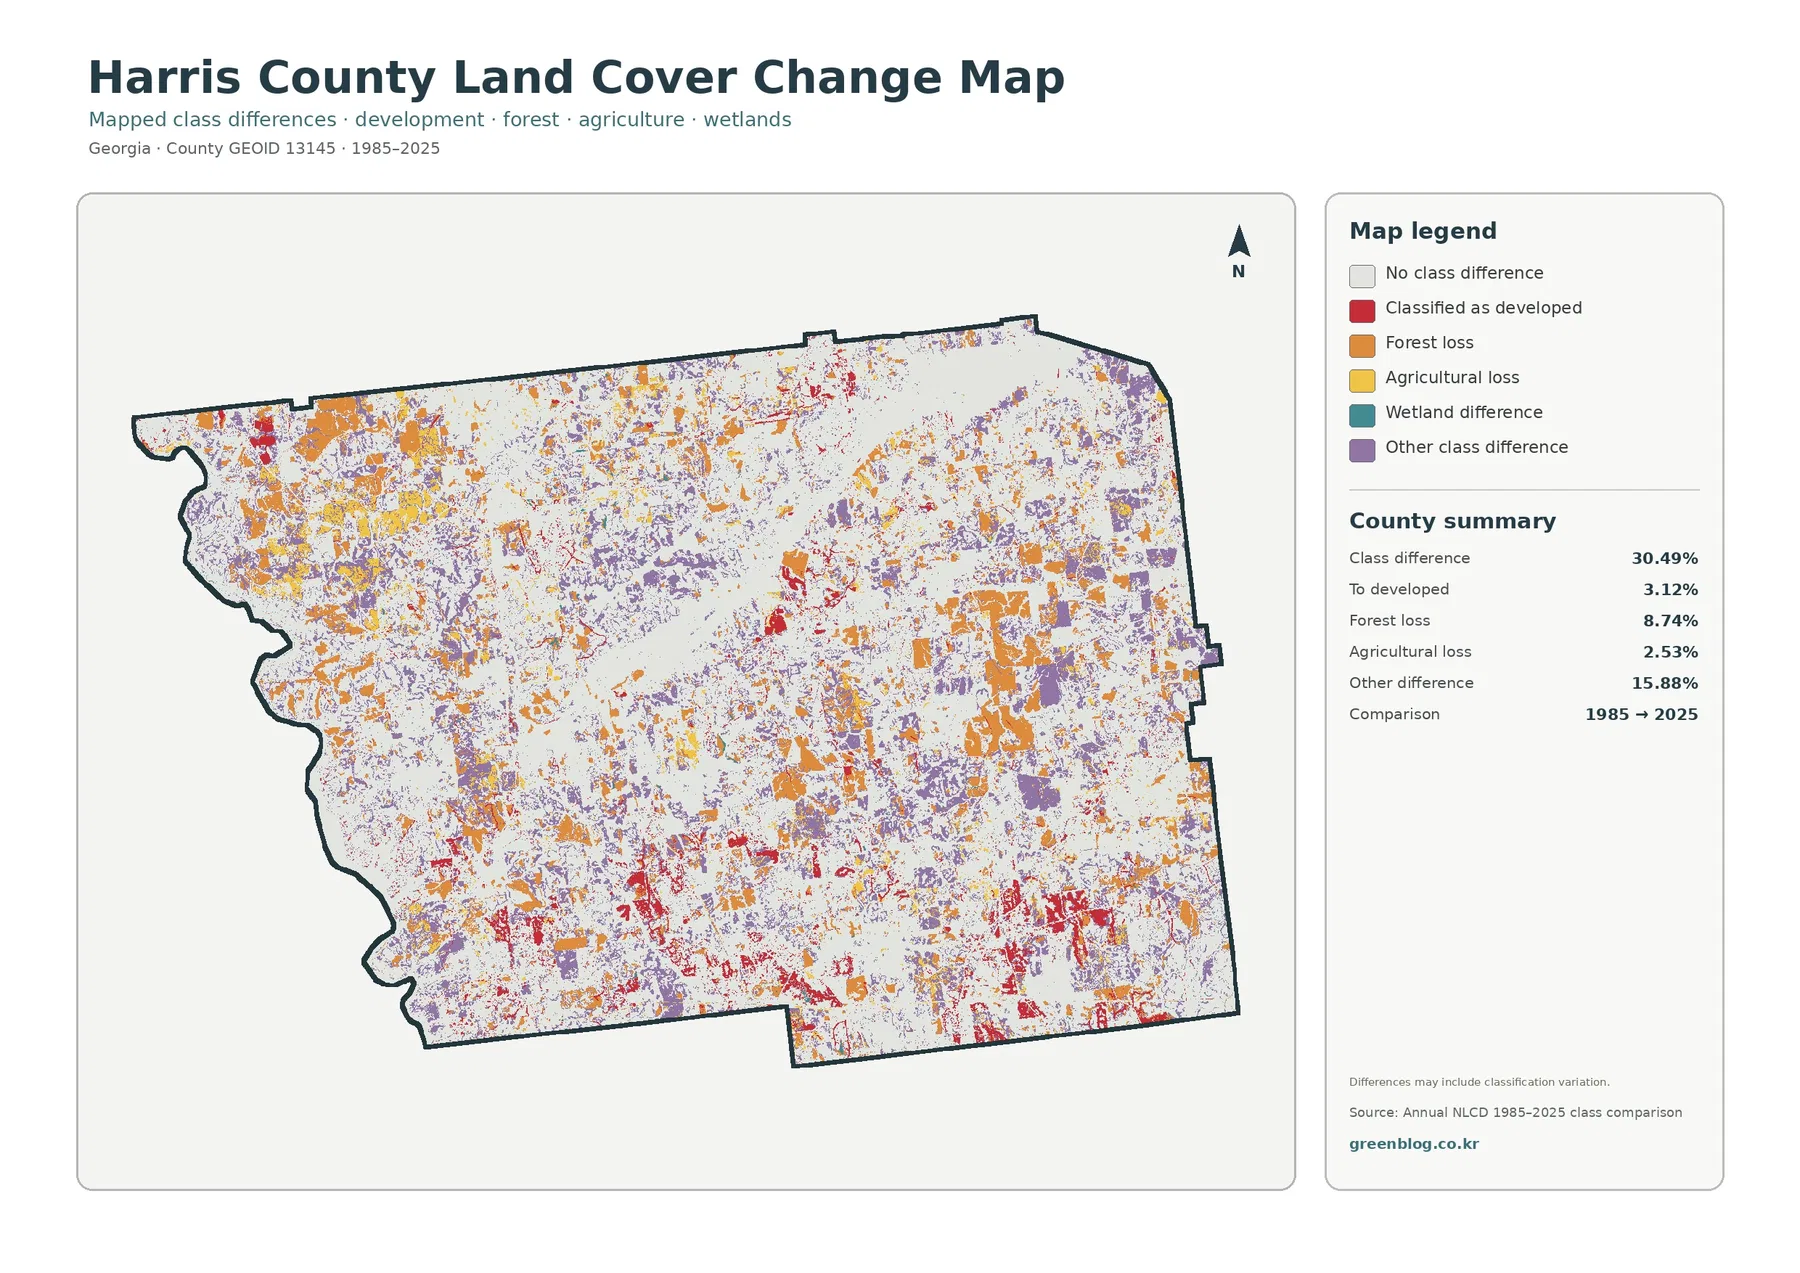
The supplied change map reports a total class difference of 30.49% between 1985 and 2025. It also lists 3.12% classified to developed, 8.74% forest loss, 2.53% agricultural loss, and 15.88% other class difference. Orange forest-loss and purple other-difference patches are widely scattered, while red areas classified to developed are more concentrated around settlement and transportation areas.
The 30.49% figure needs careful wording. The map notes that the differences may include classification variation. Changes in imagery, classification methods, observation conditions, or mixed pixels can alter a cell’s assigned class even when the real-world surface did not undergo an equally large change. The number should therefore be treated as a map-to-map class difference, not as a verified share of the county that physically changed use.
Forest loss at 8.74% appears in many separate patches. Some are near present-day open land or development, while others lie inside areas that remain largely forested in 2025. A single orange patch cannot tell us whether the cause was timber harvest, land clearing, storm effects, a temporary change in vegetation, or classification variation. Historical aerial imagery and local records are needed for that level of interpretation.
The 3.12% classified-to-developed value is easier to understand beside the current 8.74% developed share. Red change areas appear around several built centers and corridors but do not dominate the map. The long-term pattern is therefore more complex than a simple story of urban growth replacing forest across the county; it includes development-related differences alongside many forest and other class changes.
Lake Harding, Hamilton, and Pine Mountain give the county map three practical reference points
Lake Harding is the clearest western reference. Harris County describes the reservoir as part of the Chattahoochee River along the Alabama border. On the land-cover maps, water, wetlands, and forest meet along this edge, while developed surfaces remain comparatively localized. That combination makes the west side useful for comparing aquatic and wooded cover in the same view.
Hamilton serves as a central reference because it is the county seat. Developed and impervious cells gather around the central part of the county, then thin into narrow lines and smaller patches toward surrounding rural areas. This illustrates an important point: a county can have a clear administrative center without having one dominant urbanized surface that controls the entire land-cover pattern.
Pine Mountain provides the northern reference. The official county city page connects the town with Callaway Gardens and much of F.D. Roosevelt State Park, while state park information emphasizes wooded trails along Pine Mountain Ridge. The northern forest on the map fits that broader landscape context. Exact park, resort, and municipal boundaries still require separate official maps.
Waverly Hall and the communities farther south and southeast offer a different comparison. Here, forest is more frequently mixed with agriculture, pasture, roads, and small developed patches. The county’s list of incorporated and unincorporated communities helps explain why the built pattern is dispersed rather than concentrated in only one place, without turning that spatial association into a claim about the cause of development.
A simple four-map workflow keeps present cover, hard surfaces, and change separate
Start with the general land-cover map for the fastest county-wide overview. It shows where the 67.94% forest majority is continuous, where agriculture and wetlands interrupt it, where Lake Harding shapes the west, and where developed cover forms separate clusters. Looking at large areas first makes the smaller maps easier to interpret.
Use the forest-and-farmland map when the question is about rural surface types. Cropland, pasture or hay, and shrub or grass are separated, so open land does not have to be treated as one category. Move to the impervious map when you want to know where pavement and rooftops are most concentrated inside the broader developed class.
Review the change map last. Once the present-day pattern is familiar, the 30.49% class-difference value is less likely to be mistaken for a direct land-conversion rate. This sequence also works well in classrooms and presentations because each map answers a different question without asking one layer to provide information it was not designed to measure.
For printed use, combine the county-wide map with enlarged views of the Lake Harding shoreline, northern Pine Mountain forest, and the Hamilton area. The original JPG files preserve the legends and summary panels at a size that is more useful for slides, handouts, and larger displays than the web previews.
Reading the maps as county-scale evidence rather than parcel or zoning maps
Annual NLCD is designed for consistent regional land-cover mapping, not parcel surveying. USGS documentation describes the product as a 30-meter raster. Each cell receives a representative class even when several surface types occur inside it, so the boundary between forest and agriculture is a classified grid boundary rather than a surveyed property line.
Developed cover and impervious surface should also remain separate concepts. A low-density residential cell can be classified as developed while still containing substantial trees and grass. Impervious surface focuses on the hard portion. Comparing both layers gives a more useful picture of small towns and rural development than substituting one measure for the other.
The change layer carries additional uncertainty because it compares classifications from two years. Its warning about classification variation is important, especially for small scattered patches. Confirmation of forest clearing, new construction, agricultural conversion, or wetland change requires historical imagery, permits, land records, or other independent evidence from the relevant period.
Finally, land cover does not determine legal land use. Harris County Community Development administers the comprehensive plan, zoning regulations, and the official zoning map. Anyone making a parcel, development, or permitting decision should use those local sources rather than treating forest, agriculture, or developed classes on this page as zoning categories.
Frequently Asked Questions
Where is the most extensive forest visible in Harris County?
Large forest blocks appear through the interior and across much of the north and northeast. Pine Mountain is a useful northern reference because official county and state park sources describe a heavily wooded recreation landscape there. The land-cover layer does not draw park boundaries, so the green areas should be interpreted as classified forest rather than a direct park map.
Why is developed cover 8.74% while mean impervious surface is only 1.60%?
Developed land cover can include low-density places where homes and roads are mixed with trees, lawns, soil, and other permeable surfaces. Impervious surface measures the hard portion more directly. The highest impervious values are therefore concentrated in smaller parts of the broader developed areas.
Does the 30.49% class difference mean that amount of Harris County physically changed between 1985 and 2025?
No. The supplied change map states that differences may include classification variation. The 30.49% value is a map-to-map class difference, not a verified physical conversion rate. Historical aerial imagery and local records are needed to confirm the cause, timing, and extent of a specific change.
Map File Information
This ZIP contains the four original JPG maps for Harris County: land cover, forest and farmland, impervious surface, and 1985–2025 land-cover change.
- Included Files: Original high-resolution map files shown in this article
- File Type: JPG images packaged in a ZIP archive
- Intended Use: Printing, education, presentations, and map-based projects
Related Maps
- Appling County Georgia Land Cover Map
- Atkinson County Georgia Land Cover Map
- Bacon County Georgia Land Cover Map
Sources and References
- MRLC Annual NLCD Data – official Annual NLCD land-cover and impervious data access.
- USGS Annual NLCD Land Cover Classification – land-cover classes and 30-meter raster context.
- Harris County Area Attractions – official county information for Lake Harding, Pine Mountain Trail, and F.D. Roosevelt State Park.
- Cities in Harris County – official information for Hamilton, Pine Mountain, Waverly Hall, West Point, Shiloh, and other communities.
- Harris County Community Development – county planning, zoning, and development information.
- Georgia State Parks – F.D. Roosevelt State Park – official Pine Mountain Ridge park and trail context.
Green Map creates custom-edited map images using open geographic data sources such as geoBoundaries, Natural Earth, OpenStreetMap, and government open data. These maps are edited visual materials, not raw data files, and are provided for education, documents, presentations, and graphic reference.