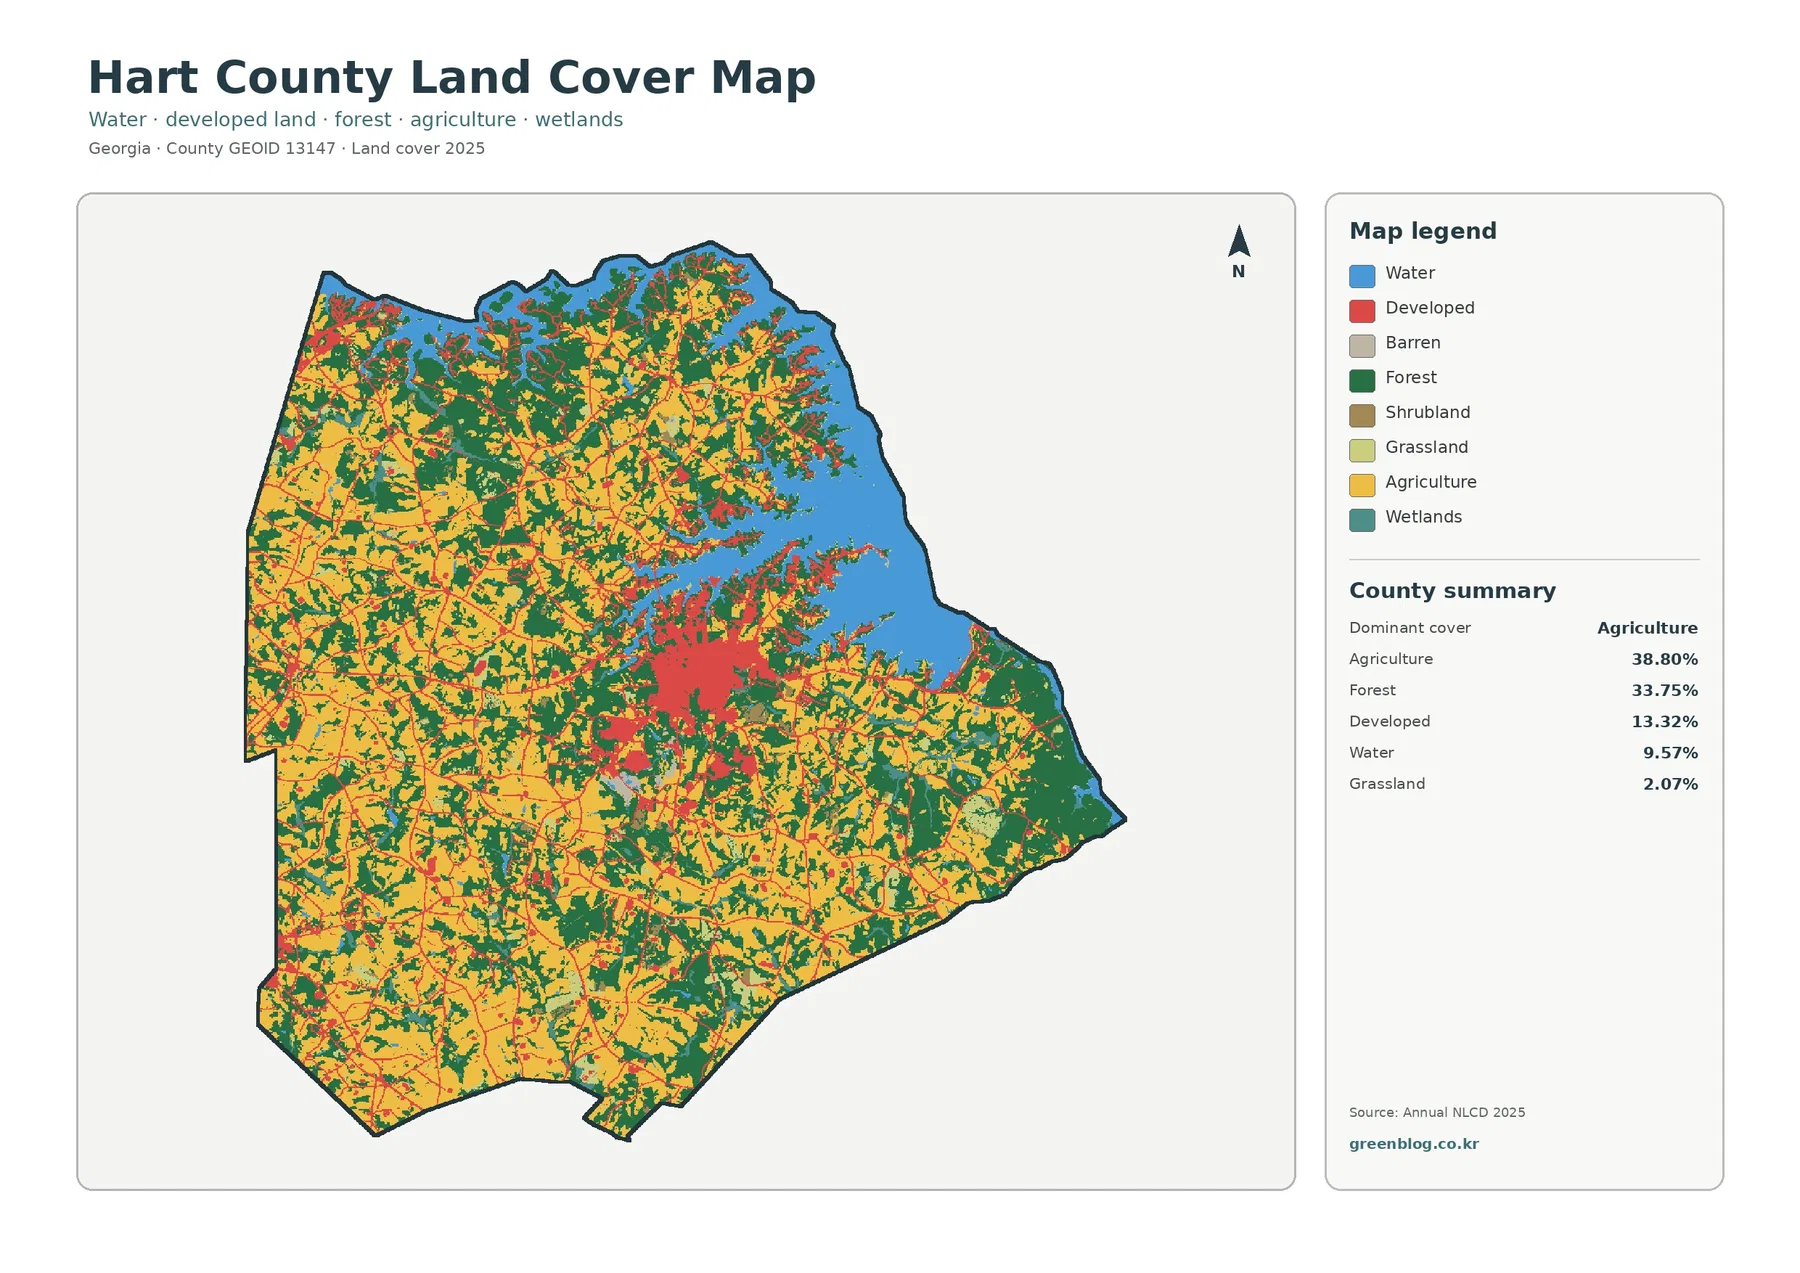
Hart County is unusual among many of the recent Georgia county maps because agriculture, not forest, is the largest 2025 cover class. Agriculture accounts for 38.80%, forest for 33.75%, and developed land for 13.32%. Lake Hartwell fills a large part of the eastern and northeastern edge, while the strongest built concentration sits around Hartwell. This page uses four maps to separate the current cover pattern from farmland detail, impervious surfaces, and mapped differences between 1985 and 2025.
The four original JPG maps are available together in one ZIP download below. They are useful when a larger copy is needed for comparing the lake shore, the Hartwell built area, and the farm-and-forest mosaic across the rest of the county.
Table of Contents
Lake Hartwell is the easiest landmark for making sense of the county-wide pattern
Start on the eastern side of the 2025 map. Lake Hartwell forms a broad blue area with long coves reaching into the county, creating a shoreline that is far more irregular than a simple straight boundary. Hart County’s official website highlights its Lake Hartwell shoreline, and the U.S. Army Corps of Engineers describes Hartwell Lake as a reservoir on the Georgia-South Carolina border connected to the Savannah, Tugaloo, and Seneca river system. That geographic setting is plainly visible in the supplied map.
Water makes up 9.57% of the county summary. Its importance is larger than the percentage alone suggests because the lake touches many different land-cover areas. Forest frequently reaches the shore, while agriculture and developed cover also appear close to the water in several places. The branching coves create repeated edges where blue water meets green forest, yellow agricultural land, or red developed cells.
The Hartwell built area lies just inland from the lake and forms the map’s largest continuous red cluster. Smaller developed patches extend away from that center along roads and rural settlements. Another noticeable concentration appears near the northwestern edge. Hart County’s official description places the county on the I-85 corridor and specifically mentions Exit 177, providing a useful geographic reference for that corner without requiring the land-cover map itself to label the highway.
Wetlands account for 1.46% and are much less extensive than open water. They appear as scattered teal areas, often near water or low-lying parts of the landscape. Those cells should not be treated as a regulatory wetland boundary. Annual NLCD classifies surface cover at a generalized grid scale, so a wetland inventory or site assessment is still necessary for a property-level question.
Agriculture leads the county total, but it is interwoven with forest rather than forming one farm block
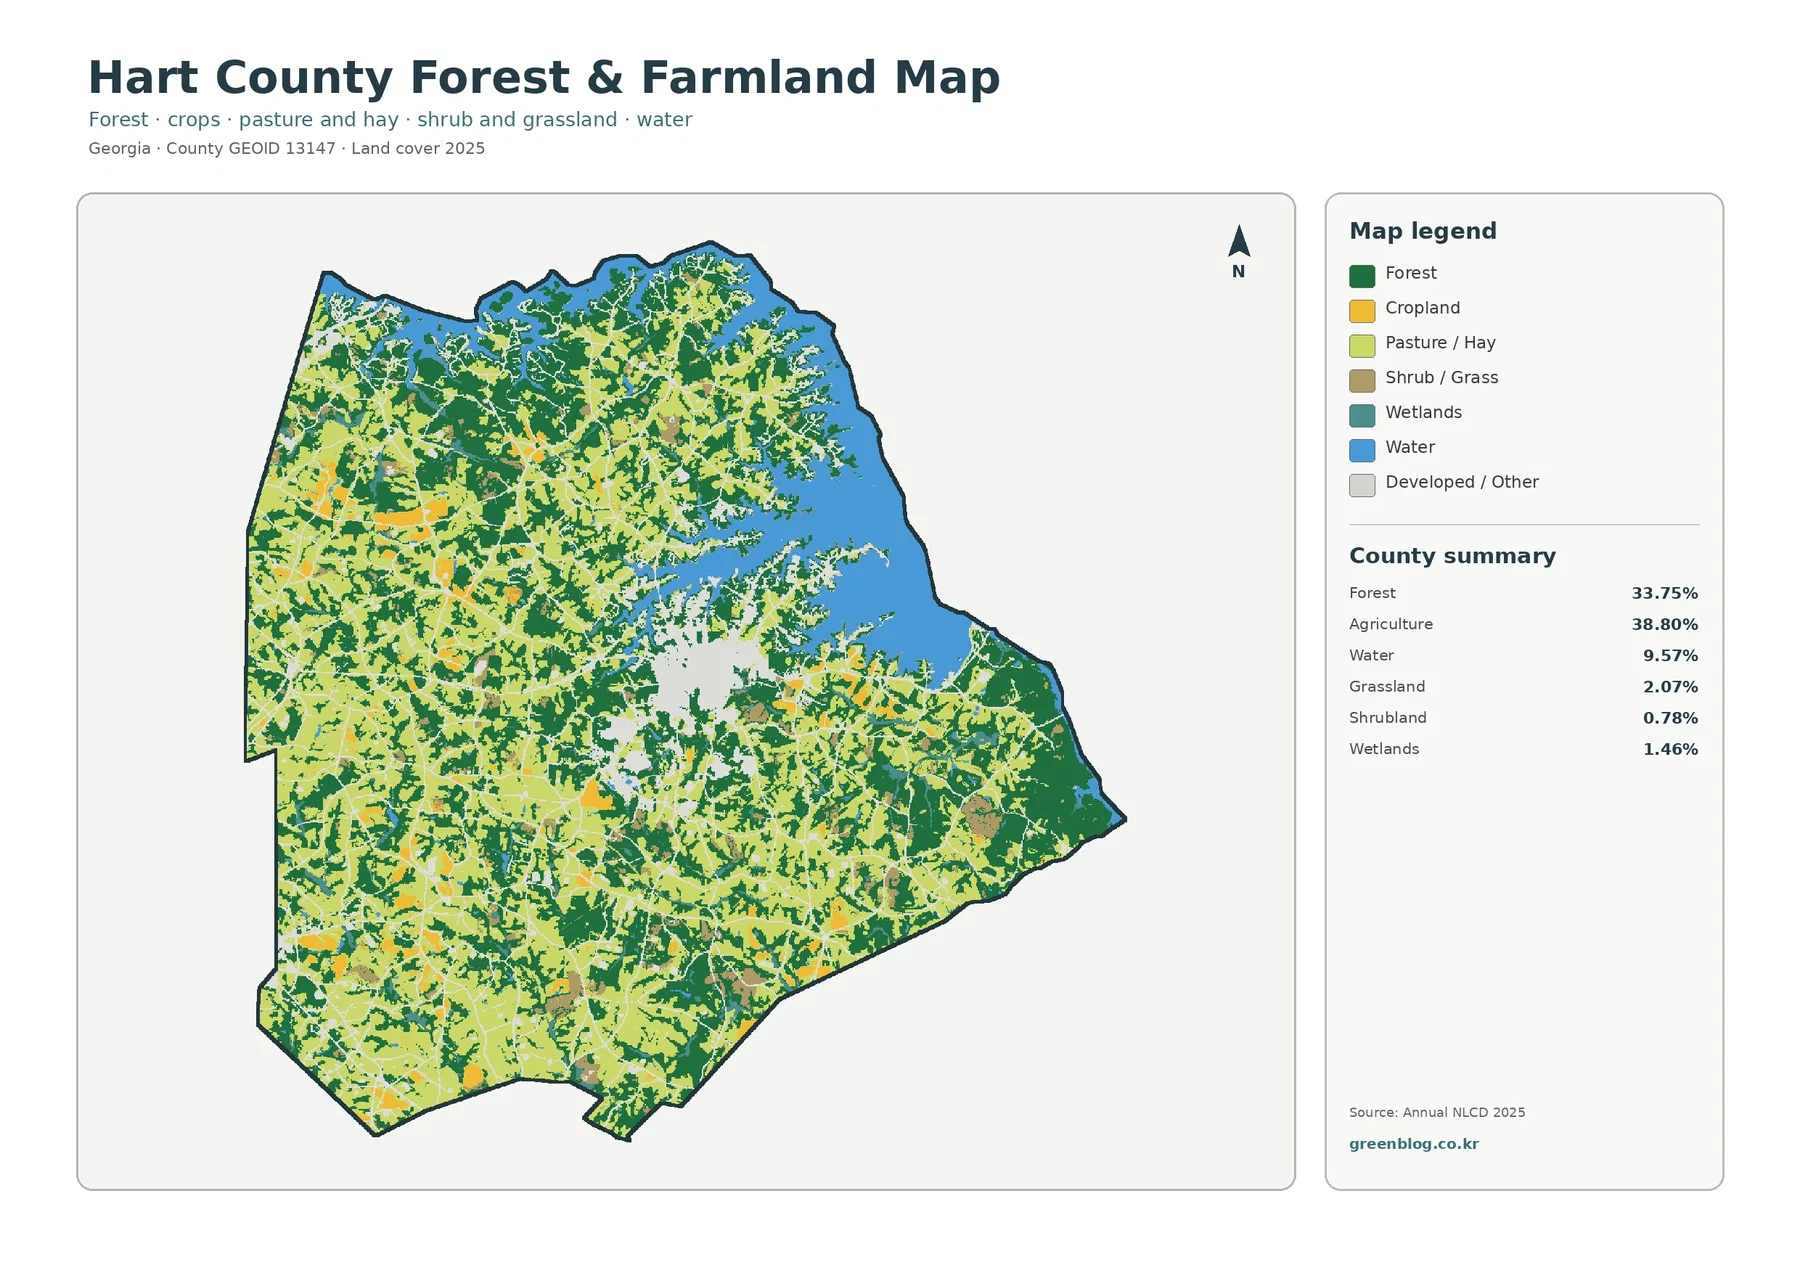
The 38.80% agricultural share is the defining statistic in this map set. Yellow agricultural cover is widespread across the west, southwest, south, and much of the interior. It does not form one uninterrupted field region. Dark green forest repeatedly cuts through it, while pasture, grass, small developed areas, and streams create a patchwork that changes over short distances.
The forest-and-farmland map helps separate that patchwork. Cropland and pasture/hay are shown as different classes, while shrub/grass is kept separate from both. The county summary lists grassland at 2.07% and shrubland at 0.78%. Those smaller categories matter because some light-colored rural areas are pasture or grass rather than cropland, and treating them all as one farm class would flatten the actual pattern.
Forest remains substantial at 33.75%. Larger green areas appear in the northern part of Hart County and near several Lake Hartwell coves, although wooded strips and blocks also occur throughout the agricultural interior. The resulting landscape is not well described as “farm country in the west and forest in the east.” A better reading is that farming is widespread, while wooded land repeatedly divides and borders those open areas.
This distinction is useful for habitat or watershed discussions. A large uninterrupted forest block and a narrow wooded strip between fields may receive the same basic forest color but serve different landscape roles. The land-cover map cannot measure habitat quality by itself, yet it can identify where wooded cover is broad, where it becomes fragmented by farms, and where water or developed land creates another edge.
Hard surfaces are concentrated around Hartwell even though the county-wide mean is only 2.86%
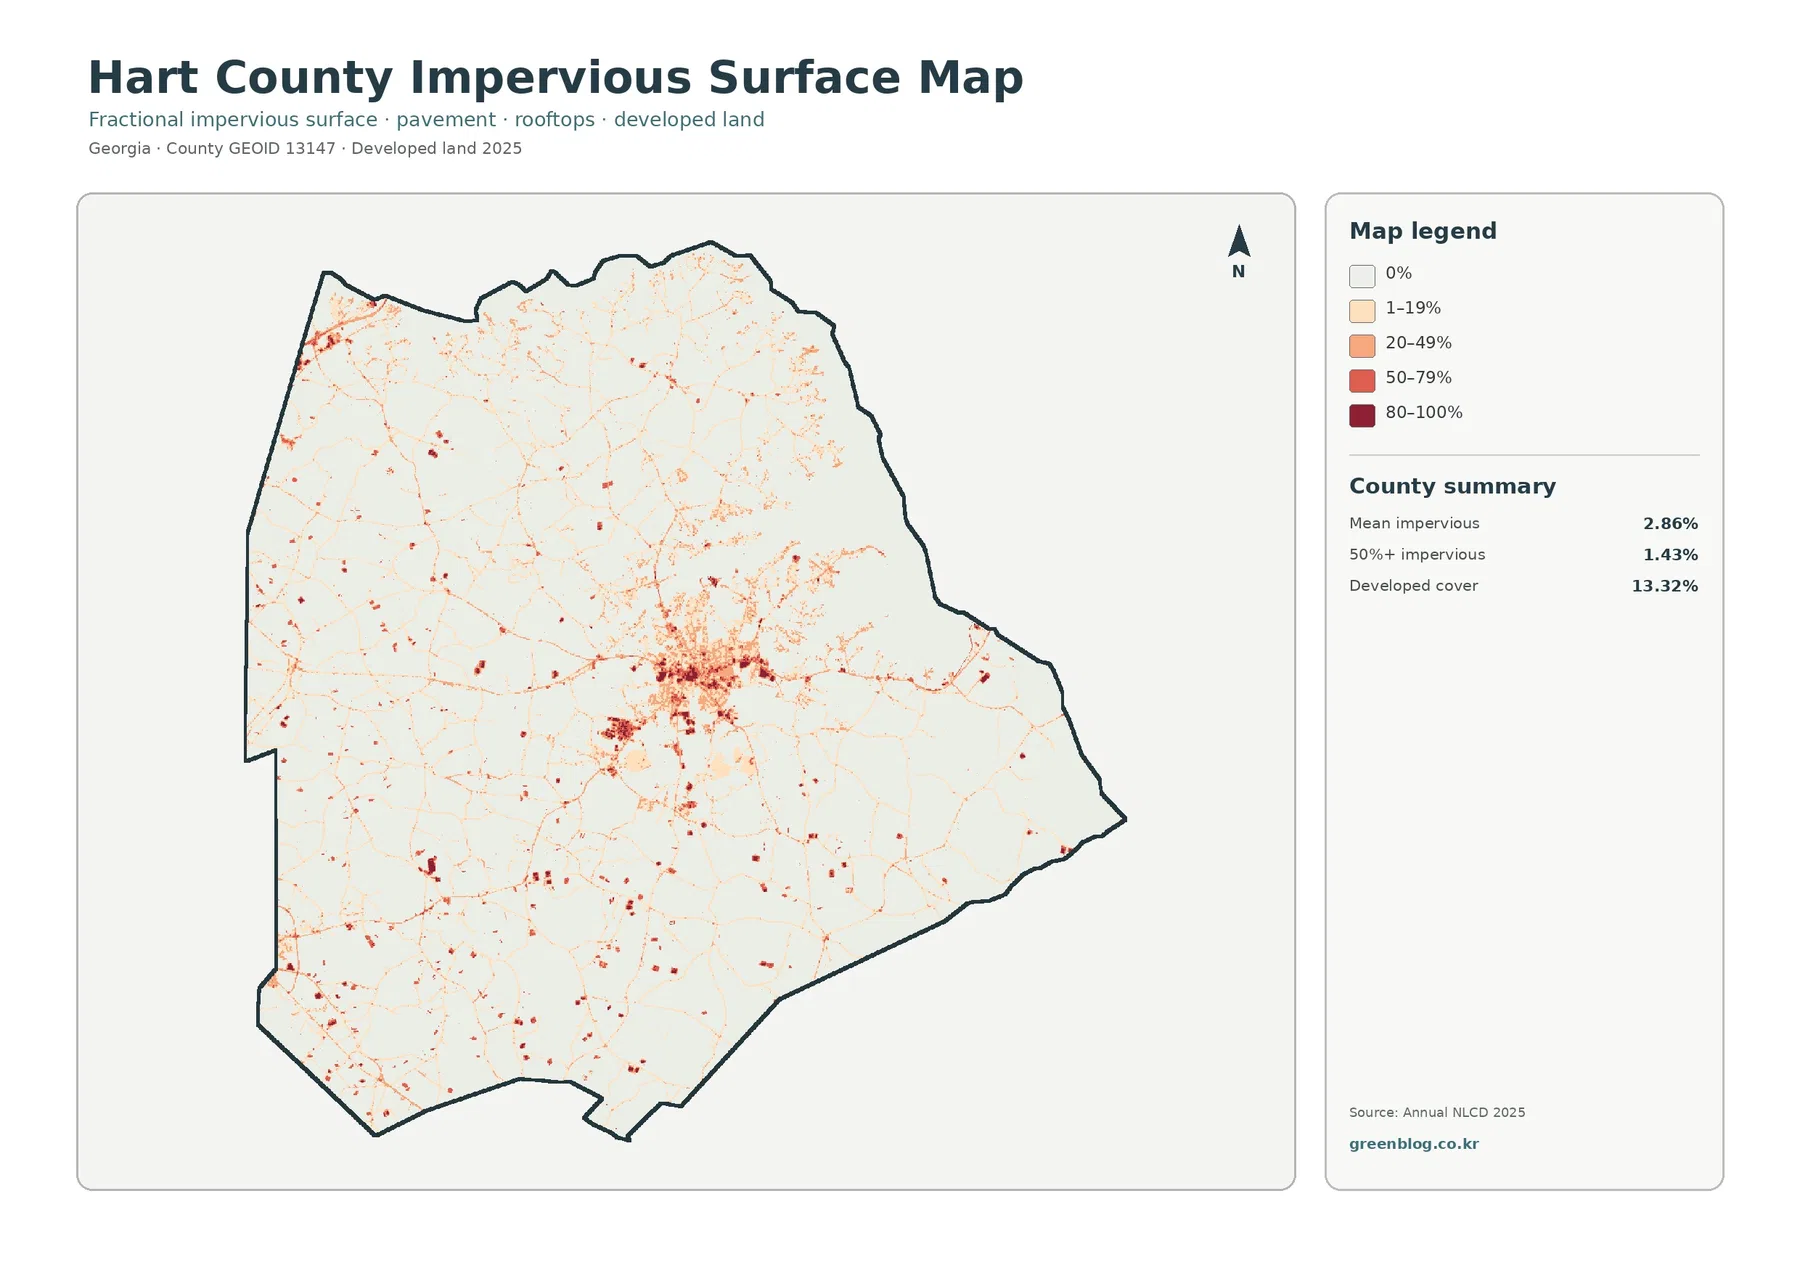
Impervious surface means pavement, rooftops, parking areas, and other hard surfaces that do not readily absorb rainfall. Hart County has a mean impervious value of 2.86%, and 1.43% of mapped cells are at least 50% impervious. Those numbers are much smaller than the 13.32% developed-cover share because a developed land-cover cell can still contain lawns, trees, bare soil, and other permeable ground.
The strongest impervious concentration is centered on Hartwell. Dark red cells form a compact core, surrounded by progressively lighter values that spread along several routes. This is a useful contrast with the general land-cover map. There, the whole urban area appears red as one developed class; here, the map separates a hard-surfaced center from lower-density developed surroundings.
A second noticeable concentration occurs toward the northwestern edge of the county. Hart County’s official page places the county in the I-85 corridor and mentions Exit 177, so the location can be compared with that transportation context. The map does not label individual roads, however, and an impervious cell should not automatically be identified as a highway, warehouse, parking lot, or specific facility without another source.
Along Lake Hartwell, most of the shoreline remains lightly colored on the impervious map, but small hard-surface patches are scattered around several coves. The Corps of Engineers documents parks, marinas, campgrounds, and other recreation uses around Hartwell Lake, but the land-cover product does not distinguish those facilities from homes, roads, or other development. The proper conclusion is simply that impervious surfaces occur in some shoreline areas, not that every mapped patch has the same use.
The lake, farm country, and town center create three very different map-reading contexts
Hart County’s official description combines three features that also help organize the map: Lake Hartwell, the town of Hartwell, and rural districts with gently rolling terrain. The land-cover layers do not map terrain elevation, so the hills themselves should not be inferred from the colors. What the maps do show clearly is that the county’s surface cover changes from water-dominated shoreline areas to a built town center and then to a broad agricultural-and-forest interior.
Near the lake, the main question is often what kind of cover reaches the shoreline. Forest is common, but agricultural and developed cells occur as well. Around Hartwell, the more useful question is density: the impervious map separates the hard-surfaced center from lower-density development. In the rural interior, the forest-and-farmland map becomes more informative because cropland, pasture/hay, and woodland alternate across the landscape.
Using the maps this way prevents one legend from doing too much work. A single red developed class cannot tell you how much pavement exists. A single yellow agricultural class cannot distinguish every field from pasture. A blue water class cannot tell you shoreline ownership or recreational access. Each map answers a narrower question, and the county becomes easier to understand when those questions are kept separate.
The county’s location on the Georgia-South Carolina side of Hartwell Lake also means the water is part of a larger interstate reservoir system rather than an isolated county lake. The Corps of Engineers notes that Hartwell Lake spans the state border and follows the Savannah, Tugaloo, and Seneca river system. That information explains why the eastern water body continues beyond the county boundary even though this map clips the display to Hart County.
The 1985–2025 comparison shows 22.70% class difference, with development change concentrated in smaller areas
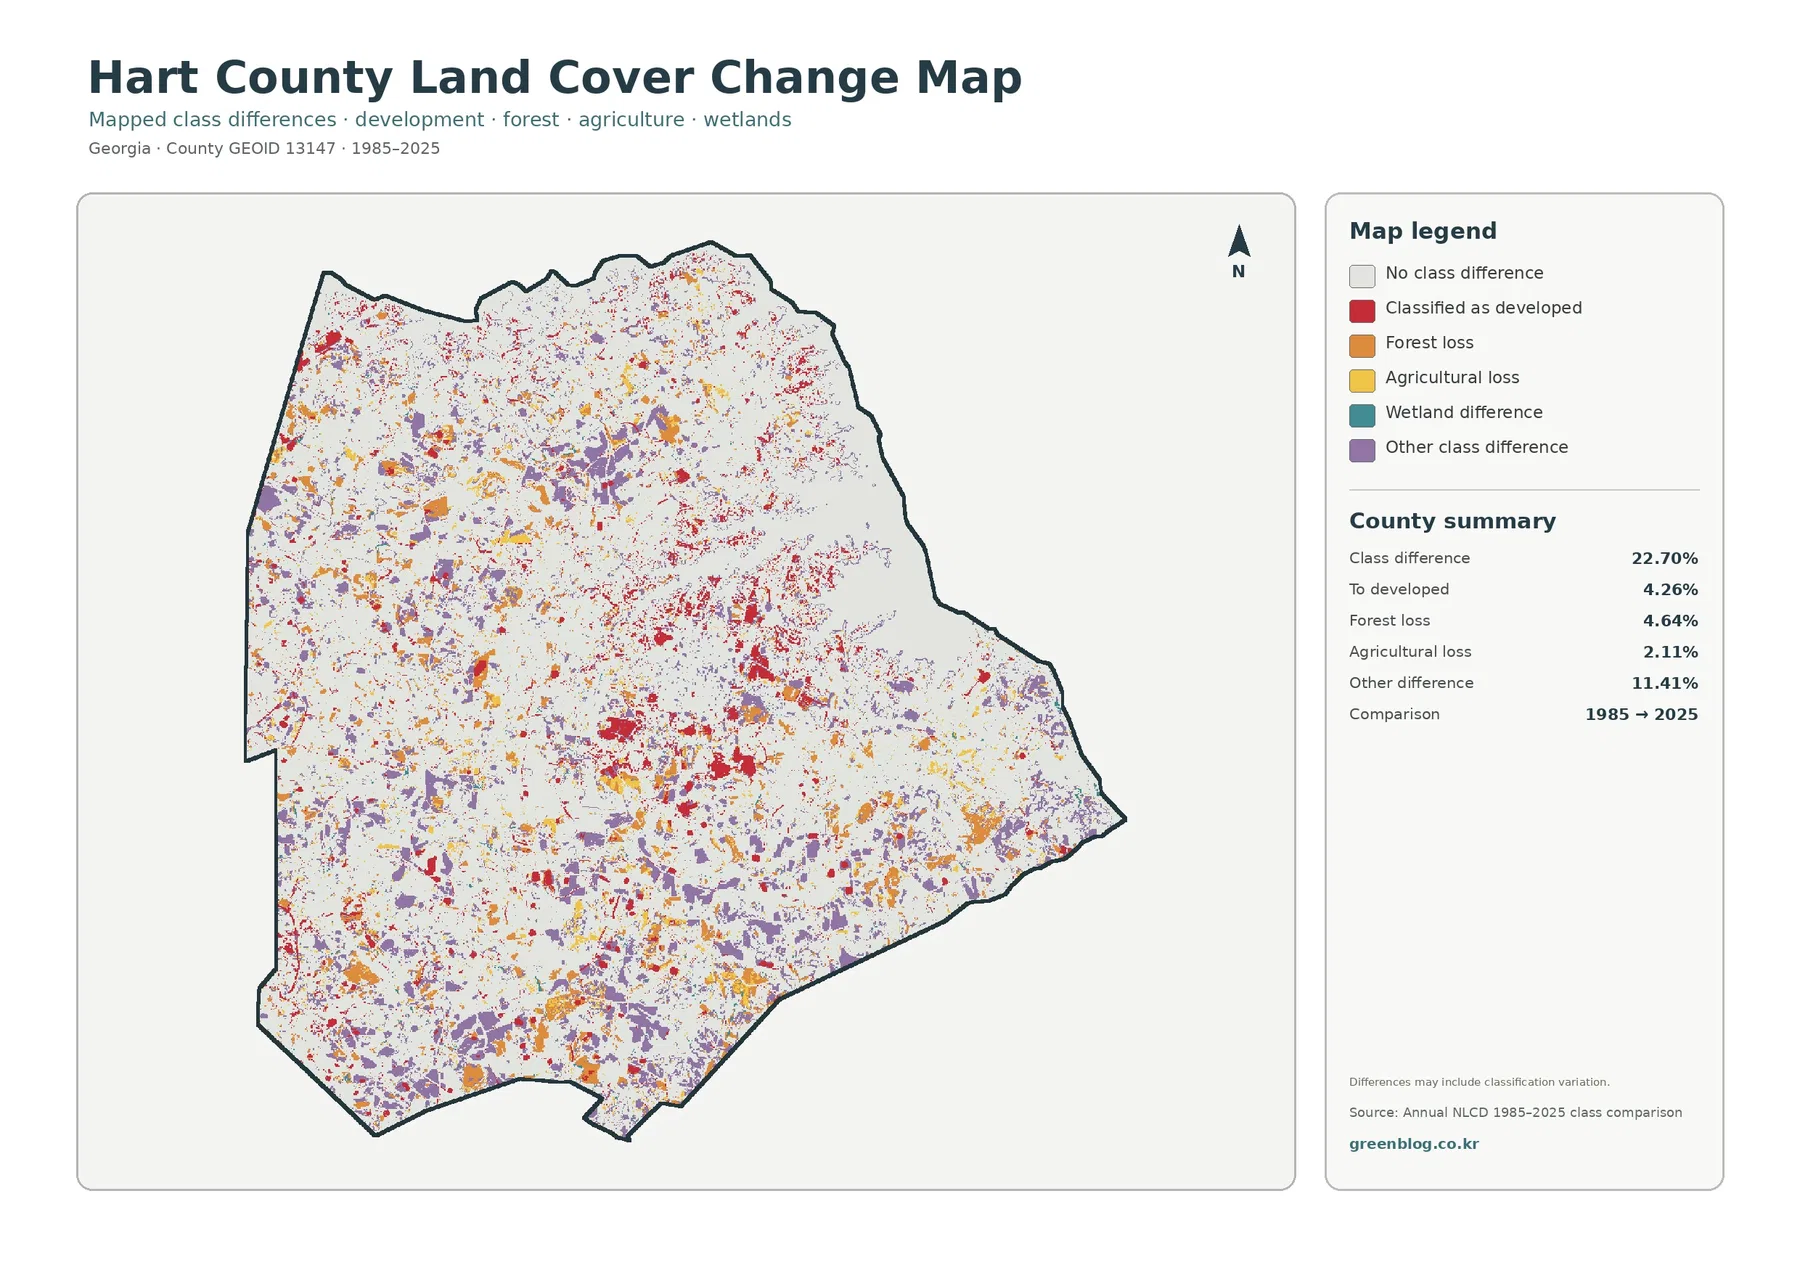
The supplied change map reports 22.70% total class difference between 1985 and 2025. Its named categories include 4.26% classified to developed, 4.64% forest loss, 2.11% agricultural loss, and 11.41% other class difference. Purple other-difference patches are widely scattered, while red classified-to-developed areas appear more strongly around Hartwell and in smaller concentrations along settled corridors.
The 22.70% figure is not a verified percentage of Hart County that physically changed land use. The map itself warns that mapped differences may include classification variation. Differences in imagery, classification methods, mixed pixels, and observation conditions can all change the assigned class even when the ground change is less dramatic than the map color suggests.
The 4.26% classified-to-developed value should also be kept separate from the 13.32% current developed share. One is a comparison category between two dates; the other is the 2025 land-cover total. Around Hartwell, red change areas overlap the county’s largest present-day developed cluster, but the change layer does not identify which subdivision, road, commercial site, or public facility was responsible.
Forest loss at 4.64% and agricultural loss at 2.11% appear in many small patches across the county. Some are close to current farms or development, while others lie inside areas that remain broadly wooded or agricultural today. A small orange or yellow patch can be a useful place to investigate, but historical aerial photographs, parcel records, and local planning information are needed before assigning a cause or exact date to it.
A four-map workflow for comparing farms, shoreline, development, and long-term change
For a first pass, use the general land-cover map to establish the county’s proportions and landmarks. Lake Hartwell provides an obvious eastern reference, and the Hartwell built cluster is easy to find just inland. From there, the widespread yellow agricultural cover and green forest can be compared without getting lost in individual pixels.
The forest-and-farmland map is the best second step because agriculture is Hart County’s largest class. It separates cropland from pasture/hay and keeps shrub/grass visible as another category. This matters for classroom work, rural-landscape comparisons, and watershed presentations where “open land” is too broad a label.
Next, move to impervious surface when the question changes from where development exists to how hard-surfaced it is. The difference between 13.32% developed cover and a 2.86% county mean impervious value is an effective example of why land-cover classes and surface percentages should not be treated as the same measure. Hartwell’s central core makes that contrast especially easy to see.
Use the change map last. Once the 2025 landscape is familiar, the red, orange, yellow, teal, and purple change categories have a clearer frame of reference. This order works well in a presentation: current cover first, rural detail second, hard surfaces third, and the 1985–2025 comparison last. It reduces the temptation to treat every change pixel as a confirmed event.
What the colors cannot tell you about parcels, zoning, shoreline rules, or exact change
Annual NLCD is a land-cover classification, not a parcel survey. USGS documentation describes the product as a 30-meter raster. Each grid cell is assigned a representative class even though trees, grass, a road, a building, and bare soil may all occur within the same area. A sharp edge between two map colors is therefore a classification boundary, not a surveyed property line.
This is particularly important in Hart County’s farm-and-forest mosaic. A yellow cell does not identify the legal boundary of a farm, and a green cell does not establish forest ownership or protection status. Zoning, development permission, conservation restrictions, and tax classification come from different records. Anyone making a site-specific decision should use current parcel data and local regulations in addition to the land-cover map.
Lake Hartwell adds another limitation. The land-cover map can show water, wetlands, forest, agriculture, and developed surfaces near the shoreline, but it cannot define shoreline-management rules, public access, flood zones, or Corps property boundaries. The U.S. Army Corps of Engineers maintains separate Hartwell Lake information for those subjects.
The change layer deserves the most caution because it compares classifications from two dates. Broad repeated patterns can identify useful places to investigate, but a small change patch is not proof of logging, construction, agricultural abandonment, or wetland alteration. Historical imagery and local records are needed to confirm what happened on the ground and when it occurred.
Frequently Asked Questions
Is agriculture really the largest 2025 land-cover class in Hart County?
Yes. The supplied 2025 summary lists agriculture at 38.80% and forest at 33.75%. The map still contains large wooded areas, especially in the north and around parts of Lake Hartwell, so the county should not be pictured as one continuous farming block.
Why does Hart County have 13.32% developed cover but only 2.86% mean impervious surface?
A developed land-cover cell can include lawns, trees, soil, and other permeable surfaces along with roads and buildings. Impervious surface measures the hard portion more directly. The densest values cluster around Hartwell, while much of the broader developed area has lower percentages.
Can the 22.70% class difference be used as Hart County’s physical land-change rate?
No. The supplied 1985–2025 map states that differences may include classification variation. The value summarizes cells assigned to different classes in the comparison, not verified parcel-level conversion. Historical imagery and other local evidence are needed to confirm a specific change.
Map File Information
This ZIP contains the four original JPG maps for Hart County: 2025 land cover, forest and farmland, impervious surface, and the supplied 1985–2025 land-cover change map.
- Included Files: General land cover, forest and farmland, impervious/developed surface, and land-cover change maps
- File Type: Four original JPG map files bundled in one ZIP archive
- Intended Use: Printing, education, presentations, and map-based projects
Related Maps
- Appling County Georgia Land Cover Map
- Atkinson County Georgia Land Cover Map
- Bacon County Georgia Land Cover Map
Sources and References
- MRLC Annual NLCD Data – official access and background for Annual NLCD land-cover and impervious products.
- USGS Annual NLCD Land Cover Classification – land-cover classification guidance and 30-meter raster context.
- Hart County – About Hart County – official county background on Hartwell, Lake Hartwell shoreline, rural districts, and the I-85 corridor.
- U.S. Army Corps of Engineers – Hartwell Dam & Lake – official lake geography and project background.
- UGA Extension – Hart County – county Extension information and agricultural education context.
- U.S. Census Bureau TIGER/Line Shapefiles – official geographic boundary data.
Green Map creates custom-edited map images using open geographic data sources such as geoBoundaries, Natural Earth, OpenStreetMap, and government open data. These maps are edited visual materials, not raw data files, and are provided for education, documents, presentations, and graphic reference.